


Abstract
Surface water floods (SWFs) that lead to household losses are mainly localized phenomena. Research on describing the associated precipitation characteristics has previously been based on case studies and on the derivation of local rainfall thresholds, but no approaches have yet been presented on the national scale. Here, we propose a new way to overcome this scaling problem. We linked a gridded precipitation dataset based on both rainfall gauges and radar data with geolocated insurance claims for all of Switzerland. We show that the absolute thresholds vary markedly over complex terrain, and we thus propose basing early warning systems for predicting damage-relevant SWF events on local quantiles of maximum intensity and the total sum of event precipitation. A threshold model based on these two parameters is able to classify rainfall events potentially leading to damage-relevant SWF events over large areas of complex terrain, including high mountains and lowland areas, and a variety of geological conditions. Our approach is an important step towards the development of impact-based early warning systems. Weather warning agencies or insurance companies can build upon these findings to find workarounds for issuing user-targeted warnings at national scale or for nowcasting purposes.
Export citation and abstract BibTeX RIS

Original content from this work may be used under the terms of the Creative Commons Attribution 3.0 licence. Any further distribution of this work must maintain attribution to the author(s) and the title of the work, journal citation and DOI.
1. Introduction
Floods are one of the most damaging natural hazards that account for the majority of all economic losses from natural hazards worldwide [1]. Floods are driven by a variety of hydrometeorological processes that depend on the sizes and the characteristics of river basins and catchments. In mountainous areas, floods of small tributaries and minor watercourses can cause relevant damages. These small-scale floods mostly occur during short-duration high-intensity precipitation events, which are typically related to thunderstorms [2]. Moreover, these short-duration heavy precipitation events can lead to surface water floods (SWFs) or to pluvial floods along with associated damage. An SWF is defined here as the surface overland flow of water that cannot be drained and is directed towards a watercourse but does not originate from it nor has reached it [3]. This definition includes the overflowing of sewage and drainage systems. SWFs are characterized by overland flow and ponding. In contrast, fluvial floods (FFs) comprise flooding that stems from a watercourse. Thus, SWFs are expected to be more directly related to precipitation than FFs. In Switzerland, approximately one-third of the insured damage caused by weather-related hazards is caused by floods [4]. This includes damage from both FFs and SWFs. SWFs account for approximately one-fourth of the damage, and FFs including lake floods account for the remaining three-fourths of the damage [3]. However, SWFs account for approximately the same absolute number of insurance damage claims as FFs [3], indicating that SWFs are a very frequent flood process. Despite the high frequency of SWFs, this hazard process is not as well studied as FFs by far, with the main reason being that it is more difficult to obtain reliable data on SWF events. This is an important research gap, since SWF-triggering hydrometeorological processes and local disposition of SWFs are the basis for better process understanding, potential forecasting and warning applications and are critical in light of future climate change [5]. Indeed, with the observed [6, 7] and projected [8] increases of heavy precipitation events, the impacts of SWFs will become more relevant for flood risk management and insurance [9–14]. Thus, we aim to link precipitation and damage.
Recently, novel approaches have been developed and evaluated to map areas affected by SWFs [15] and to assess the exposure to these processes [5]. Moreover, first attempts have been made to develop early warning systems for SWF events [16–22]. However, the development of such early warning systems is challenging. A crucial factor for their development is the characterization of the triggering event, i.e. the rainfall event. There are several open questions in the analysis of thresholds for triggering SWFs that lead to damages: e.g. should rainfall events be classified by intensity, duration, or total sum of precipitation? This question requires classifying rainfall events by severity and examining the possible impacts on values at risk (e.g. houses). Consequently, damage related events must be distinguished from minor events not leading to losses [23–25]. The triggering rainfall event must be analyzed in terms of rainfall intensity, precipitation sum and duration. A further open question relates to the role of antecedent conditions for triggering floods [26].
In summary, a prerequisite for the development of impact-based SWF early warning systems is knowledge of the relationship between rainfall characteristics and damaging SWFs. The relationship between rainfall characteristics and damage due to SWFs requires linking precipitation data with damage data [27]. In Switzerland, georeferenced data on flood losses is exclusively available from insurance loss claims.
Insurance data has previously been used in a few studies. Moncoulon et al [28] analyzed insurance market exposure to both FFs and SWFs. A review of using damage data and insurance data in the analysis of SWFs is given by Gradeci et al [29]. Insurance claim data are also used for validating flood models [30–32]. Hurford et al [33] evaluated the return periods of rainfall thresholds that are used for warnings by linking rainfall intensities with observed SWFs using data from fire and rescue services. Cortès et al [34] analyzed the relationship between flood-related insurance claims and heavy precipitation at the postal code level using daily precipitation accumulations. However, this study did not differentiate between FFs and SWFs. A similar approach has been described by Spekkers et al [35], who found that a substantial amount of variance was left unexplained and proposed studying other explanatory variables such as topographical uncertainty and urban drainage system properties. These studies are limited by the level of spatial aggregation and the coarse spatiotemporal resolution of rainfall data.
There is a current lack of studies that analyze the characteristics of precipitation events leading to damage-relevant SWFs at the single object level, e.g. at the location of the insurance claim, and that use rainfall data at a very high spatiotemporal resolution. Based on previous studies [3, 15] and on [28], we hypothesize that a higher spatiotemporal resolution of both the rainfall data and the damage data will help to better explain the relationship between precipitation and damage claims related to SWFs. A high spatial resolution is expected to be especially relevant in complex terrains such as Switzerland. Precipitation in Switzerland is strongly related to its complex orography, such as the main Alpine ridge and the lower Jura Mountains in the northwest of the country at the border with France and Germany. Climatologically, the inner-Alpine valleys are generally drier while the northern and southern rims of the Alps receive more precipitation [36–40]. There is a fundamental difference in the daily precipitation frequency distribution between the areas north and south of the Alps [40]. In addition to precipitation, the ability of the ground to drain water from the surface plays a crucial role in SWFs. This ability is related to several factors including geology, geomorphology, land use and urbanization, namely, the sealing of areas, the provision of drainage, and the blockage of drainage infrastructure by material such as debris or hail. All these factors vary remarkably across Switzerland, having both urban and rural areas, steep and flat morphology, as well as different socio-economic circumstances [3]. The development of impact-based early warning systems at a national scale must therefore consider the high variability of precipitation and terrain characteristics.
In this study, we aim to assess precipitation characteristics leading to damage-relevant SWFs over a variety of landscapes and over large regions of complex terrain. The complexity is produced by climatology along with topographical and geological variety. This analysis should provide the basis for defining rainfall thresholds that are relevant for nowcasting or forecasting damage-relevant SWF events at a national scale. To achieve this goal, we must answer several research questions. Can we identify SWF-triggering precipitation thresholds? Are these thresholds dependent on the precipitation intensity and duration, antecedent precipitation, weather pattern, temporal evolution of precipitation intensity, and antecedent rainfall? Is there a spatial variation in damage-relevant thresholds over Switzerland that would point to a strong dependence on land-use or soil or geological properties? By answering these questions, we would like to contribute to the development of early warning systems related to SWFs. We aim at developing a parsimonious model for identifying rainfall events that trigger damage-relevant SWFs and for mapping areas affected by such events based on meteorological factors. We hypothesize that a model with that purpose roots in a definition of thresholds that are related to the local precipitation climatology.
2. Data and methods
We use datasets of precipitation and damage claims at a very high spatial and temporal resolution and link them to analyze the characteristics of rainfall events triggering damage-relevant SWFs.
2.1. Damage reports and damage events
In this study, single claims made to insurance companies are referred to as damage claims. Flood damage claim data were made available to us by Swiss Public Insurance Companies for Buildings (PICBs) and by the Swiss Mobiliar Insurance Company, a private cooperative insurance company (CIC). PICBs insure the vast majority of buildings in 19 of the 26 Swiss cantons (figure 1). This is because insurance against natural hazards, including flooding from FFs and SWFs, is mandatory in these 19 Swiss cantons. Hence, the PICBs have a state-regulated monopoly. We were given access to building damage claims from 14 of the 19 PICBs. The data from the CIC cover two types of damages: damages to building structures (available for the cantons without a monopoly situation) and damages to household contents (available for all of Switzerland except for the cantons of Nidwalden and Vaude). However, this dataset does not cover the total of insured values as valid for the PICBs, but instead represents samples of the whole due to the free market conditions in these cantons.

Figure 1. Maps of Switzerland showing the availability of SWF damage data (2005–2013). (a) Shows the absolute number of SWF damage claims for every grid cell (PICB + CIC claims). (b) and (c) show the number of PICB and CIC claims in the grid cells, respectively. (d) Shows the number of buildings in the same spatial aggregation units.
Download figure:
Standard image High-resolution imageWhile the insurance data are available from between 1981 (canton Solothurn) and 2004 (canton Zug) until the end of 2013, the precipitation dataset is available from 2005 to the present. Therefore, the investigation period ranges from 1 January 2005 to 31 December 2013. The insurance datasets contain information on the exact locations and dates of the damages. Uncertainty in the data is primarily due to clients potentially filing damages for the wrong date and imprecise location information. Further uncertainty is discussed in Bernet et al [3]. Damage categorized as a flood claim in the insurance datasets includes any damage caused by water entering a building from above the ground, irrespective of the exact flooding process. Hence, no distinction between SWFs and FFs is made by the insurance companies. For that reason, Bernet et al [3] developed a method to classify damage reports into damages caused by (a) most likely SWF, (b) likely SWF, (c) either SWF or FF, (d) likely FF, and (e) most likely FF. The same approach is applied to classify every location of the insurance claim datasets using these categories. Henceforth, categories (a) and (b) will be referred to as 'SWF damages' and categories (c)–(e) will not be considered in this study. Of the 39 556 available damage claims between 2005 and 2013, 15 803 were attributed to SWFs, 21 399 to FFs, and 2354 could not be assigned.
The 15 803 SWF damage claims were caused on 908 out of 3287 d in the considered 9 year study period (27.6%) and these days are referred to as damage days. The SWF damage claims correspond to 4329 damage locations. A high number of damage claims was concentrated on a few specific days (figure 2). Thus, the distribution of damage claims per damage day is highly skewed. The damage day with the highest number of damage claims (1355) was 21 June 2007. Shortly thereafter, a high number of damage claims were reported on 7–9 August 2007 (350, 533, and 782 damage claims respectively) and 29 August 2007 (661 damage claims). The second largest number of damage claims were filed on 22 August 2005, which is within a three-day period of 21–23 August 2005, when anomalously many claims were reported (825, 1143 and 213 damage claims, respectively).
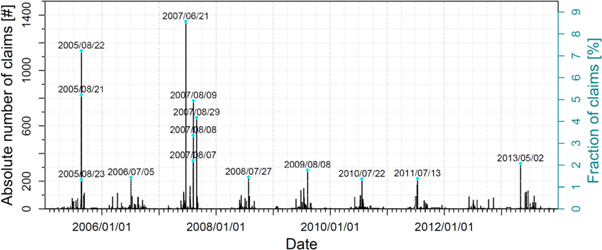
Figure 2. Timeline from 1 January 2005 to 31 December 2013 showing the number of insurance damage claims (CIC + PICB) per day in absolute (count; left black axis) and relative terms (% of the total 15 803 claims; right blue axis). Damage days with ≥200 damage claims are highlighted and labeled with the respective date.
Download figure:
Standard image High-resolution image2.2. Precipitation data
CombiPrecip is a precipitation dataset that combines radar and rain-gauge data [41]. It is operationally produced by the Federal Office of Meteorology and Climatology MeteoSwiss. CombiPrecip has a 1 km by 1 km spatial resolution and an hourly temporal resolution. CombiPrecip is the result of a geostatistical blending between the radar data from the Swiss radar network [41, 42] and the rain-gauge measurements from the automatic ground weather stations operated by MeteoSwiss. The rain-gauge data are considered the primary variable, while the radar measurements are used as a trend for the kriging routine. This means that the radar field is locally adjusted depending on the precipitation measured by the rain-gauges nearby.
2.3. Linking SWF damage data with precipitation data
The precipitation data and SWF damage data have different spatial and temporal scales. In the damage dataset, each record is spatially represented as a point and the data have a daily temporal resolution, while the gridded precipitation dataset has a spatial resolution of 1 km by 1 km and an hourly temporal resolution. Thus, both datasets must be brought to a common spatial and temporal reference.
2.3.1. Spatial aggregation of damage data
We aggregated insurance claims to the spatial grid of the precipitation data. The aggregation is necessary to obtain a comparable spatial resolution between the insurance claim and precipitation data and to guarantee client anonymity and to adhere to privacy regulations. After aggregation, there were 4329 (6150) 1 km by 1 km raster cells with at least one SWF (any flood) damage claim between 1 January 2005 and 31 December 2013 (figure 2).
2.3.2. Gridded precipitation time series, precipitation events and damage trigger events
We refer to days with at least one SWF damage claim in our dataset as damage days. Furthermore, a damage location is a cell of the 1 km by 1 km precipitation grid within which at least one SWF damage claim was filed in the investigation period. Thus, the SWF associated with the damage day at a specific damage location is referred to as a damage event. The reported damage date is inherently uncertain, and consequently the damage day as well. The insurance company needs to record the date of a damage caused by a process that may span over night, over several days, may occur without anybody's notice or may cause damage over a period of several days. Moreover, there is no convention for recording a damage date among the insurance companies and assigning a precise damage date does not lie in their primary interest. To consider these inherent uncertainties, we have developed an objective scoring method, to identify the triggering precipitation event for each damage event in an objective manner that could be applied programmatically to all damage events.
Prior to linking the damage days with the precipitation data, a precipitation time series was extracted for each grid cell that corresponded to a damage location from the CombiPrecip dataset. The time series for the damage locations cover the period from 1 January 2005 to 31 December 2013. To adjust for the spatial uncertainty of the rainfall interpolation method and the horizontal transport of rain, we applied a 9 km by 9 km moving window to extract the spatially averaged precipitation data at each damage location. Subsequently, we identified precipitation events in each precipitation time series using the following criteria: (i) a minimum precipitation sum over the entire event of 10 mm and (ii) a continuous minimum hourly precipitation intensity threshold of 0.1 mm h−1 corresponding to the precipitation detection threshold. A minimum inter-event time of 8 h was defined, according to Aryal et al [43]. A similar two thresholds approach to define events was used by Villarini et al [44]. Precipitation events can last between one hour and several days. For each precipitation event, we gathered the following information: event duration (h); total event precipitation accumulation (mm); maximum, mean and standard deviation of the precipitation intensity (mm h−1); month of occurrence; predominant upper-level flow, such as weather classes, over the Alpine region at the beginning of the precipitation event; and the antecedent precipitation index (APId (mm)), calculated following equation (1):
with APId being the antecedent precipitation on day d, K a coefficient set to 0.8, and Pd−1 the precipitation sum one day before day d. This follows the procedures of Kohler and Linsley [45] and Baillifard et al [46]; however, we adapted our method to hourly time steps. We considered precipitation up to 30 d before the start of the precipitation events, similar to Froidevaux et al [26]. The weather classes stem from Panziera et al [39] and are based on geopotential height fields at 500 hPa. Thirteen classes describing the predominant flow direction are available every 6 h. The weather pattern assigned to each precipitation event was the closest in time before or exactly at the precipitation event start. The temporal evolution of the rainfall event was classified into four categories accordingly to the German Association for Water, Wastewater and Waste [47], and performed by calculating the RMSE between cumulative precipitation and four types of design precipitation events (continuous rainfall, maximum intensity at the beginning, in the middle or at the end of the rainfall event). Next, the damage-triggering precipitation event needed to be identified for damage events, as mentioned before. In order to objectively and programmatically identify a single triggering precipitation event, we assumed that the most extreme event within a time window of maximum 5 d centered on the reported damage date was the damages' cause. The scoring method considered four event characteristics, i.e. the maximum and mean precipitation intensity, the cumulative precipitation as well as the event duration. The event duration was considered in two different ways, i.e. as (i) the fraction of the candidates' time steps overlapping with the window's time steps and (ii) as the candidates' total time steps divided by the time steps overlapping with the time window. The duration was considered in this way as to balance the scoring of long-during events (scoring higher with measure) (i) as well as shorter events (scoring better with measure) (ii). Therefore, the trigger identification method was based on five different variables. First, all precipitation events from the locally-specific time series were considered as potential triggering precipitation events (candidates), if at least one time step occurred during a time window of 1, 3 and 5 d centered on the damage date. Starting with a time window of 1 d, each candidate's score was increased by 1 if one of the five variables exhibited the largest absolute value among these candidates. As an example, the score of the event xi was increased by two, if the event was associated with the highest maximum precipitation intensity as well as the highest cumulative precipitation of all candidates. Then the scoring was repeated for time windows of 3 and 5 d. By using these three increasing time windows, more weight was given to events happening on or closer to the damage date. Finally, the scores of all candidates were summed up and the rainfall event with the highest score was considered to be the triggering precipitation event. Manually checking the assignment of the triggering event, showed that events with a score of 10 or less should not be considered. This accounted for data errors in the damage date, location as well as in the precipitation data. The triggering event's characteristics were then linked to the damage event. An example of the damage trigger's identification procedure is shown in figure 3.
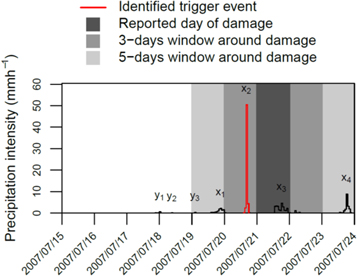
Figure 3. Exemplary identification of the trigger event. Precipitation event x3 has the highest score within the 1 d window for all five variables, but lower scores for the other time windows. Event x2 has the highest scores within the 3 and 5 d window. Overall, the total score of event x2 is largest and, thus, it is considered to be the damage-triggering precipitation event in this example, although it occurred 1 d before the reported damage date.
Download figure:
Standard image High-resolution image2.4. Model for the identification of rainfall events leading to SWFs
The precipitation characteristics over the complex topography of Switzerland are highly variable in space [2, 39] and the spatial precipitation patterns may differ from the distribution of damage locations. To consider this variability, we have derived local quantiles at grid cell level in addition to the precipitation characteristics' absolute values. The advantage of using local quantiles is that the values are directly comparable across all damage locations. Grid cells without any damage observations were excluded from the analyses. In a first step, we compared the absolute values of the damage events' precipitation characteristics to the events with no damage, i.e. the total event precipitation accumulation, maximum and mean precipitation intensity and the standard deviation thereof, as well as the categorical variables including the month of occurrence, weather class, and antecedent precipitation. In a second step, we repeated the comparison with the local quantiles for all but the categorical variables. The differences were tested using the Kolmogorov–Smirnov and Mann–Whitney tests.
Finally, we developed and tested a simple parsimonious threshold model to explicitly identify rainfall events leading to damage-relevant SWFs. We based the model on the percentiles of the precipitation sum and the maximum intensity, because these two variables differed most between damage events and no-damage events (figure 4). Moreover, the quantiles of either or both variables are close to 1 for most events, which indicates that neither of the two variables alone would be a good choice for a model (figure 6). The specific thresholds for the two-variable model were identified by optimizing the symmetric extremal dependence index (SEDI) (equation (3)) as defined in [48]. This metric combines the hit rate (probability of detection) H (equation (3), [49]) and the false alarm rate (probability of false detection) F (equation (4), [49]). In addition, we computed the bias score (frequency bias) BIAS (equation (5), [49]) for analyzing the sensitivity.


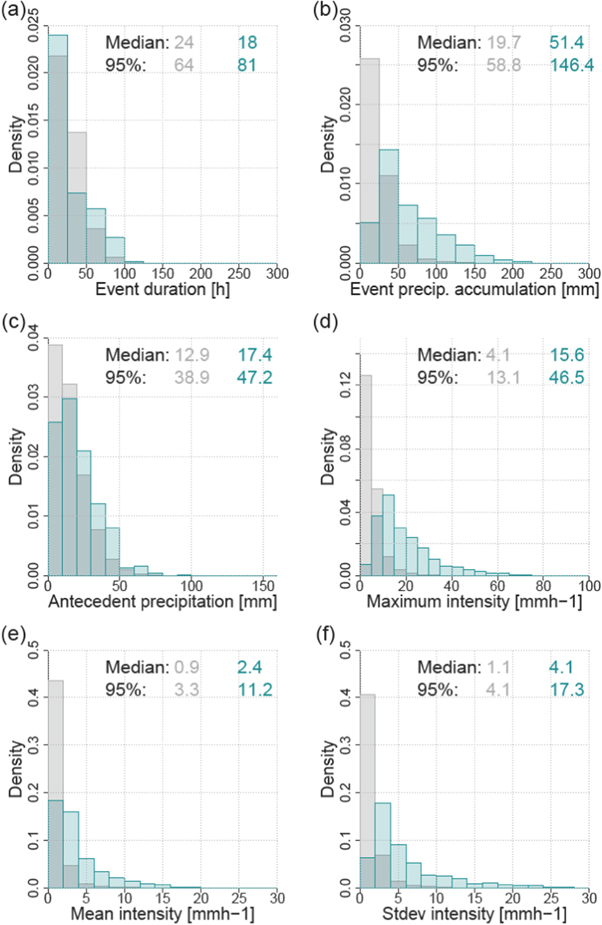
Figure 4. Density distributions of all precipitation events (gray) versus the damage-relevant SWF-triggering precipitation events only (light blue). The absolute values of (a) event duration (h), (b) precipitation accumulation over the event (mm), (c) antecedent precipitation (mm), (d) maximum/(e) mean/(f) standard deviation of the precipitation intensity (mm h−1) over the course of the event are shown. (a)–(f) Specify the values for the median and the 95th percentile of the distributions, respectively.
Download figure:
Standard image High-resolution image3. Results and discussion
The comparison between all precipitation events at each of the 4329 claim locations with the precipitation triggering damage-relevant SWFs showed that the latter differ significantly (p ≪ 0.001) from the overall precipitation events. In terms of the density distribution of absolute numbers (figure 4), this comparison showed that precipitation events that trigger damage-relevant SWFs have shorter median durations than all precipitation events. However, events lasting longer than 50 h have higher densities of triggering events (the 95th percentile is 64 h for all events and 81 h for damage-relevant events). Triggering events have significantly higher event precipitation accumulation (with a median value more than twice as large). The same is true for the maximum and mean rainfall intensity. The antecedent precipitation is significantly higher for triggering events. In terms of relative numbers, i.e. when comparing the quantiles, that SWF-triggering events are associated with the highest quantiles of the event precipitation sum along with mean and maximum rainfall intensity. Density distributions of the other event characteristics show statistically significant differences (p ≪ 0.001) between all precipitation events and SWF-damage-relevant triggering events (figure 5). The monthly occurrence of SWF-triggering events has maximums in June, July, and August.
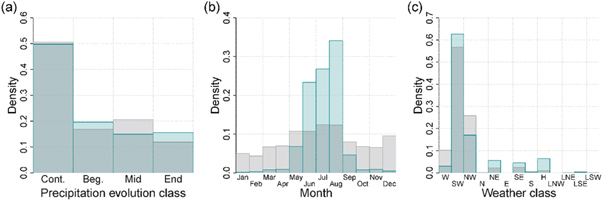
Figure 5. Density distributions of all precipitation events (gray) versus only the damage-relevant SWF-triggering precipitation events (light blue). The following are shown: (a) precipitation evolution class (Cont. = continuous, Beg./Mid./End = intensity peak at beginning/center/end of event, (b) month, and (c) weather class at the beginning of the event over the Alpine area (W = westerly, SW = southwesterly, NW = northwesterly, N = northerly, NE = northeasterly, E = easterly, SE = southeasterly, S = southerly, H = high pressure, LNW = low pressure at northwest, LNE = low pressure north east, LSE = low pressure south east, and LSW = low pressure southwest).
Download figure:
Standard image High-resolution imageThe analyses of the precipitation characteristics lead to the development of a threshold model for classifying precipitation events as damage-relevant SWF-triggering events or not (equation (6)). The most important factors are local quantiles of precipitation intensity and precipitation sum. Neither of the two factors is a sufficient predictor for damage-relevant SWFs, because both short and intensive as well as long precipitation events with a high total sum are frequently causing SWF damages. This is illustrated in figure 6.

where qimax is the local quantile of the precipitation intensity and qptot is the local quantile of the precipitation total of the triggering event at each damage location x. According to the calculated metrics, optimized threshold values are the 90% quantile for the precipitation intensity and the 98% quantile for the precipitation sum. These thresholds lead to a hit rate of 0.998, a false alarm rate of 0.005 and a SEDI index of 0.92. We tested the sensitivity and the robustness of the threshold model by varying the minimum number of claims per grid cell. This sensitivity analysis showed that the model is sensitive to an increase of the minimum number of claims per grid cell from 1 to 2, but not remarkably sensitive to a further increase (figure 6). The full results of this sensitivity analyses are shown in appendices A1 and A2. The relative thresholds model provides similar results over whole Switzerland with its high variability of landscapes and terrain characteristics. While the absolute values of precipitation maxima are highly variable in space [39], we could show that thresholds based on local relative quantiles are representative over large areas including mountainous and flat terrain. This is interesting because the frequency of SWF damage claims is also remarkably varying over Switzerland. Bernet et al [3] showed that SWFs are more frequent in the Jura mountains and the Western Plateau than in the Alpine areas and identified a few hot spot areas in Switzerland in terms of claim numbers. The presented approach covers these hot spots as well as cold spots. However, the question remains open whether the model can be transferred to high mountain areas that are not covered with settlement and, thus, are not considered in the analyses because of missing data (black colored areas in figure 2). The purpose of this model was to obtain meaningful threshold values, purely derived from the precipitation characteristics, in order to test the prediction of damage-relevant SWF events. Within the scope of this study, we constrained the analyses to the damage locations. In this way, we ensured that the analyzed locations encompassed at least some buildings that were susceptible to SWF damage. The reason why no SWF damages were observed in all the other cells are manifold: for instance, there may simply be no buildings within a cell, the exposed properties may be well protected against flooding, the local topography may route the overland flow past vulnerable objects, or the location is not completely covered by the data.

Figure 6. Sensitivity of the relative threshold model to the number of claims per grid cell.
Download figure:
Standard image High-resolution image4. Conclusions
The spatiotemporal overlay of 9 years of the hourly 1 km by 1 km CombiPrecip precipitation dataset with high-resolution damage data from insurance companies allowed characterizing precipitation events leading to damaging SWFs. We used a representative set of 15 803 SWF damage claims at 4329 different damage locations. The analysis of damage-relevant and non-relevant precipitation events confirmed that precipitation intensity and sum, event duration, antecedent precipitation, and month of occurrence significantly differ for damage-relevant SWF events in comparison to events with no damage. The seasonal occurrence is mostly concentrated on summer months [5, 27]. Local antecedent conditions do not play a major role for triggering SWFs in the case of particularly short and intense rainfall or very long rainfall with a high precipitation sum. The relevance of the maximum intensity and the precipitation is in agreement with those of previous studies [50, 51].
We developed a parsimonious model for mapping the areas with probable SWFs on the basis of spatio-temporal rainfall data based on two parameters: rainfall intensity and sum. It uses a relative threshold approach based on local quantiles. In contrast to absolute threshold values, this method is applicable to large areas over complex terrain, including high mountains and lowland areas and a variety of environmental conditions as described in [2, 3, 39]. A simple relative threshold model based on these two parameters is able to classify rainfall events in relation to the occurrence of a damage-relevant SWF event. The transfer of these parameters from grid cells with observed damages to those without damage observation has to be evaluated in future studies.
Our approach is an important step towards the development of impact-based early warning systems. Weather warning agencies or insurance companies can build upon these findings to develop workarounds for issuing user-targeted warnings [52] at the national scale or for nowcasting purposes (e.g. mobilizing personnel for evaluating incoming claim reports). The main barrier of this approach is the availability of insurance data. These data are mostly restricted due to data privacy legislation, reputational issues, business secrets, loyalty to customers, or issues of competition for market share [29]. By presenting the benefits of these data, we want to contribute to the discussion on opening damage data archives for research or for establishing national damage databases. Further studies should consider other explaining meteorological variables than just the two factors implemented in the model, e.g. antecedent precipitation, seasonal occurrence, and weather class. Moreover, additional explaining variables have to be considered in future studies as well, e.g. damage variables including the characteristics of the buildings affected by SWFs such as physical vulnerability, geographic variables including the characteristics of the sewer system, terrain parameters around the buildings, and possibly also demographic variables [29]. These variables are even more relevant when not only the occurrence of damage-relevant SWFs are predicted, but also the actual amount of loss. The thresholds used in the presented model for predicting the occurrence of SWFs are valid for the period 2005–2013. They are expected to change with global warming and the analyses have to be repeated periodically for updating the thresholds. In principle, the thresholds could also be used for analyzing potential effects of climate change on the occurrence of SWFs by using very high resolution regional climate models with explicit convection resolving that are able to simulate the precipitation events of relevance [53].
Acknowledgments
We thank the Swiss Mobiliar Insurance Company for providing claim records. Furthermore, we would like to thank the public building insurance companies of the cantons Aargau, Basel-Landschaft, Basel-Stadt, Fribourg, Glarus, Grisons, Jura, Lucerne, Neuchatel, Nidwalden, St Gall, Solothurn, Vaud and Zug for providing claim records and supporting us during the data harmonization process. We also thank the Federal Office for Meteorology MeteoSwiss for the provision of meteorological data. Finally, we would like to thank two anonymous reviewers for their helpful feedbacks.
Data availability:
The data on which this study is based were provided by 15 different insurance companies. Each record contains confidential information such as the location (address and/or coordinates), claim date, associated loss, and more. Due to privacy protections, the data are subjected to strict confidentiality, and thus, cannot be made accessible.
Appendix:

Figure A1. Minimal number of claims per grid cell vs SEDI.
Download figure:
Standard image High-resolution image
Figure A2. Sensitivity of the thresholds of the quantiles of precipitation intensity and sum against the variation of minimum number of claims per grid cell.
Download figure:
Standard image High-resolution image