

Abstract
Peatland ecosystems are important carbon sinks, but also release carbon back to the atmosphere as carbon dioxide and methane. Peatlands therefore play an essential role in the global carbon cycle. However, the response of high-latitude peatlands to ongoing climate change is still not fully understood. In this study, we used plant macrofossils and peat property analyses as proxies to document changes in vegetation and peat and carbon accumulation after the Little Ice Age. Results from 12 peat monoliths collected in high-boreal and low-subarctic regions in northwestern Québec, Canada, suggest high carbon accumulation rates for the recent past (post AD 1970s). Successional changes in plant assemblages were asynchronous within the cores in the southernmost region, but more consistent in the northern region. Average apparent recent carbon accumulation rates varied between 50.7 and 149.1 g C m−2 yr−1 with the northernmost study region showing higher values. The variation in vegetation records and peat properties found within samples taken from the same sites and amongst cores taken from different regions highlights the need to investigate multiple records from each peatland, but also from different peatlands within one region.
Export citation and abstract BibTeX RIS

Original content from this work may be used under the terms of the Creative Commons Attribution 3.0 licence. Any further distribution of this work must maintain attribution to the author(s) and the title of the work, journal citation and DOI.
Introduction
Future changes in climate can be expected to influence peatland vegetation and related carbon dynamics, especially in the high-latitudes where warming is most pronounced, almost twice the global average (IPCC 2013). Permafrost peatlands are especially sensitive to climate change, namely changes in temperatures and moisture balance (precipitation minus evaporation) which determine vegetation and carbon cycling processes (Ovenden 1990, Carroll and Crill 1997, Davidson and Janssens 2006, Swindles et al 2015, Gałka et al 2017, 2018). Despite covering only ca. 5% of Earth's landmass (Yu et al 2010), peatlands form a major terrestrial carbon sink (Gorham 1991, Yu et al 2009, 2010) and are connected to the global carbon cycle and its associated carbon-climate feedbacks (Frolking and Roulet 2007, McGuire et al 2009, Yu 2011). However, there are still large uncertainties about future climate-induced changes in peatland dynamics driven by changes in vegetation assemblages and moisture conditions (McGuire et al 2018).
Due to climate warming, net primary productivity (NPP) will likely increase because of longer growing seasons (Gallego-Sala et al 2018). This could accelerate peat accumulation, an effect that may be partly, or even wholly, mitigated by an increase in peat decomposition (Ise et al 2008, Dorrepaal et al 2009, Crowther et al 2016). Yu et al (2009) and Charman et al (2013) have shown that during past warm periods increases in NPP exceeded increases in peat decomposition, leading to higher rates of peat accumulation. The overall predicted 30% increase in precipitation (Collins et al 2013) may also enhance peat accumulation if not reversed by increase in evapotranspiration (Yu et al 2009).
In the James Bay and Hudson Bay Lowlands, peatlands cover vast areas and have stored ca. 30 Pg carbon since their initiation during the mid-Holocene (Packalen et al 2014). Many previous studies have investigated Holocene carbon dynamics in eastern Canada (e.g. Charman et al 1994, van Bellen et al 2011a, 2011b, Garneau et al 2014, Packalen and Finkelstein 2014, Magnan and Garneau 2014a, 2014b, Charman et al 2015) showing high regional variability in both apparent rates of carbon accumulation and in the timing of shifts in carbon accumulation throughout the Holocene. Studies focusing on more recent carbon dynamics and response to ongoing rapid climate change in northwestern Québec are sparse (see, however, Ali et al 2008, Beaulieu-Audy et al 2009, Loisel and Garneau 2010, Lamarre et al 2012).
To address the knowledge gap on the developmental and carbon dynamics of high-latitude peatlands after the Little Ice Age (LIA) (anno Domini (AD) 1450–1850 (Naulier et al 2015, Wilson et al 2016)), we examined several peat sections collected from two ecoregions (high-boreal and low-subarctic), in northwestern Québec. Climate started to warm after the LIA and since the 1970s human-induced warming has been more prominent (PAGES 2k Consortium 2013, Abram et al 2016). Increased snowfall since the 1950s and warm temperatures in the 1990s triggered rapid permafrost melting on the eastern coast of Hudson Bay (Payette et al 2004). Hence, permafrost is predicted to disappear from subarctic Québec in the coming decades (Payette et al 2004, Jean and Payette 2014), likely altering the vegetation and thus peatland carbon dynamics of the region (Swindles et al 2015).
This study investigates the response of northern peatland vegetation and carbon accumulation dynamics to recent warming in northwestern Québec. Plant macrofossil analysis was used as a primary proxy to reconstruct past habitat changes (see Väliranta et al 2007, 2017). 14C and 210Pb chronologies in combination with peat property analyses enabled the reconstruction of peat and carbon accumulation. Replicate records from each peatland and from proximal locations inside the study regions allowed us to estimate if detected changes were climate-induced or driven by internal dynamics (Swindles et al 2012, Mathijssen et al 2016, 2017, Magnan et al 2018). Specifically we evaluated: (1) if plant assemblages are changing synchronously in response to rapid recent warming, (2) if warmer climate has increased peat plant NPP and thus carbon accumulation rates, especially in the southern range of the study region, and (3) if multiple cores provide better assessment of within and between site variability.
Methods
Study sites
We selected two regions in northwestern Québec: one within the sporadic and the other within the discontinuous permafrost zone (Allard and K-Seguin 1987, Thibault and Payette 2009). Kuujjuarapik (K1P and K2) represents the subarctic, forested tundra ecoregion at the southernmost limit of the discontinuous permafrost zone (figure 1). Palsa mounds are characteristic at K1P peatland, whereas K2 is a small fen with peat thickness of 1–2 m. Radisson (LG2 and Rad) represents the northernmost boreal ecoregion (figure 1). These two peatlands, in region of sporadic permafrost, are ombrotrophic with peat thickness of 3−4 m (Thibault and Payette 2009).

Figure 1. Study site locations marked with dots (Kuujjuarapik and Radisson). Pictures from the coring sites, (a): K1P, (b): K2, (c): Rad, and (d): LG2. Basemap: Esri, HERE, Garmin © OpenStreetMap contributors. CC BY-SA.
Download figure:
Standard image High-resolution imageIn the two study regions, mean annual temperatures are below 0 °C (table 1). Mean annual temperatures have increased in both regions (table 1). In Kuujjuarapik mean summer temperature has increased 1.0 °C since 1961, while mean winter temperature has increased 0.5 °C since 1971 (Environment Canada 2018). In Radisson, since 1971, the biggest seasonal increase of 0.5 °C is in mean autumn temperatures. In Kuujjuarapik, the increase in growing degree-days (GDD0) (between 1971–2000 and 1981–2010) is ca. 6% and in Radisson ca. 4% (table 1). In both regions, autumn rainfall especially has increased. 35%–40% of the precipitation falls as snow.
Table 1. Study site information. Meteorological data for 30 year (1981–2010) measuring period: mean annual temperature (MAT), mean annual precipitation (MAP), and growing degree-days above zero (GDD0), measured from stations; La Grande Riviere A in Radisson and Kuujjuarapik station A (Environment Canada 2018). Increases in MAT, MAP, and GDD0 since 1961 and/or 1971 until present. Meters above sea level (MASL). Dominant vegetation around the coring points listed.
| Location | MAT (°C) | MAP (mm) | GDD0 | Core name | Latitude (N) | Longitude (W) | MASL (m) | Dominant vegetation |
|---|---|---|---|---|---|---|---|---|
| Kuujjuarapik | K1P1 | 55 °13'35.8'' | 77 °41'41.2'' | 100 | Sphagnum fuscum, S. | |||
| 1981–2010 | −4.0 | 661 | 1384 | K1P2 | 55 °13'34.9'' | 77 °41'47.8'' | capillifolium, Cladonia spp., | |
| Increase since | K1P3 | 55 °13'34.0'' | 77 °41'54.7'' | Chamaedaphne calyculata, | ||||
| 1961until present | 0.5 | 46 | K2.1 | 55 °13'38.6'' | 77 °42'18.4'' | 115 | Kalmia polifolia, | |
| 1971 until present | 0.4 | 12 | 74 | K2.2 | 55 °13'38.2'' | 77 °42'19.5'' | Rhododendron groenlandicum | |
| K2.3 | 55 °13'38.2'' | 77 °42'20.6'' | Andromeda polifolia, Vaccinium | |||||
| Radisson | LG2.1 | 53 °39'09.4'' | 77 °44'00.2'' | 175 | uliginosum, V. oxycoccos, | |||
| 1981–2010 | −2.9 | 697 | 1684 | LG2.2 | 53 °39'08.6'' | 77 °43'56.2'' | Trichophorum cespitosum, | |
| Increase since | LG2.3 | 53 °39'04.1'' | 77 °43'50.3'' | Carex spp., Rubus | ||||
| 1971 until present | 0.2 | 13 | 62 | Rad1 | 53 °39'38.6'' | 77 °44'51.9'' | 170 | chamaemorus, Drosera |
| Rad2 | 53 °39'42.0'' | 77 °44'52.9'' | rotundifolia | |||||
| Rad3 | 53 °39'45.1'' | 77 °44'52.7'' |
In the James Bay lowlands, peatlands cover ca. 20%–30% of the land area (Arseneault and Sirois 2004). In Radisson, peat started to accumulate following post glacial land uplift after 8000 calibrated (cal.) yr. before present (BP) (Dyke and Prest 1987, Beaulieu-Audy et al 2009). Radisson study sites are characterised by hummock-hollow microforms with e.g. Sphagnum lindbergii and Warnstorfia exannulata group abundantly present in low lawns and hollows and S. fuscum on hummocks while Picea mariana is sparsely present (table 1). Along the Hudson Bay lowlands, at the K1P, peat started to accumulate over marine sediments around 5950–5100 cal. BP and palsa formation is connected to the LIA cooling (Arlen-Pouliot and Bhiry 2005; Lamarre et al 2012). Ombrotrophic habitat conditions prevail in the central palsa mound part and hummock vegetation in K1P and K2 is largely similar to Radisson peatlands (table 1) but supplemented by e.g. Polytrichum strictum, and Sphagnum russowii. Sedges dominate the fen habitats together with Myrica gale, Menyanthes trifoliata, Eriophorum russeolum, S. papillosum, S. riparium, and brown mosses such as Scorpidium scorpioides. Larix laricina is occasionally present.
Sampling
In early July 2017, twelve peat monoliths: three from each four peatlands, K1P, K2, LG2, and Rad, were collected (table 1, figure 1). The core-lengths varied between 32 and 39 cm (table 2). Peat sections (10 cm in diameter) were sampled by hand sawing the layer overlying seasonal frost or permafrost from intermediate lawn microforms (water tables from 13 to 23 cm) inhabited mainly by Sphagnum fuscum. Such microhabitats are considered the most sensitive to reflect climate-induced changes in hydrology and consequent plant community shifts (e.g. Väliranta et al 2007, Frolking et al 2014). The cores were collected from relatively central parts of the peatlands, some tens of meters apart from each other. Peat monoliths were wrapped in plastic film and aluminium foil, transported and frozen at the University of Helsinki, Finland. For the analyses, monoliths were cut into 1 cm slices. To avoid contamination the outmost ca. two centimetres of peat was removed. The subsamples were stored in a cold room at 6 °C in plastic bags.
Table 2. Core length (cm) represents the thickness of the unfrozen peat layer at the time of the sampling. Water table depth (WTD). Average peat accumulation rates (peat accu.) mm yr−1. Average recent apparent carbon accumulation rates (RERCA) (g C m−2 yr−1) were calculated for periods AD 1850, AD 1900, and AD 1950 until present. NA: not available indicates that the chronology does not reach that far back in time. Basal ages from the core bottoms (cal. BP) are rounded to nearest five.
| Core length | WTD | Peat accu. | Basal age of the core | RERCA | RERCA | RERCA | |
|---|---|---|---|---|---|---|---|
| Core | (cm) | (cm) | (mm yr−1) | Cal. BP | AD1950 | AD1900 | AD1850 |
| K1P1 | 39 | 13 | 1.7 | 340 | 70.1 | 60.1 | 53.0 |
| K1P2 | 35 | 18 | 1.6 | 2530 | 91.7 | 82.6 | 74.3 |
| K1P3 | 31 | 18 | 3.2 | 185 | 121.0 | 108.4 | 101.8 |
| K2.1 | 32 | 27 | 3.5 | 140 | 102.1 | 89.3 | 83.3 |
| K2.2 | 31 | 22 | 4.9 | 50 | 149.1 | 140.6 | NA |
| K2.3 | 33 | 20 | 5.4 | −10 | 147.9 | NA | NA |
| LG2.1 | 34 | 20 | 2.3 | 115 | 65.3 | 64.6 | 63.1 |
| LG2.2 | 33 | 21 | 5.4 | −10 | 136.9 | NA | NA |
| LG2.3 | 34 | 18 | 3.2 | 120 | 91.9 | 77.7 | 71.1 |
| Rad1 | 38 | 23 | 3.2 | 120 | 103.3 | 95.7 | 89.6 |
| Rad2 | 37 | 14 | 2.9 | 190 | 100.0 | 89.4 | 81.9 |
| Rad3 | 36 | 19 | 1.7 | 180 | 50.7 | 51.0 | 54.1 |
Plant macrofossil analysis
Plant macrofossil analysis was performed at 2 cm resolution. Where prominent changes in plant composition occurred, the resolution was increased to contiguous centimetres. Volumetric samples of 5 cm3 were carefully rinsed under running water using a 140 μm sieve. From the residue, proportions of the main peat components (such as Sphagnum, non-Sphagnum mosses, Cyperaceae remains, wood, roots, and leaves) were estimated as percentages of a total sample volume under a stereomicroscope and a high-power light microscope. Seeds, leaves and charred remains were counted as exact numbers. Plant macrofossil analysis followed Mauquoy and van Geel (2007), modified by Väliranta et al (2007). If plant remains were unidentifiable to plant type level, proportion of unidentified organic matter (UOM) was estimated. Identification followed e.g. Laine et al (2009), Mauquoy and van Geel (2007), and Eurola et al (1992). A reference collection was also available. Software C2 (v. 1.7.7) (Juggins 2007) and Tilia 2.0.41 were used to produce the diagrams.
Chronology
Radiocarbon (14C) accelerator mass spectrometry (AMS) and lead (210Pb) dating methods were combined to establish accurate chronologies and build age-depth models (van Der Plicht 2004, Ali et al 2008). In total 16 samples were sent to Poznan Radiocarbon Laboratory (Poznan, Poland) and three samples to the Finnish Museum of Natural History (LUOMUS, Helsinki, Finland) for 14C dating (table S1 is available online at stacks.iop.org/ERL/14/075002/mmedia). Bulk peat samples, cleaned of roots and rootlets when possible (Holmquist et al 2016), were used for 14C dating. Samples from the base of each peat monolith, layers representing vegetation changes and/or intermediate layers (LG2.2 and K2.3) were selected for dating.
To create accurate chronologies for recent decades, 210Pb dating was performed at the University of Exeter, UK, using alpha-spectrometry. 210Pb was measured at 2 cm intervals for each full-length monolith. Freeze-dried subsamples of 0.14−0.51 g were analysed for 210Pb activity after spiking them with a 209Po yield tracer, following the methods described by Kelly et al (2017) and Estop-Aragonés et al (2018). 210Pb ages were obtained using the Constant Rate of Supply model (CRS) (Appleby and Oldfield 1978). Age-depth models for each core (figure 2) were created with BACON v2.3.3 package in R version 3.4.3 (R Development Core Team 2016). BACON divides the dated cores into sections and applies Bayesian statistics with prior information to reconstruct the accumulation, providing weighted mean ages (Blaauw 2010, Blaauw and Christen 2011) that are further used for calculations without chronological error ranges. 14C ages were internally calibrated using the INTCAL 13 calibration curve (Reimer 2013) and modern dates (pMC % modern carbon) were converted to radiocarbon ages applying NH Zone 1 post bomb curve (Hua et al 2013).
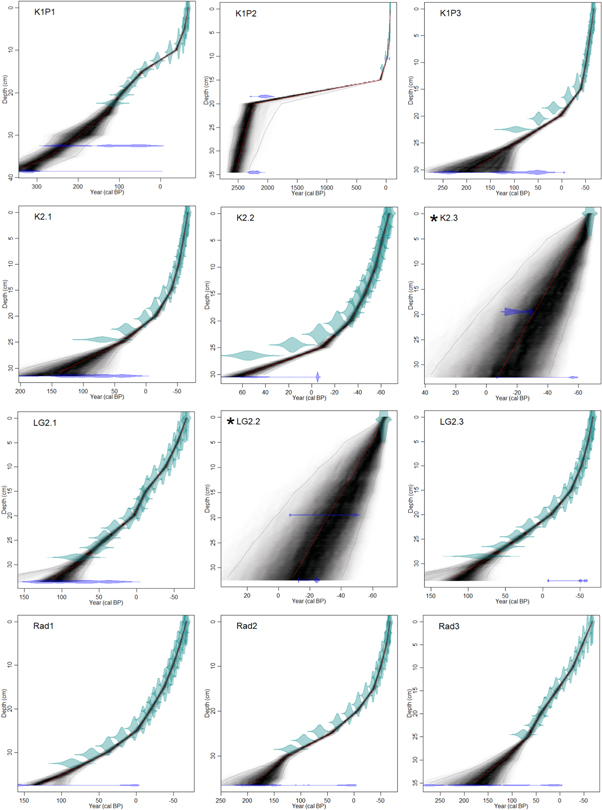
Figure 2. BACON age-depth models. 210Pb age-ranges are in green (for *LG2.2 and *K2.3 green indicates the coring year), and 14C dates (cal. BP) are in blue. The grey shading indicates the possible age-range and darkest grey demarks most likely range. The thin red line in the middle is the weighted mean age based on the model.
Download figure:
Standard image High-resolution imageCarbon accumulation rates ACAR and RERCA values
For peat and carbon accumulation calculations, dry bulk density (g cm−3) was measured contiguously for every cm after freeze-drying volumetric subsamples of 5 cm3 and by dividing the dry mass (g) by the peat fresh volume (cm3). Carbon and nitrogen (C/N) content measurements were performed at 4 cm intervals, at the University of Helsinki, using a LECO TruSpec micro Elemental Determinator and these results were applied to calculate average carbon values.
To estimate the temporal variations in apparent carbon accumulation rates (ACAR, g C m−2 yr−1), the carbon mass of every 1 cm increment (g m−3) was multiplied by the corresponding vertical peat accumulation rate (m yr−1) (Turunen et al 2002) based on the age-depth models. Average, non-cumulative, apparent recent rates of carbon accumulation (RERCA) (see Turunen 2003) were calculated for three periods; post AD 1950 until present, post AD 1900 until present, and post AD 1850 until present, following a procedure introduced in Lamarre et al (2012). These periods mainly represent incompletely decomposed (acrotelm) peat and are not straight forwardly comparable with results yielded from older highly decomposed, water saturated, and anoxic (catotelm) peat.
Results
Chronology and peat accumulation
Age-depth models show that peat accumulation has not been constant over the accumulation history and ages at the base of the monoliths vary from ca. 2500 cal. BP (K1P2) to ca. cal. AD 1960 (K2.3 and LG2.2) (figure 2). However, in this study, we focus on the period of the last ca. 200 years. Mean peat accumulation rates range from 1.6 to 5.4 mm yr−1 (table 2). On average, accumulation rates increase towards the present, starting from the 1950s (figures 3–6). Within both regions, peatland specific variation in accumulation rates exists (table 2). The K1P2 age-depth model suggests a slowdown in peat accumulation between ca. 1800 cal. BP and 95 cal. BP (19–15 cm) when the peat accumulation rate is only 0.02 mm yr−1. Alternatively either of the 14C ages is an outlier. 210Pb activity ceases already at 13 cm below the surface in K1P2 (figure 2). For cores K2.3 and LG2.2 (both 33 cm in length), the 210Pb analyses did not reach the zero activity level (table S2). In order to establish age-depth models for these two cores, we 14C-dated additional peat samples (table S1 and figure 2). Additionally, the 14C basal-age of the record LG2.3 was younger than the corresponding age suggested by the 210Pb chronology (table S2) and the BACON age-depth model therefore excluded the 14C age as an outlier (figure 2). A charcoal layer with charred plant remains in LG2.2 was dated to ca. cal. AD 1940 (21 cm) which corresponds to a previously reported fire in AD 1941 (SOPFEU 2004) and supports the reliability of the chronology (figures 2 and 5).

Figure 3. Plant composition presented as main vegetation types with different colours (%). Y-axis indicates the AD year from 1800 until the coring year 2017. Symbol // is used to indicate that the record continues to older ages. Continuous line represents K1P1 record, dashed line K1P2, and dotted line K1P3. On the top x-axis g C m−2 yr−1 stands for ACAR, mm yr−1 for peat accumulation and BD (g cm−3) for bulk density. RW zone (recent warming) and LIA zone (Little Ice Age) are shown with grey horizontal lines.
Download figure:
Standard image High-resolution image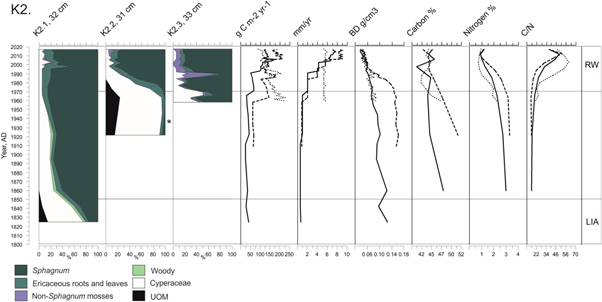
Figure 4. Plant composition presented as main vegetation types with different colours (%). Y-axis indicates the AD year from 1800 until the coring year 2017. Symbol * indicates where charcoal and/or charred plants were found. Continuous line represents K2.1 record, dashed line K2.2, and dotted line K2.3. On the top x-axis g C m−2 yr−1 stands for ACAR, mm yr−1 for peat accumulation and BD (g cm−3) for bulk density. RW zone (recent warming) and LIA zone (Little Ice Age) are shown with grey horizontal lines.
Download figure:
Standard image High-resolution image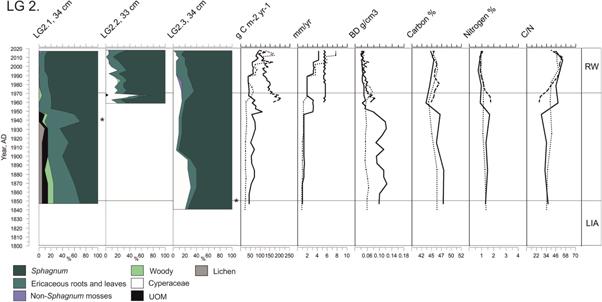
Figure 5. Plant composition presented as main vegetation types with different colours (%). Y-axis indicates the AD year from 1800 until the coring year 2017. Symbol * indicates where charcoal and/or charred plants were found. Continuous line represents LG2.1 record, dashed line LG2.2, and dotted line LG2.3. On the top x-axis g C m−2 yr−1 stands for ACAR, mm/yr for peat accumulation and BD (g cm−3) for bulk density. RW zone (recent warming) and LIA zone (Little Ice Age) are shown with grey horizontal lines.
Download figure:
Standard image High-resolution image
Figure 6. Plant composition presented as main vegetation types with different colours (%). Y-axis indicates the AD year from 1800 until the coring year 2017. Symbol // is used to indicate that the record continues to older ages, and symbol * indicates where charcoal and/or charred plants were found. Continuous line represents Rad1 record, dashed line Rad2, and dotted line Rad3. On the top x-axis g C m−2 yr−1 stands for ACAR, mm yr−1 for peat accumulation and BD (g cm−3) for bulk density. RW zone (recent warming) and LIA zone (Little Ice Age) are shown with grey horizontal lines.
Download figure:
Standard image High-resolution imagePeat properties
The average core-specific bulk density (BD) with standard deviation (±SD) varies between 0.05 ± 0.01 g cm−3 (LG2.3) and 0.11 ± 0.04 g cm−3 (K1P2) with an increasing trend towards older peat layers (figures 3–6). The mean BD of all the cores was 0.07 ± 0.03 g cm−3. Carbon content analysis yielded an average of 45.5% ± 1.7%. Carbon averages calculated over an individual peat core ranged from 43.9% ± 1.4% (K2.3) to 47.1% ± 2.7% (K1P2). C/N ratio varied between 14.3 and 62.8 with an average of 36.4 ± 11.9. The overall trend in C/N values increased towards the surface (figures 3–6).
Past vegetation succession
Kuujjuarapik (K1P)
At first, until ca. cal. AD 1710 (33 cm), S. fuscum dominates in K1P1, after which the dry assemblage is replaced by wet S. lindbergii and Cyperaceae (figure S1). Between ca. cal. AD 1960 and cal. AD 2000, at 13–7 cm, the K1P1 record shows a change from a wet assemblage back to a drier assemblage with Dicranum sp. and dwarf shrubs. From ca. cal. AD 1990 (9 cm), a S. fuscum-ericaceous assemblage dominates.
K1P2 is first dominated by S. fuscum with numerous Picea sp. needles (33–19 cm), woody material and sparse charred fragments (33–12 cm). Cyperaceous taxa are most abundant between 20 and 11 cm up to ca. cal. AD 1950. Wet Sphagnum sect. Cuspidata was identified at 13–11 cm. Shrub roots replace the Sphagnum dominance between ca. cal. AD 1950 and 1995 (11–7 cm). S. fuscum dominates the vegetation from ca. cal. AD 1995 (7–0 cm) to present.
In K1P3, Cyperaceae and Sphagnum assemblages alternate. First (from 31 cm, ca. cal. AD 1765), Cyperaceae spp. dominate until ca. cal. AD 1780 (30–29 cm) when the assemblage shifts to S. lindbergii. Non-Sphagnum bryophytes e.g. Straminergon stramineum and Exannulata group species are present through these phases. After ca. cal. AD 1930 (21 cm) S. lindbergii is first accompanied by, and then in ca. cal. AD 1970 replaced with Cyperaceae species. Trichophorum cespitosum prevails with dwarf shrubs between ca. cal. AD 1970 and ca. cal. AD 1990 (17–15 cm). After ca. cal. AD 1990 (14 cm), S. russowii re-establishes the Sphagnum assemblage with small quantities of Trichophorum cespitosum and ericaceous plants.
Kuujjuarapik (K2)
Cyperaceae spp. dominate the K2.1 record from ca. cal. AD 1825 until ca. cal. AD 1845 (29 cm), when the plant assemblage changes to Sphagnum fuscum dominance (figure 4). At ca. cal. AD 1995 (13 cm), slightly more Cyperaceae remains, dwarf shrub roots, and Ericaceae leaves (mainly Chamaedaphne calyculata) occur.
In K2.2, macroscopic charcoal is detected between ca. cal. AD 1900 (31 cm) and ca. cal. AD 1935 (27 cm). Cyperaceae spp. are present until ca. cal. AD 1980 (21 cm) but are replaced by S. fuscum via S. sect. subsecunda and ericaceous roots. S. fuscum dominates the plant assemblages until the present-day together with Trichophorum cespitosum and Ericaceae (figures 4, S1).
In K2.3, the assemblages of cyperaceous plants and S. fuscum vary between ca. cal. AD 1960 and 1990 (33–16 cm) (figures 4, S1). Chamaedaphne calyculata seeds are numerous around cal. AD 1980s (21–18 cm) and Mylia anomala is abundant (up to 40%) between ca. cal. AD 1985 and ca. cal. AD 1990 (18–16 cm). From ca. cal. AD 1990 to the present-day, S. fuscum dominates the plant assemblages. Dwarf shrub roots, Trichophorum cespitosum, and Polytrichum strictum occur throughout the record in low quantities.
Radisson (LG2)
The LG2.1 vegetation assemblage is predominantly composed of Sphagnum capillifolium together with ligneous plants and some lichens from ca cal. AD 1850 until ca. cal. AD 1945 (20 cm) (figures 5, S1). A layer with charred plant remains occurred ca. cal. AD 1940 (21 cm). After the fire to the present-day, Sphagnum fuscum dominates the plant assemblage occasionally accompanied by Mylia anomala.
No substantial changes are detected in the LG2.2 plant assemblages. At first, S. fuscum is occuring together with cf S. subfulvum. After ca. cal. AD 1965, cyperaceous remains become more abundant. S. fuscum becomes dominant again after ca. cal. AD 1970 (27 cm), together with some sparse cyperaceous taxa and dwarf shrub roots that prevail throughout the record (figures 5, S1).
In LG2.3, charcoal and charred plant fragments are identified at ca. cal. AD 1850 (31 cm). Until ca. cal. AD 1885 (28 cm), S. balticum prevails with S. fuscum, S. rubellum, and Trichophorum cespitosum. After ca. cal. AD 1885, S. balticum disappears and S. fuscum dominates the plant assemblages with S. rubellum, until present. Dwarf shrub roots and Mylia anomala are scarce throughout. Ericaceous leaves become more abundant after ca. cal. AD 1965 (19 cm) (figures 5, S1).
Radisson (Rad)
In Rad1 (from 38 cm, ca. cal. AD 1840), S. fuscum dominates the assemblage accompanied by S. rubellum and S. capillifolium. Dwarf shrub roots are abundant (up to 40%) and lichens are found from ca. cal. AD 1920 until ca. cal. AD 1960 (29–23 cm). Charcoal is found between cal. AD 1920s and 1950s (29–25 cm) (figures 6, S1). After the charcoal layers, S. balticum and Mylia anomala are found and ericaceous plants become more abundant. Towards present, the prevalence of roots declines and Sphagnum represents up to 80% of plant remains.
In Rad2 (37 cm: from ca. cal. AD 1770), S. fuscum dominates the plant assemblage throughout the record, with a reduction from 75%–90% to 50% after cal. AD 1970s (18–16 cm). Charcoal and charred plant fragments occur between late cal. AD 1960s and mid-1970s (21–17 cm). Some lichens are found underneath the charcoal layer until the cal. AD 1930s (23 cm) and at 16 cm which corresponds to the late cal. AD 1980s. Cyperaceous taxa are found in small abundance until ca. cal. AD 1990 (13 cm). In the plant assemblages following the charcoal layers, Mylia anomala appears with ericaceous shrubs up to the present-day surface.
From the base of Rad3 record (36 cm, ca. cal. AD 1780), until ca. cal. AD 1820 (32 cm), cf S. subfulvum is abundant together with Cyperaceae species. Charcoal and charred plant fragments are detected between ca. cal. AD 1820–1890 (32–24 cm). After ca. cal. AD 1820, Sphagnum remains diminish with an increase in dwarf shrub roots. Sphagnum sect. Cuspidata occurs until ca. cal. AD 1880 (25 cm), when replaced by S. fuscum and S. rubellum. Picea mariana needles are numerous around ca. cal. AD 1880s (25 cm). After the last charcoal layer (ca. cal. AD 1890), S. rubellum and S. fuscum accompanied by dwarf shrub roots dominate the record (figures 6, S1).
ACAR and RERCA variability
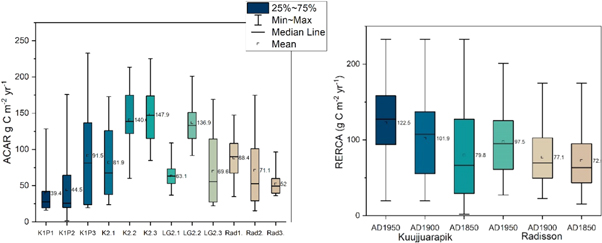
Because the ages at the base of the monoliths vary, the oldest dated to 2510 cal. BP (K1P2) and youngest to −10 cal. BP (cal. AD 1960, K2.3 and LG2.2), we focused on three defined RERCA periods: from AD 1850, from AD 1900, and from AD 1950 to the present-day (table 2). This approach enables us to identify and compare possible changes in recent carbon accumulation rates. In general, the post AD 1950 RERCA rates are the highest (table 2, figures 3–6), partly due to incomplete decomposition. At K2, RERCA values were consistently high (table 2). The lowest post AD 1950 RERCA rates were detected for the Radisson region peatlands: LG2.1: 65.3 g C m−2 yr−1 and Rad3: 50.7 g C m−2 yr−1. However, for these same peatlands, much higher rates were also derived: LG2.2: 136.9 g C m−2 yr−1 and Rad1: 103.3 g C m−2 yr−1.
ACAR variability is high (figure 7) and mainly varies with depth, with higher rates towards the peat surfaces (figures 3–6). RERCA ranges and exact values for the three focus periods are higher for Kuujjuarapik than for Radisson peatlands (e.g. AD 1950 RERCAs are 24% higher in Kuujjuarapik region than in Radisson) (figure 7). The site-combined averages for the three periods were consistently higher in Kuujjuarapik than in Radisson, but also the lowest apparent carbon accumulation rates were calculated for Kuujjuarapik (figure 7).
Figure 7. ACAR (g C m−2 yr−1) variability for each core (left panel) and combined RERCA (g C m−2 yr−1) variability for the two study regions, Kuujjuarapik and Radisson, focusing on three periods: from AD 1950, from AD 1900, and from AD 1850 to present (right panel). See legend in the left panel.
Download figure:
Standard image High-resolution image
Discussion
Variations in vegetation succession patterns between and within sites neither fully support nor reject our first research question that plant assemblages are changing synchronously in response to rapid recent warming. In contrast to our second research question, the northern Kuujjarapik peatlands had higher RERCA rates when compared to the more southern Radisson site but supporting the research question, carbon accumulation rates increased towards recent decades. This increase is, however, partly expected due to the incomplete state of decomposition even if the climate had not become warmer. Plant assemblages of K2, Rad, and LG2 peatlands revealed asynchronous response to post-LIA warming (figures 4–6). Moreover, all sampling sites indicated more recent decadal-scale changes; yet the exact timing varies (figures 3–6). In K1P peatland, the vegetation change was synchronous for all records starting from ca. cal. AD 1950s and lasting until mid-1990s resulting with an establishment of a drier Sphagnum lawn microform. In turn, at K2 peatland, the vegetation assemblages showed successional changes around cal. AD 1970s (K2.2), 1980s (K2.3), and 1990s (K2.1). However, K2 peatland has different permafrost dynamics and microtopography gradient from K1P palsa peatland. Vegetation community changes in Rad peatland and the LG2.1 record around cal. AD 1940s might have been fire-induced as suggested by the charred plant remains and charcoal in the peat records. Kuujjuarapik vegetation assemblages seem to have experienced more synchronous and distinct changes than the southern, Radisson assemblages. This could be linked to changes in thawing permafrost dynamics in the northern Kuujjuarapik site.
Peat properties and peat and carbon accumulation
Our BD values corresponded to previous studies from Northern Ontario where BD ranged from 0.0034 to 0.62 g cm−3 with an average of 0.093 ± 0.041 g cm−3 (Holmquist et al 2014). Our average carbon content was slightly lower than the 50% which is often used for peat carbon content calculations for boreal and subarctic to Arctic regions (Turunen et al 2002, Treat et al 2016), but close to an average reported for northern peatlands 46.8% ± 6.1% (Loisel et al 2014). Our C/N averages are comparable with other studies, but our lowest C/N values were lower than those reported by Treat et al (2016) (C/N 30–62).
Previous results from Kuujjuarapik have shown a notable rise of peat accumulation rates since the beginning of the 20th century, with average RERCAs: 133–147 g C m−2 yr−1 from cal. AD 1950 to present, 73–81 g C m−2 yr−1 from cal. AD 1900 to present, and 52–62 g C m−2 yr−1 from cal. AD 1850 to present (Lamarre et al 2012). The highest individual RERCA values of Lamarre et al (2012) exceeded 160 g C m−2 yr−1 and were interpreted to reflect the recent increase in annual temperatures.
High peat accumulation rates of 0.5 cm yr−1, with an average of 0.037 cm yr−1, and high RERCA values (form cal. AD 1850) between 52.8 and 114.5 g C m−2 yr−1 with a mean of 73.6 g C m−2 yr−1, have been reported for Eastmain, James Bay area south from Radisson (Loisel and Garneau 2010). Moreover, a mean carbon accumulation rate over the past ca. 300 years of 56.4 g C m−2 yr−1, has been obtained from the same region (van Bellen et al 2011b). Turunen et al (2004) reported a carbon accumulation rate of 73 g C m−2 yr−1 for eastern Canadian bogs, covering the last 150 years. High carbon accumulation rates of > 150 g C m−2 yr−1 over the past ca. 200 years in northeastern maritime Québec have been put forward by Magnan and Garneau (2014a). In contrast, Hudson Bay Lowland records from Northern Ontario indicated no rise in carbon accumulation rates for the recent decades, i.e. less than 30 g C m−2 yr- 1 (Bunbury et al 2012). There, the lead activity covered only the topmost 6 cm, while in the current study, where the core lengths were between 31 cm and 39 cm, the zero 210Pb activity level was sometimes not reached at all (K2.3 and LG2.2), which creates uncertainty for the chronologies. However, in K1P2, the lead activity covered only the topmost 13 cm, resembling the results of Bunbury et al (2012). These previous studies were conducted in peatlands resembling ours and samples were mainly collected from similar microhabitats. It has been suggested that peat and carbon accumulation rates are fast for Sphagnum-dominated habitats under high effective moisture conditions and slower when sedges dominate in warm and dry conditions (Nichols et al 2014). In the La Grande region, a rise in peat accumulation rates together with a recent change towards Sphagnum-dominated plant communities has been detected (Beaulieu-Audy et al 2009, Pratte et al 2017). In our study, however, we found no correlation between Sphagnum assemblages and carbon accumulation (Pearson correlation: r = 0.09, p = 0.21).
Drivers behind accumulation patterns
Intermediate peatland microforms, selected for this study, have higher vertical peat and carbon accumulation rates than, for instance, wet hollows or high and dry hummocks (Belyea and Clymo 2001). Sphagnum establishment promotes rapid peat accumulation and hence peatland vegetation community structure strongly influences carbon sequestration (Tuittila et al 2012, Loisel and Yu 2013). However, it is often a challenge to separate internal and site-specific and external, e.g. climate driven, forcing (Loisel and Garneau 2010, van Bellen et al 2011b, Tuittila et al 2007, 2012, Loisel and Yu 2013). Changes in hydrology and vegetation can also be caused by long-term hydroseral succession from fen to bog (ombrotrophication) that is driven by both internal and external forcing (Yu et al 2009, Väliranta et al 2017).
PAR0 and growing season length have been connected to Sphagnum productivity (NPP) (Loisel et al 2012, Gallego-Sala et al 2018). Accordingly, peat accumulation should be positively correlated to GDD0 (Clymo et al 1998, Charman et al 2013, Holmquist et al 2014). In addition, moisture is an important factor controlling carbon accumulation and peatland dynamics (Swindles et al 2015, Gałka et al 2017, Zhang et al 2018a). Both precipitation and GDD0 have increased since the 1960s and 1970s in our study sites (Environment Canada 2018). In the Hudson Bay region, sea ice cover has decreased up to 11.3% ± 2.6% per decade from AD 1971 to AD 2008, which is affecting moisture and heat transfer patterns of the area (Tivy et al 2011) and may also affect peat accumulation processes.
Our aim was to study recent peat and carbon accumulation patterns by collecting peat records from uniform lawn Sphagnum microforms. Because establishment of robust chronologies for young peat sections is challenging (see however e.g. Goslar et al 2005), in this study we combined two dating methods that support each other (e.g. Turetsky et al 2004). Our results indicated high accumulation rates during recent decades. Previous studies focussing on both the last millennium (Charman et al 2013, Garneau et al 2014, Loisel et al 2014) and recent decades (Zhang et al 2018b) showed that relatively high accumulation rates are likely caused by increased carbon inputs rather than by reduced decomposition. We acknowledge the difficulty of interpreting the recent peat accumulation rates due to the incomplete decomposition process and lower compaction of the surface peat and restraints on the chronologies. Despite these inaccuracies, by using specified focus periods, the data nevertheless allow spatio-temporal comparisons and the assessment of data against the previously published data carried out using similar protocols.
Future implications
Observed and anticipated warmer and wetter climate conditions for the coming decades (Kirtman et al 2013, Environment Canada 2018) should be beneficial for peat accumulation (Payette et al 2004). Following this, a potential increase of carbon storage has been suggested (Holmquist et al 2014, Gallego-Sala et al 2018). However, contrasting views also exist where modelling exercises suggest that in eastern Canada, peatlands will turn into a carbon source due to increased decomposition under warmer climate, despite the potential increase in carbon sequestration (Chaudhary et al 2017). McGuire et al (2018) modelled the vegetation response to climate warming and CO2 fertilization under different warming scenarios. They predicted that depending on the magnitude of warming, northern permafrost soils could act as a net sink of carbon, but if the warming is more prominent, substantial soil carbon losses could appear after 2100 (McGuire et al 2018). In some of the projections, vegetation was largely responsible for the carbon intake, but the other projections indicated that vegetation carbon intake could not compensate the losses (McGuire et al 2018). To address the question how high-latitude peatland vegetation and carbon dynamics will respond and have responded to recent warming, more data are needed including high-resolution chronologies and multiple cores, as presented in this study. The presented data highlight the importance of studying multiple peat sections from one study site and preferably the approach should be extended to regional-scales as stated by our third research question and the internal variability needs to be take into account when thinking about upscaling and modelling of results (Loisel and Garneau 2010, Lamarre et al 2012, Mathijssen et al 2017, Zhang et al 2018a).
Conclusions
This study analysed twelve shallow surface peat cores for plant macrofossils and carbon accumulation to reveal recent changes in habitat conditions and peat properties in northern peatlands of eastern Canada. Our results indicated more prominent changes in vegetation dynamics and carbon accumulation in the northernmost study sites than in the southern sites. These changes may be linked to larger increase in the growing season length, different climatic conditions, and changing permafrost dynamics of the northern region. High-resolution chronologies, by applying multiple complimentary dating methods, is essential to reveal the most recent changes. Our study shows that in order to exclude the influence of internal peatland variability on detected changes in accumulation patterns, multiple cores are needed to capture the genuine regional-scale climate signal.
Acknowledgments
We thank N Chaumont for fieldwork assistance, N Sanderson for helping with establishing the chronologies, and R Gauthier for rechecking one Sphagnum species. The Academy of Finland (code 296519) and Natural Sciences and Engineering Research Council of Canada (NSERC; No. 250287) discovery grant to MG funded this project. We thank the three anonymous reviewers for their constructive comments.