

Abstract
Imperfect information and inattention can lead consumers to undervalue the energy efficiency of products, contributing to growing environmental problems and climate change. To nudge individuals towards energy efficiency, environmental certification schemes, such as the European Union (EU) energy label, present grade-like efficiency classes. In a real-stakes randomized controlled trial, we contrast this approach with a control condition that gives no energy-related information and an alternative treatment condition that provides detailed information on the lifetime cost of energy-using durables. Our results show that the EU energy label does not increase demand for energy-efficient products over a control condition. By contrast, lifetime-cost information increases the willingness-to-pay for energy efficiency considerably.
Export citation and abstract BibTeX RIS

Original content from this work may be used under the terms of the Creative Commons Attribution 3.0 licence. Any further distribution of this work must maintain attribution to the author(s) and the title of the work, journal citation and DOI.
1. Introduction
Many appliances we use in daily life have two cost components: an upfront purchase cost that is very salient, but also a usage cost that accumulates over time and depends on the product's energy efficiency. Prominent examples are different types of light bulbs (e.g. compact fluorescent light (CFL) bulbs versus LED lights), refrigerators of different energy efficiency, or cars with different fuel efficiency. Imperfect information and limited attention can bias choices in favor of the immediately visible (e.g. Chetty et al 2009, Tiefenbeck et al 2018). This can cause individuals to overlook differences in usage cost (Allcott and Taubinsky 2015) and excessively focus on the upfront price. It can thus lead individuals to favor energy-inefficient products, even though it is not even in their own self interest, and compound problems of environmental pollution and climate change.
A popular policy response is to try to 'nudge' individuals to correct for this bias (Thaler and Sunstein 2008, Allcott and Mullainathan 2010, Benartzi et al 2017). For example, the European Union (EU) has introduced an energy label, which aims to foster purchase decisions of energy-efficient products. The EU label presents energy efficiency classes, a suggestive grade-like quality assessment that ranges from A++ to E and displays colors that change from green to red as efficiency classes get worse. Such energy labels based on efficiency classes are employed in many countries beyond the EU, including Brazil and China.
In this paper, we compare the effectiveness of the EU energy label to a control condition where individuals receive no information about a product's energy efficiency. In a second treatment condition, we inform individuals of the total lifetime cost from using the energy-consuming durables, i.e. the sum of purchase and operating cost. In our experiment, participants make actual purchase decisions and choose between an LED bulb or a less energy-efficient CFL bulb, the two main lighting technologies currently used in Germany. We vary the prices of both bulbs and infer participants' revealed willingness-to-pay (WTP) for the more energy-efficient LED bulb, relative to the CFL bulb.
Our study focuses on the light bulb market for two main reasons. First, improving the efficiency of lighting is considered one of the most cost-effective ways to reduce residential greenhouse gas emissions (e.g. McKinsey and Company 2009, Davis 2017). Recent technological breakthroughs have lead to the development of very efficient LED bulbs that need about 80%–90% less energy than comparable incandescent bulbs. Second, light bulbs are an electricity-using durable that most consumers buy regularly. Our study participants are thus familiar with the purchase decisions that we analyze in our experiment.
Despite the wide application of the EU energy label, causal evidence on how it influences real-stakes purchase decisions is missing. Previous studies have demonstrated the potential of information to overcome salience bias, without focusing on energy labels. For instance, Allcott and Taubinsky (2015) conduct an incentive-compatible field experiment and find that information on lifetime cost increases the WTP for CFL over incandescent light bulbs. In addition, Camilleri and Larrick (2014) find that consumers purchase energy-efficient cars more often when lifetime operating cost are displayed. Yet, whether the current EU energy label taps into this potential has remained unexplored. Further literature on energy efficiency has extensively investigated the role of determinants for energy-efficient investments and behaviors (e.g. Poortinga et al 2003 and Gillingham et al 2009 for an overview) and to what extend greater consumption offsets the energy saved by efficiency improvements, the so-called rebound effect (e.g. Greening et al 2000, Frondel and Vance 2013, Gillingham et al 2013).
With respect to energy labels, some studies have used hypothetical choice experiments to compare how different EU label elements affect consumer choices. Newell and Siikamäki (2014), for example, conclude that participants value energy efficiency by even more than its true discounted value when confronted with a modified EU label that additionally displays operating cost. Furthermore, Andor et al (2017) exploit discontinuities in the assignment of efficiency classes and find that more than two thirds of participants state a positive WTP for an appliance with a better efficiency class, even when energy uses are virtually the same. Other studies have analyzed real-stake decisions, but without employing an experimental research design that ensures a reliable identification of causal effects. For example, Kallbekken et al (2013) conduct an experiment with non-random treatment assignment in six stores in Norway and cannot detect a statistically significant effect of presenting operating cost information to consumers as long as the sales staff receives no supplementary training. Stadelmann and Schubert (2018) investigate purchase decisions of several appliances in an online store and present the EU label, a newly designed lifetime-cost label or none of them. Based on pre-post comparisons, they do not detect differences in the effectiveness of both labels, except for one appliance, where operating cost information is less effective than the current EU label to increase the uptake of energy-efficient appliances.6
We contribute to the literature by, first, directly testing the effectiveness of the current EU energy label against a control condition that does not provide any information about energy efficiency. Most of the studies so far have investigated how the energy label should be amended to become more effective, yet the effectiveness of the current EU label against a control condition without energy information has received little attention, despite its relevance for judging the suitability of that policy. Second, we conduct a randomized controlled trial with a clean empirical strategy to identify the causal effects of the EU energy label and, in addition, a second treatment condition that informs participants about the total lifetime cost of the product. Third, we analyze real-stakes purchase decisions and thus avoid possible biases from stated preference elicitation approaches (List and Gallet 2001, Harrison and Rutström 2008).
Our evidence shows that the current EU energy label fails to realize its potential. When we present the EU label, the WTP for the more energy-efficient LEDs remains the same as in the control condition, where no information was provided. By contrast, communicating the lifetime-cost information has a substantial positive effect on the WTP. These results suggest a revision of the current EU energy label by making lifetime energy cost more salient. On a more general note, they illustrate that information about lifetime cost is a core determinant of purchase decisions, in contrast to suggestive grade-like information, as shown on the EU energy label.
2. Experimental design and data
Our study population consists of 719 household heads that take part in a smart-meter study of a large German utility. As we show in appendix A, available online at stacks.iop.org/ERL/14/044001/mmedia, the socioeconomic characteristics of study participants closely match German averages in terms of age, gender, net income, employment status, and appliance possessions. In our study population, the percentage of home owners exceeds the German average (76%, compared to 44%), which is also reflected in slightly higher daily electricity consumptions (10.3 kWh, compared to 8.9 kWh) and household sizes (2.4, compared to 2.0).
We determine participants' relative WTP for a more energy-efficient LED light bulb in comparison to a CFL bulb by using the elicitation format from Allcott and Taubinsky (2015). Our experiment is part of a survey and proceeds in four steps. First, we inform participants about the choice tasks and the technical characteristics of the LED bulb and the CFL bulb.7 To limit the influence of confounding attributes other than energy efficiency, we choose bulbs of the same manufacturer, light intensity, and color.
In a second step, participants fill out a multiple price list and make 15 baseline choices between both bulbs at different relative prices. The relative prices, i.e. the price differences between the LED and the CFL bulb, range from −7 to 7 EUR. In a third step, we randomly assign participants into one of the three experimental conditions and provide them with different information on the bulbs. Participants in the cost condition obtain information on the total purchase and operating cost of consuming 15 000 h of light from CFL (68 EUR) and LED (39 EUR) bulbs, respectively. We discuss the role of the different cost components and summarize total cost as illustrated in Panel (a) of figure 1. In the label condition, we explain the meaning of the EU energy label and present the actual label of the CFL (efficiency class A) and the LED bulb (efficiency class A+), as illustrated in Panel (b). Participants in a control condition obtain information on the evolution of overall lamp purchases in Germany between 2008–2012 (Panel c). The information in the control condition is not intended to influence the WTP for either bulb, but allows to account for any factor other than our treatments that may distinguish endline from baseline choices, such as choice fatigue (e.g. Augenblick and Nicholson 2016).

Figure 1. Visualization of the experimental conditions.
Download figure:
Standard image High-resolution imageIn a fourth step, we confront participants with 15 endline choices that are based on the same multiple price list format from the baseline choices. After the experiment, one of the 30 baseline and endline choices is randomly selected. Participants obtain the chosen bulb and an Amazon voucher on their remaining budget, i.e. the initial budget less the price of the chosen bulb. The size of the budget was announced at the beginning of the survey and exceeds the maximum bulb price by 1, so that participants can afford to buy each bulb at price of the price list.
As part of our experimental design, we also tested whether scaling both the budget and prices influences participants' choices. To do so, we implemented all three experimental conditions with a budget of 12 EUR and prices between 4–11 EUR. In addition, we implemented two conditions that correspond to the control and the cost conditions, but use a budget of 8 EUR with prices ranging from 0–7 EUR, thereby preserving economic incentives. As appendix C illustrates, changes in WTP remain unaffected when we scale the price lists. Therefore, we jointly analyze participants' responses for higher and lower price lists, which results in larger sample sizes for the control and the cost conditions. Appendix D shows that our results remain unchanged when we exclude the participants that got the price list with the lower budget and prices.
We use participants' choices to elicit their relative WTP for the LED bulb. We determine the two relative prices at which participants' choices switch from the LED to the CFL bulb and set participants' relative WTP to the mean of both prices. For example, when a participant prefers the LED at a relative price of 3 EUR, and the CFL at a relative price of 4 EUR, we set the relative WTP to 3.5 EUR. Some participants prefer the LED or CFL bulb at all relative prices and we set their relative WTP to 7 or -7 EUR, respectively. As we do not observe relative WTP higher than 7 EUR, this procedure gives us lower bounds for both the average relative WTP and its change in response to the treatments. We exclude all participants who did not make all 30 choices (141 participants) or switched more than once from prefering one bulb over the other (19 participants), which leaves us with a total of 559 participants.
As demonstrated by the descriptive statistics from table 1, randomization was successful to achieve balance between the three experimental conditions with regard to key demographic variables, such as household size, the average age of household members, and net income. In the experiment, more than 50 percent of the participants choose the more energy-efficient LED bulb even at relative prices of 7 EUR. As the relative market prices are about 1.5 EUR for the two bulbs used in our experiment, those participants certainly choose the LED bulbs and thus they do not constitute the target population of our treatments. Accordingly, we disregard those participants in the remainder of this paper, but show in appendix D that the treatment effects remain qualitatively the same when we include them. The remaining participants largely undervalue energy efficiency on average: While the lifetime cost difference between both bulbs is 29 EUR, the average relative WTP for the LED bulb is only around 3 EUR.
Table 1. Descriptive statistics, by experimental condition.
| Control | Cost | Label | P-value (F-test | |
|---|---|---|---|---|
| Condition | Condition | Condition | for mean equality) | |
| Household size | 2.52 | 2.47 | 2.38 | 0.50 |
| Age of household members, in years | 48.83 | 49.77 | 49.44 | 0.83 |
| Net household income, in 1000 EUR | 5.82 | 5.87 | 5.89 | 0.94 |
| Share of part. with baseline WTP ≥ 7, in % | 0.61 | 0.63 | 0.52 | 0.16 |
| Baseline WTP, in EUR (baseline WTP < 7) | 2.95 | 2.97 | 3.25 | 0.78 |
| Number of participants | 216 | 224 | 119 | Σ = 559 |
| Number of participants (baseline WTP < 7) | 85 | 84 | 57 | Σ = 226 |
Notes: P-values are from an F-Test for mean equality of the respective variables for all three experimental conditions. Baseline WTP excludes all WTP from the analysis that exceed 7 EUR. Observations in the label condition are only about half the number in the other conditions as we have duplicated the control and cost conditions to test for framing effects, as explained in appendix C.
3. Results
We start by visualizing the effects of the experimental conditions on endline demand. As figure 2 shows, demand for LEDs of participants in the label condition is virtually indistinguishable from those in the control condition. In contrast, the demand curve for participants in the cost condition shifts to the right, which provides first graphical evidence that cost information influences choices more strongly than the grade-like summary information from the EU label.
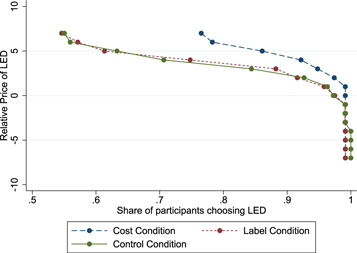
Figure 2. Endline demand for LED bulbs, by experimental condition.
Download figure:
Standard image High-resolution imageNext, we quantify the effect of the treatments on WTP. As the columns (1)–(3) in table 2 illustrate, participants in the control condition on average increased their relative WTP from 3.0 EUR in the baseline to 3.3 EUR in the endline elicitation, a difference of 0.3 EUR that is not statistically significant at any conventional level, though. Participants in the label condition raised their relative WTP only slightly more, by a statistically insignificant 0.4 EUR. In contrast, this difference is far more pronounced for participants in the cost condition, reaching an average of 1.6 EUR, which is statistically significant at all conventional levels.
Table 2. Average WTP for baseline and endline choices and average treatment effects (ATE).
| (1) | (2) | (3) | (4) | |
|---|---|---|---|---|
| Baseline (B) | Endline (E) | Difference (E–B), | ATE, | |
| Average WTP, in EUR | Average WTP, in EUR | in EUR | in EUR | |
| Control Condition | 2.953 | 3.259 | 0.306 | . |
| (0.261) | (0.243) | (0.179) | . | |
| Label Condition | 3.246 | 3.693 | 0.447 | 0.141 |
| (0.321) | (0.305) | (0.265) | (0.320) | |
| Cost Condition | 2.970 | 4.607 | 1.637a | 1.331a |
| (0.325) | (0.315) | (0.294) | (0.345) | |
| # of participants | 226 | 226 | 226 | 226 |
Notes:
aDenotes statistical significance at the 1% level. Standard errors are in parantheses and with respect to within differences (Column 3) and heteroscedasticity robust (Column 4). ATE denotes the average treatment effect. Participants with baseline relative WTP 7 EUR are excluded from the analysis.
We now turn to the estimation of the average treatment effects (ATE) of the label and cost condition by estimating the following model:

where  is the difference in the relative WTP of participant i between the endline and baseline elicitation, LCi and CCi are dummy variables that equal 1 if participant i is in the label and cost conditions, respectively, and
  i is the error term. In this model, participants in the control condition constitute the omitted base group and β and γ identify the ATE of the label and cost conditions, respectively. We estimate the equation by OLS and report heteroscedasticity-robust standard errors.
The fourth column of table 2 illustrates that the ATE of the label condition amounts only to 0.1 EUR, or 4% of baseline relative WTP (0.141/3.246), and is not statistically significant at any conventional level. In contrast, the ATE of the cost condition reaches 45% of baseline relative WTP (1.331/2.970) and is statistically significant at the 1% level. When we test for differences between both ATE, we can clearly reject the null hypothesis that they are the same at all conventional levels (F-Statistic = 9.03, P-Value: 0.003).
Next, we explore the differential impact of the label and cost conditions on the distribution of WTP differences between the baseline and the endline elicitation. As figure 3 illustrates, around 60% of participants in the label condition do not change their relative WTP at all. In the cost condition, only around 40 percent of the participants do not adjust their WTP and many participants increase the WTP by around 3–5 EUR.

Figure 3. Change in WTP after treatment in the cost and label conditions. Note: for better readability, we exclude four observations with relative willingness-to-pay (WTP) differences larger than 7 EUR.
Download figure:
Standard image High-resolution image
4. Discussion and conclusion
In this paper, we have compared the effectiveness of two approaches to increase the WTP for energy efficiency: the current EU label, which presents grade-like efficiency classes, and an intervention that informs participants about the total lifetime-cost savings that arise from more energy-efficient purchases.
Our results from an incentive-compatible randomized controlled trial show that cost information is substantially more effective in increasing the WTP for energy efficiency than the current EU energy label. In particular, we find that the EU energy label has no statistically and economically significant effect on the WTP for the energy-efficient technology, while presenting detailed lifetime-cost information increases relative WTP for the energy-efficient LED bulbs by about 45% of baseline WTP.
An explanation for the muted response of consumers to the current EU energy label may be that the range of efficiency classes for the products that are available on the market is narrow, which may suggest that differences in energy efficiency are only minor. For instance, in our study, participants compare light bulbs with an efficiency class of A+ and A, respectively, while the range displayed on the label ranges from A++ to E. Importantly, such narrow banding is not an exceptional feature of our study, but typical for the EU label. It is a consequence of the so-called EU Ecodesign Directive, which has imposed minimum standards for energy efficiency. For example, while the label for fridges, washing machines, and dish washers displays a range from A+++ to D, efficiency standards ban appliances from the market that have an efficiency class worse than A+ for fridges and washing machines, and worse than A++ for dish washers (EU Directives 643/2009, 1015/2010, 1016/2010).
Our findings contrast with EU expectations that its current energy labels and efficiency standards will annually save 175 million tonnes of oil equivalent by 2020, approximately the annual primary energy consumption of Italy (European Commission 2016). While we cannot assess the effectiveness of efficiency standards in this paper, our evidence suggests that the contribution of the current EU energy labels is only minor. In contrast, information that makes operating cost more salient is very effective, which offers guidance for the design of effective climate policies. For example, energy labels could easily be amended to include operating cost estimates. Furthermore, product inserts could present detailed information how energy efficiency translates into operating cost, just as we did with our study participants. In addition, digitization of shopping behaviors allows to convey personalized product information to consumers at the time of purchase, e.g. in web shops. Alternatively, a recalibration of energy efficiency classes that avoids the current narrow banding and employs the full range from A–G to distinguish products on the market, for example, could increase the effectiveness of the EU energy label. Yet, whether such rescaling actually fosters more energy-efficient choices is unknown and thus an interesting question for future research.
Acknowledgments
We gratefully acknowledge financial support by the SUN Institute Environment & Sustainability, the Swiss National Science Foundation (SNF) under grant 407140_153675 (NFP 71) and the Deutsche Forschungsgemeinschaft (DFG, German Research Foundation) under grant CRC TR 224. Furthermore, this work has been partly supported by the Collaborative Research Center Statistical Modeling of Nonlinear Dynamic Processes (SFB 823) of the DFG, within Project A3, Dynamic Technology Modeling. We thank Thomas Jaletzky, Gerhard Radtke, Lara-Franziska Rogowski, and Peter Schulten from innogy for excellent cooperation in conducting the field experiment. Furthermore, we are grateful to Benedikt Kauf for very good research assistance.
Footnotes
- 6
For a more comprehensive overview of the energy labeling literature see, for example, Andor and Fels 2018.
- 7
Screenshots for all screens of the experiment are displayed in appendix B.