

Abstract
An assessment is carried out of future changes in the agroclimatic conditions and crop productivity of spring wheat across the major grain-growing regions of European Russia. Calculations are conducted using a crop model driven by high-resolution, multiple realization regional climate change simulations under the IPCC RCP8.5 scenario. It has been shown that this scenario can lead to a future decrease in the yield of spring wheat by 9.1 ± 2.3% (2030–2039), 10.3 ± 3.2% (2050–2059), and 18.9 ± 2.8% (2090–2099) as compared with the yield at the end of XX century. In the southeastern part of the region, where there are major spring wheat areas, the projected yield change is expected to be –6.7 ± 3.0% by 2050–2059 and −21.5 ± 3.1% by 2090–2099. Fertile lands in the Central Black-Earth region (southwest of Moscow) will suffer even more due to a significant increase in the aridity and decrease of the growing season. There the projected drop in yield is simulated to be 15.8 ± 5.1% by 2050–2059 and 32.9 ± 3.4% by 2090–2099. However, the major losses in total production (gross yield) are expected to occur in the Privolzhsky Federal District where the spring wheat areas amount to 87% of the total cultivated area in the region.
Export citation and abstract BibTeX RIS

Original content from this work may be used under the terms of the Creative Commons Attribution 3.0 licence. Any further distribution of this work must maintain attribution to the author(s) and the title of the work, journal citation and DOI.
1. Introduction
Russia provides a significant contribution to meeting the demand for grain on the global scale [1, 2]. In 2016, wheat production in Russia amounted to 73.3 Mt/a (third rank in the world), of which 61% were produced in European Russia. Based on coarse resolution climate projections, the expected contribution of global warming to yield reduction in major grain-producing regions of Russia is estimated to fall in the range 10%–20% by 2035, relative to the end of the XX century ([3], p 994). Owing to high spatial inhomogeneity of regional agroclimatic conditions, the above estimates, however, need to be further justified using higher resolution climate projections. There is also a vital need to improve existing methods for assessing the impacts of climate change on the productivity of crops and the associated risks of crop losses [3–6].
Recent assessments of climate impacts on agriculture are usually based on climate model projections and calculations of agroclimatic indices (e.g. Trnka et al [7]; Lioubimtseva et al [8]). There are two approaches to estimate climate change impacts on the agricultural sector, based on regression and dynamic crop models. Over the past decade, regression models have made a significant progress [9–13]. More sophisticated are dynamic models, which use historical yield data and meteorological observations and are able to simulate crop yields by taking into account the use of fertilizers, regulators of sowing, irrigation, and other techniques [14–17]. Projects AgMIP/ISIMIP employ 27 models of spring wheat dynamics that allow one to assess its productivity at global and regional scales and, particularly, over Russian croplands [18, 19]. A recent study [20] provides statistical evidence of changes in productivity of cereals from a panel approach. They conclude that under unchanged acreage their productivity is expected to drop by the end of the XXI century by 6.1% under the lowest emissions scenario, and by 50.6% under the business-as-usual scenario.
Uncertainties of estimates of future yield changes emerge from differences between the IPCC scenarios [21] of future radiative forcings, differences in modeling physics, spatial resolution, and responses to radiative forcings, and multiscale internal climate variability. To minimize the effect of climate variability on the detectability of climatic trends due to anthropogenic influence, there is a good practice to build large ensembles of model simulations [22]. Large ensemble size (dozens of members) along with high model resolution allow one to improve quantification of high-impact climate events in probability and physical spaces and therefore obtain a more justified estimate of their effects on agriculture. Resolution 101 km, typical for state-of-the-art regional climate model (RCMs), adds value to global climate projections, particularly, through the explicit description of the mesoscale component of internal variability [23].
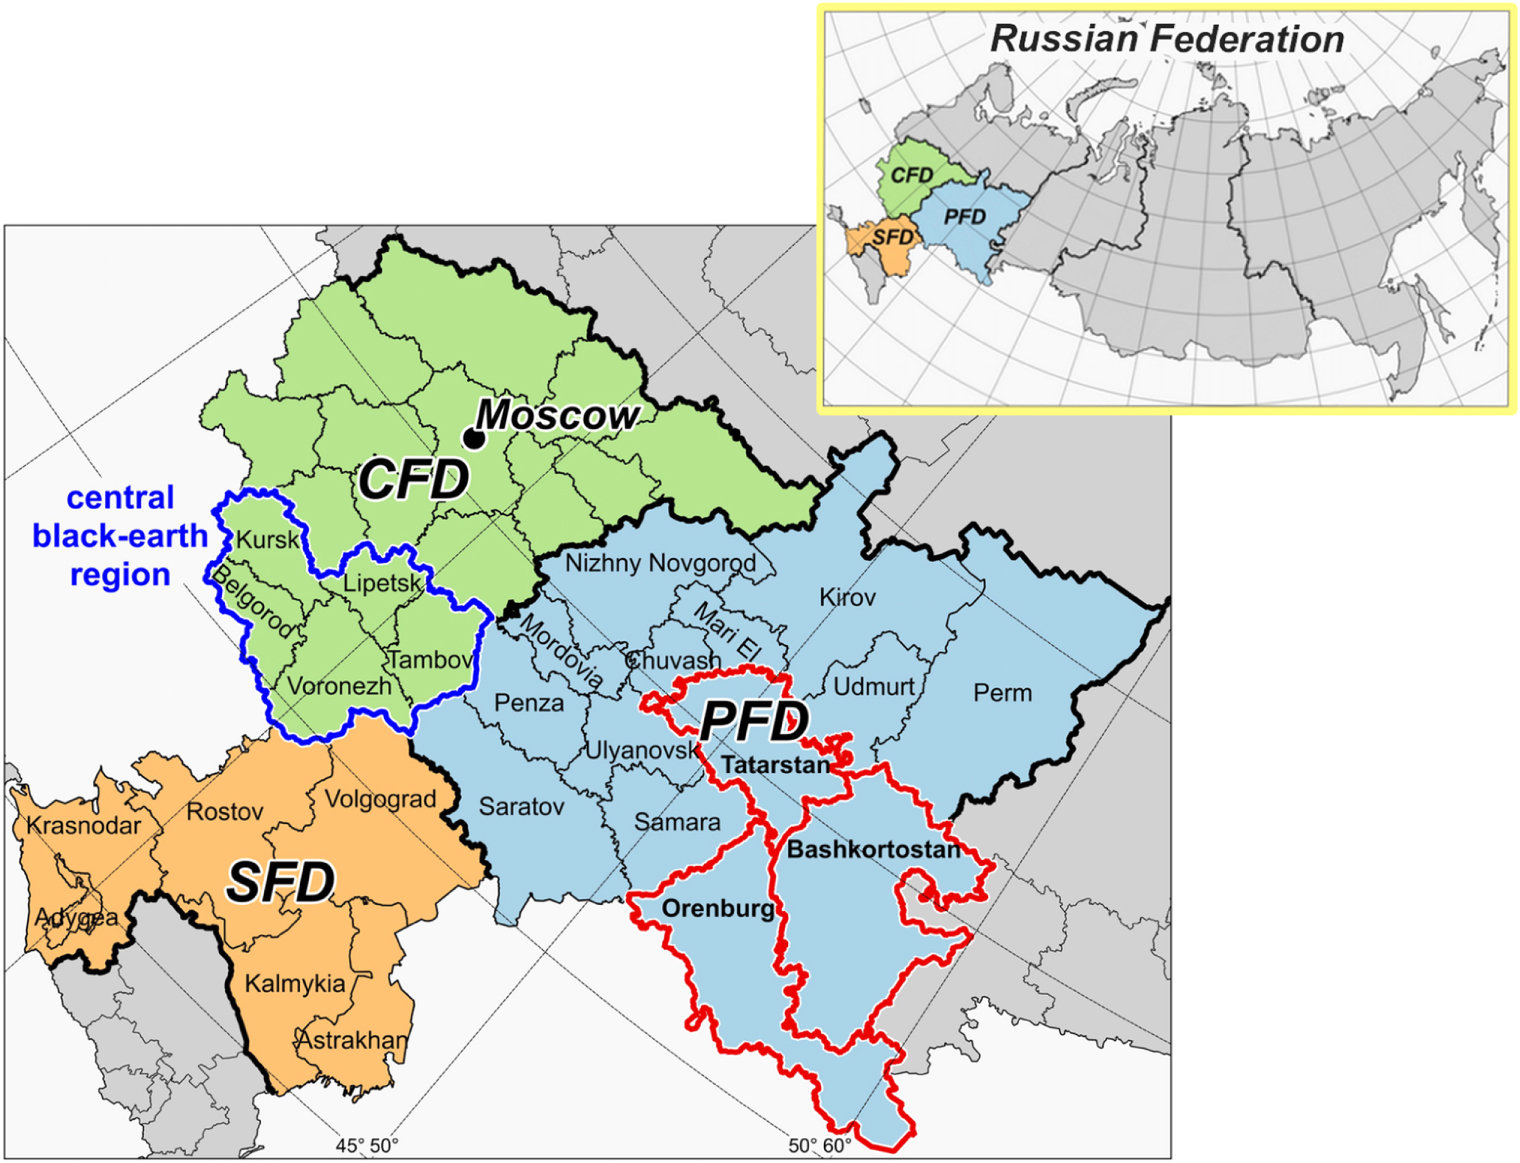
In this study, mesoscale climate impacts on agriculture in Russian major grain-producing regions are estimated based on a large ensemble of projections (50 members) with a high-resolution (25 km) RCM and a sophisticated crop model. The region of interest includes Central, Privolzhsky and Southern federal districts, further referred to as CFD, PFD, and SFD, respectively (figure 1). During 2007–2016, the average spring wheat acreage amounts to 4.5 million ha. According to (Rosstat, 2016) this estimate corresponds to 32% of the national spring wheat acreage. Area percentage of spring wheat in PFD, CFD and SFD is 87.4%, 7.3%, and 5.3%, respectively (figure 2). As compared with the 1997–2006 period, the area planted with spring wheat has decreased over a significant part of the region, notably in southern and eastern parts of PFD (by 100–300 thousand ha).

Figure 1. Shown are the three federal districts for which an analysis of future changes in the crop productivity is carried out: Central, Privolzhsky, and Southern referred to as CFD, PFD, and SFD, respectively. Blue contour denotes the boundaries of the Central Black-Earth region, red contour shows delimitation of the three areas in the PFD (Tatarstan, Bashkortostan and Orenburg regions).
Download figure:
Standard image High-resolution image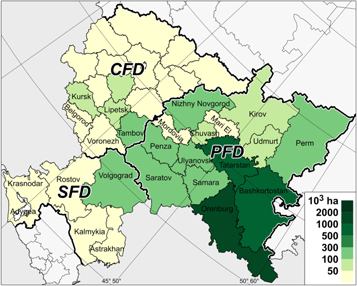
Figure 2. Spring wheat area (thousand ha) during 2007–2016 in the three federal districts.
Download figure:
Standard image High-resolution image2. Experimental setup and crop model validation
The Voeikov Main Geophysical Observatory (MGO) RCM used here encompasses the entire territory of Russia [24]. The input information (atmospheric pressure, temperature, moisture, and momentum) in the RCM is provided every 6 h at the domain lateral boundaries by the MGO atmospheric global model [25] of a lower resolution (∼200 km). Both models have the same vertical resolution (25 sigma layers of different thickness) and similar parametrization of physical processes in the atmosphere and active soil layer. These processes include the transfer of solar and longwave radiation in the cloudy atmosphere, large-scale condensation, and convection, turbulent exchange of heat, moisture and momentum, the transfer of heat and moisture in the active layer of the soil, the processes of snow melting (accumulation), etc.
Fifty experiments with global and regional models, differing in the atmospheric and land surface initial conditions have been conducted spanning four decadal periods 1990–1999 (baseline), 2030–2039, 2050–2059 and 2090–2099 using IPCC RCP8.5 scenario, with each 10-year realization considered equally likely for the same period. Thus, for each period the projection samples 50 × 10 = 500 years of climate variability. The models use the same prescribed evolution of the sea surface temperature, and sea ice concentration derived from the five CMIP5 [26] models: ACCESS1–0 (Australia), CESM1-CAM5 (USA), MPI-ESM-MR (Germany), GFDL-CM3 (USA) and INM-CM4 (Russia). The latter two project the strongest and weakest warming in the XXI century out of the CMIP5 ensemble, respectively, whilst the other three models simulate changes close to the CMIP5 ensemble mean estimate.
Representative concentration pathways (RCPs) are four greenhouse gas concentration trajectories adopted by the IPCC for its Fifth Assessment Report (AR5) in 2014. The feasible range of human greenhouse gas emissions is very large. The RCPs span a range from less than 450 parts per million (ppm) CO2 for RCP2.6 to greater than 900 ppm for RCP8.5 by 2100. According to RCP8.5, for the three periods considered here (2030–2039, 2050–2059 and 2090–2099), the CO2 concentrations correspond to 460, 570 and 925 ppm, respectively [21, 27]. We use this extreme high-emissions scenario to estimate a higher bound of future changes in spring wheat productivity.
The impact model 'Climate-Soil-Yield' (CSY) allows one to evaluate changes in the productivity of crops and incorporates:
- (1)weather-yield dynamics of agroecosystem productivity [17];
- (2)stochastic models permitting generation of annual series of daily meteorological characteristics corresponding to specified climate normals [28];
- (3)a database including hydrometeorological information over the 50 year historical period, scenarios of possible climate changes and information about physical and chemical soil properties in the region of interest; and
- (4)methodology for assessing the impact of climate change on the productivity and sustainability of agriculture [29].
CSY does not simulate any management and adaptation effects. The model accounts for carbon, nitrogen, and water dynamics in the agricultural ecosystem from seedling to maturing of the crop. The model enables detailed calculation of aging and decay of biomass including recycling of decomposition products, moisture regime that allows one calculating the dynamics of soil moisture for the most important soil types in the area of interest. CSY-simulated mineral nutrition of plants accounts for the processes of anthropogenic degradation of soils. The model includes an assessment of the direct effects of carbon dioxide and ozone on the plant surface through stomatal regulation. The direct effect of changes in CO2 forcing is accounted for through photosynthesis simulated using a modified Chartier relationship [30]. The photosynthesis results in a stimulatory response of the crop. Enrichment of the atmosphere in CO2 can compensate to some extent the agriculture losses connected with global warming. Numerical experiments have shown that the increase in CO2 concentration by 570 ppm (under scenario RCP8.5 for the period 2050–2059), with other things being equal, leads to an increase in the yield of spring wheat by 10%–25%, depending on the conditions of heat and moisture supply. The study [17] indicates that an increase in the tropospheric ozone concentration by 30% leads to a drop in wheat productivity by 6%–10%. Here, we account for the effect of an increase in CO2 concentration only.
Input information in CSY is temperature- and precipitation-simulated here by the MGO RCM ensemble (CSY setup is the same for all the simulations). Validation of CSY is based on retrospective modeling when the model is driven by meteorological and agrometeorological observations spanning 2007–2016. The simulation is compared with the observed dynamics of yields for the same period in large sowing areas occupied by grain crops in Orenburg region, Tatarstan and Bashkortostan, and three federal districts CFD, PFD, and SFD.
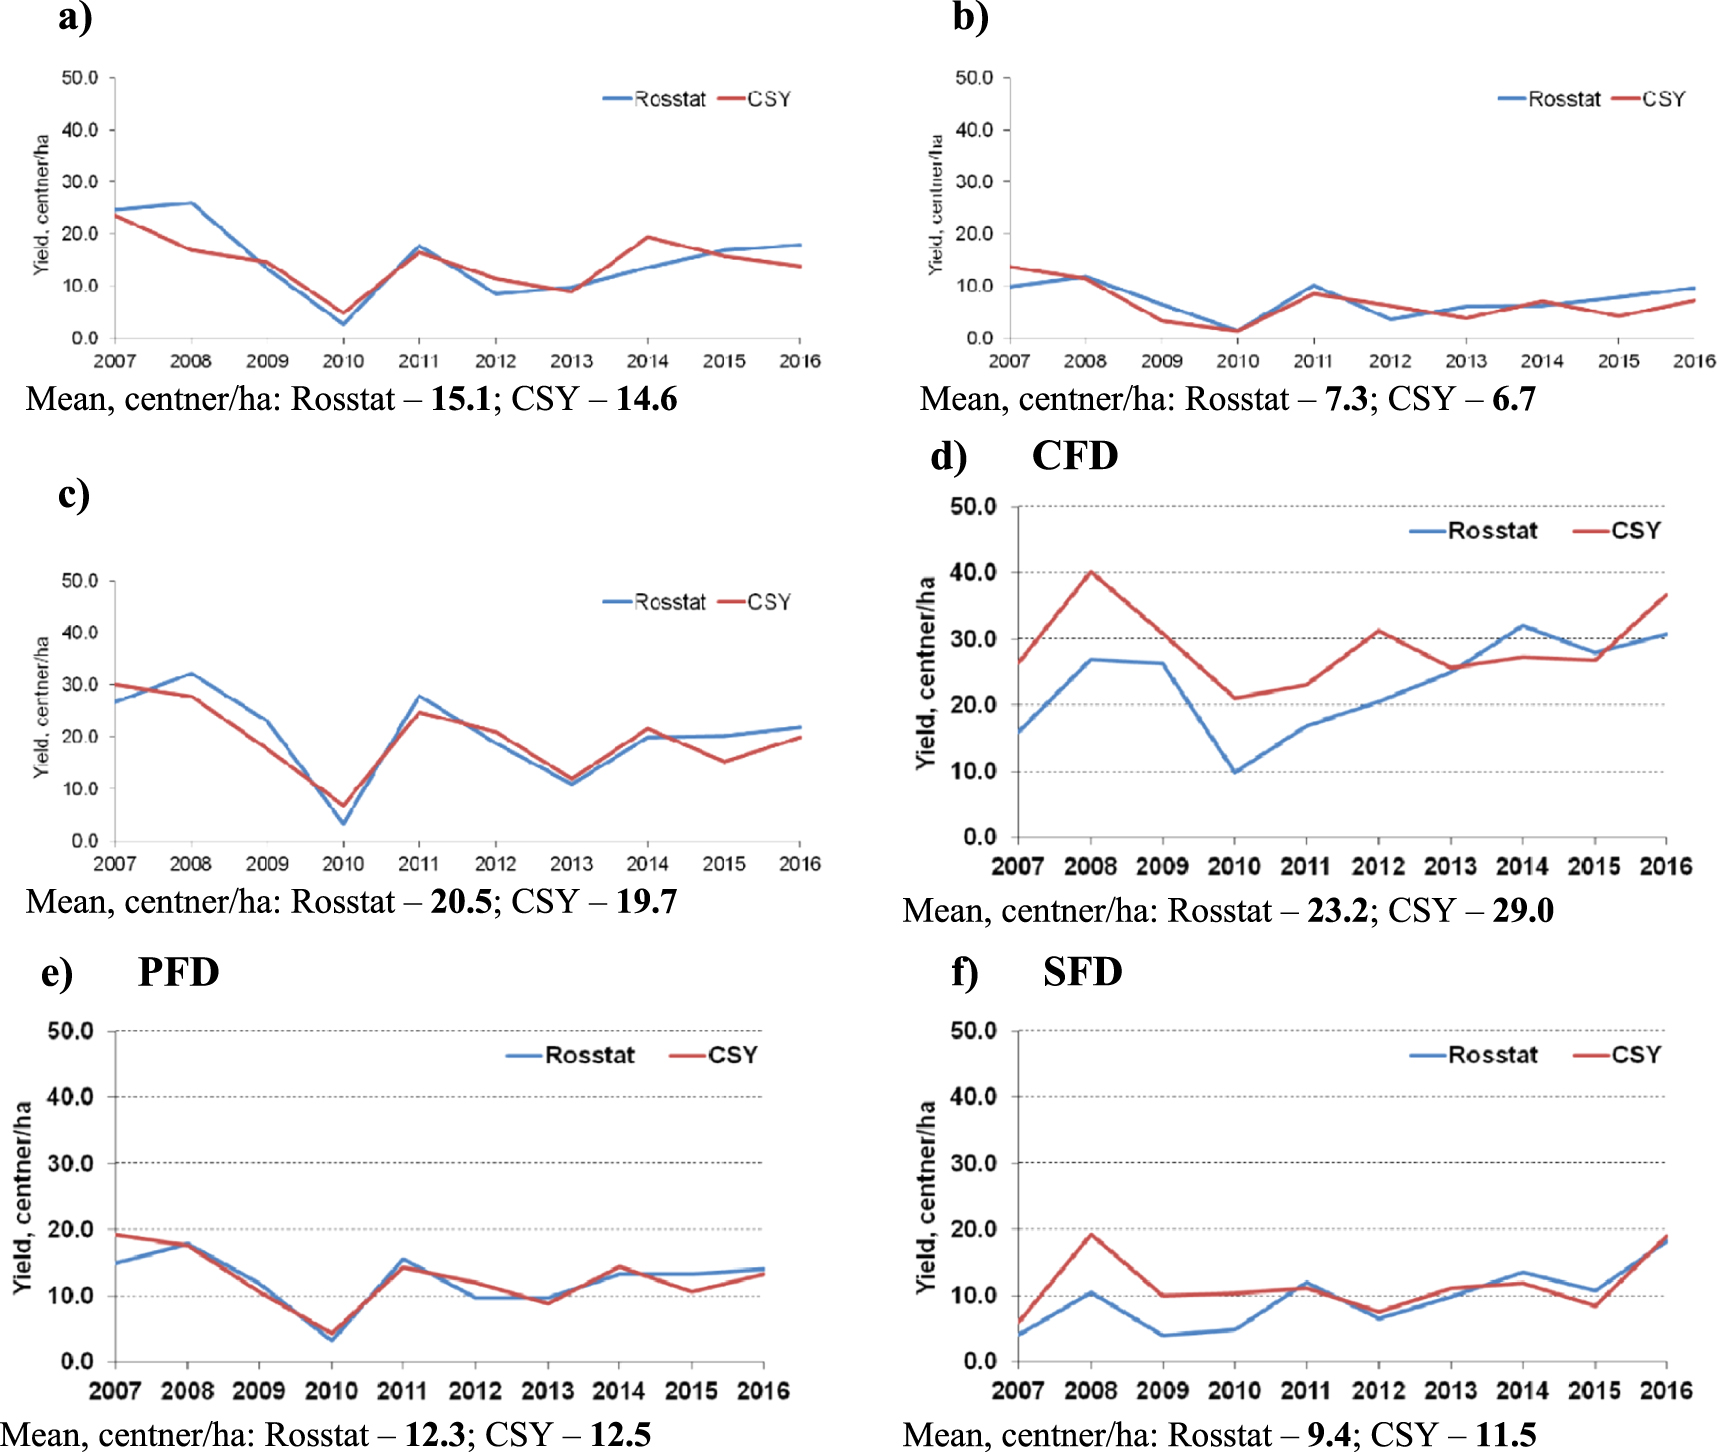
The degree of consistency between the simulated and observed yields depends on the region considered (figure 3). For PFD, the CSY estimates averaged over 2007–2016 appear to be close to those observed and equal to 12.5 and 12.3 centners per ha, respectively. The interannual variability of yields is consistent there with that observed. For CFD and SFD, the simulated yield is somewhat overestimated during 2007–2010, however, there is a reasonable agreement between simulation and observations in 2011–2016. In general, CSY reproduces the evolution of yields across the regions capturing crop failure due to the extremely dry hydrometeorological conditions in 2010 and good yield under the favorable agrometeorological conditions observed there in 2007, 2008, 2011 and 2016.
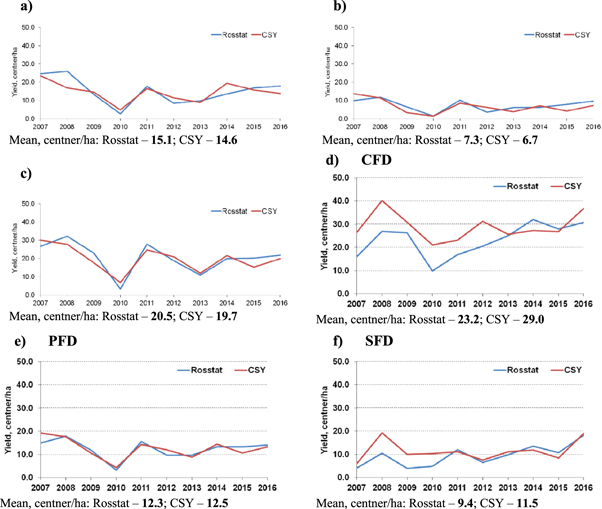
Figure 3. Observed (Rosstat) and simulated (CSY) productivity of spring wheat in Bashkortostan (a), Orenburg area (b), Tatarstan (c) (see figure 1), and productivity of spring wheat across the three federal districts CFD, PFD, SFD (d)–(f) shown in figure 1, spanning 2007–2016.
Download figure:
Standard image High-resolution imageIn figure 4 shown are the simulated and observed yields of spring wheat across CFD, PFD and SFD, containing 5, 14 and 5 sub-federal units, respectively. Correlation between CSY simulation and Rosstat data for 2007–2016 and 2012–2016 appears to be high (0.85 and 0.90, respectively) implying the CSY reasonably well reproduces interannual variability of the yield (figure 4). Respective root means square departures are equal to 5.1 and 3.9 centners per ha suggesting that there is a contribution from the improved management in recent years (prominently in CFD and SFD).
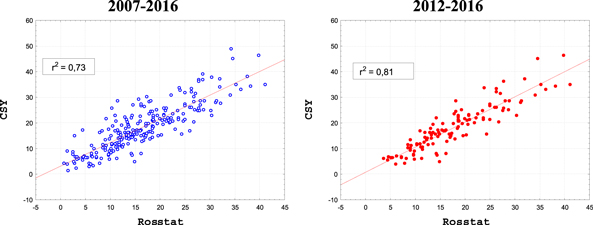
Figure 4. Observed (Rosstat) and simulated (CSY) productivity (centner per ha) of spring wheat during 2007–2016 and 2012–2016 for 24 sub-federal units in the three federal districts (PFD, CFD, and SFD).
Download figure:
Standard image High-resolution image3. Projected changes in seasonal surface air temperature and precipitation as drivers of crop productivity
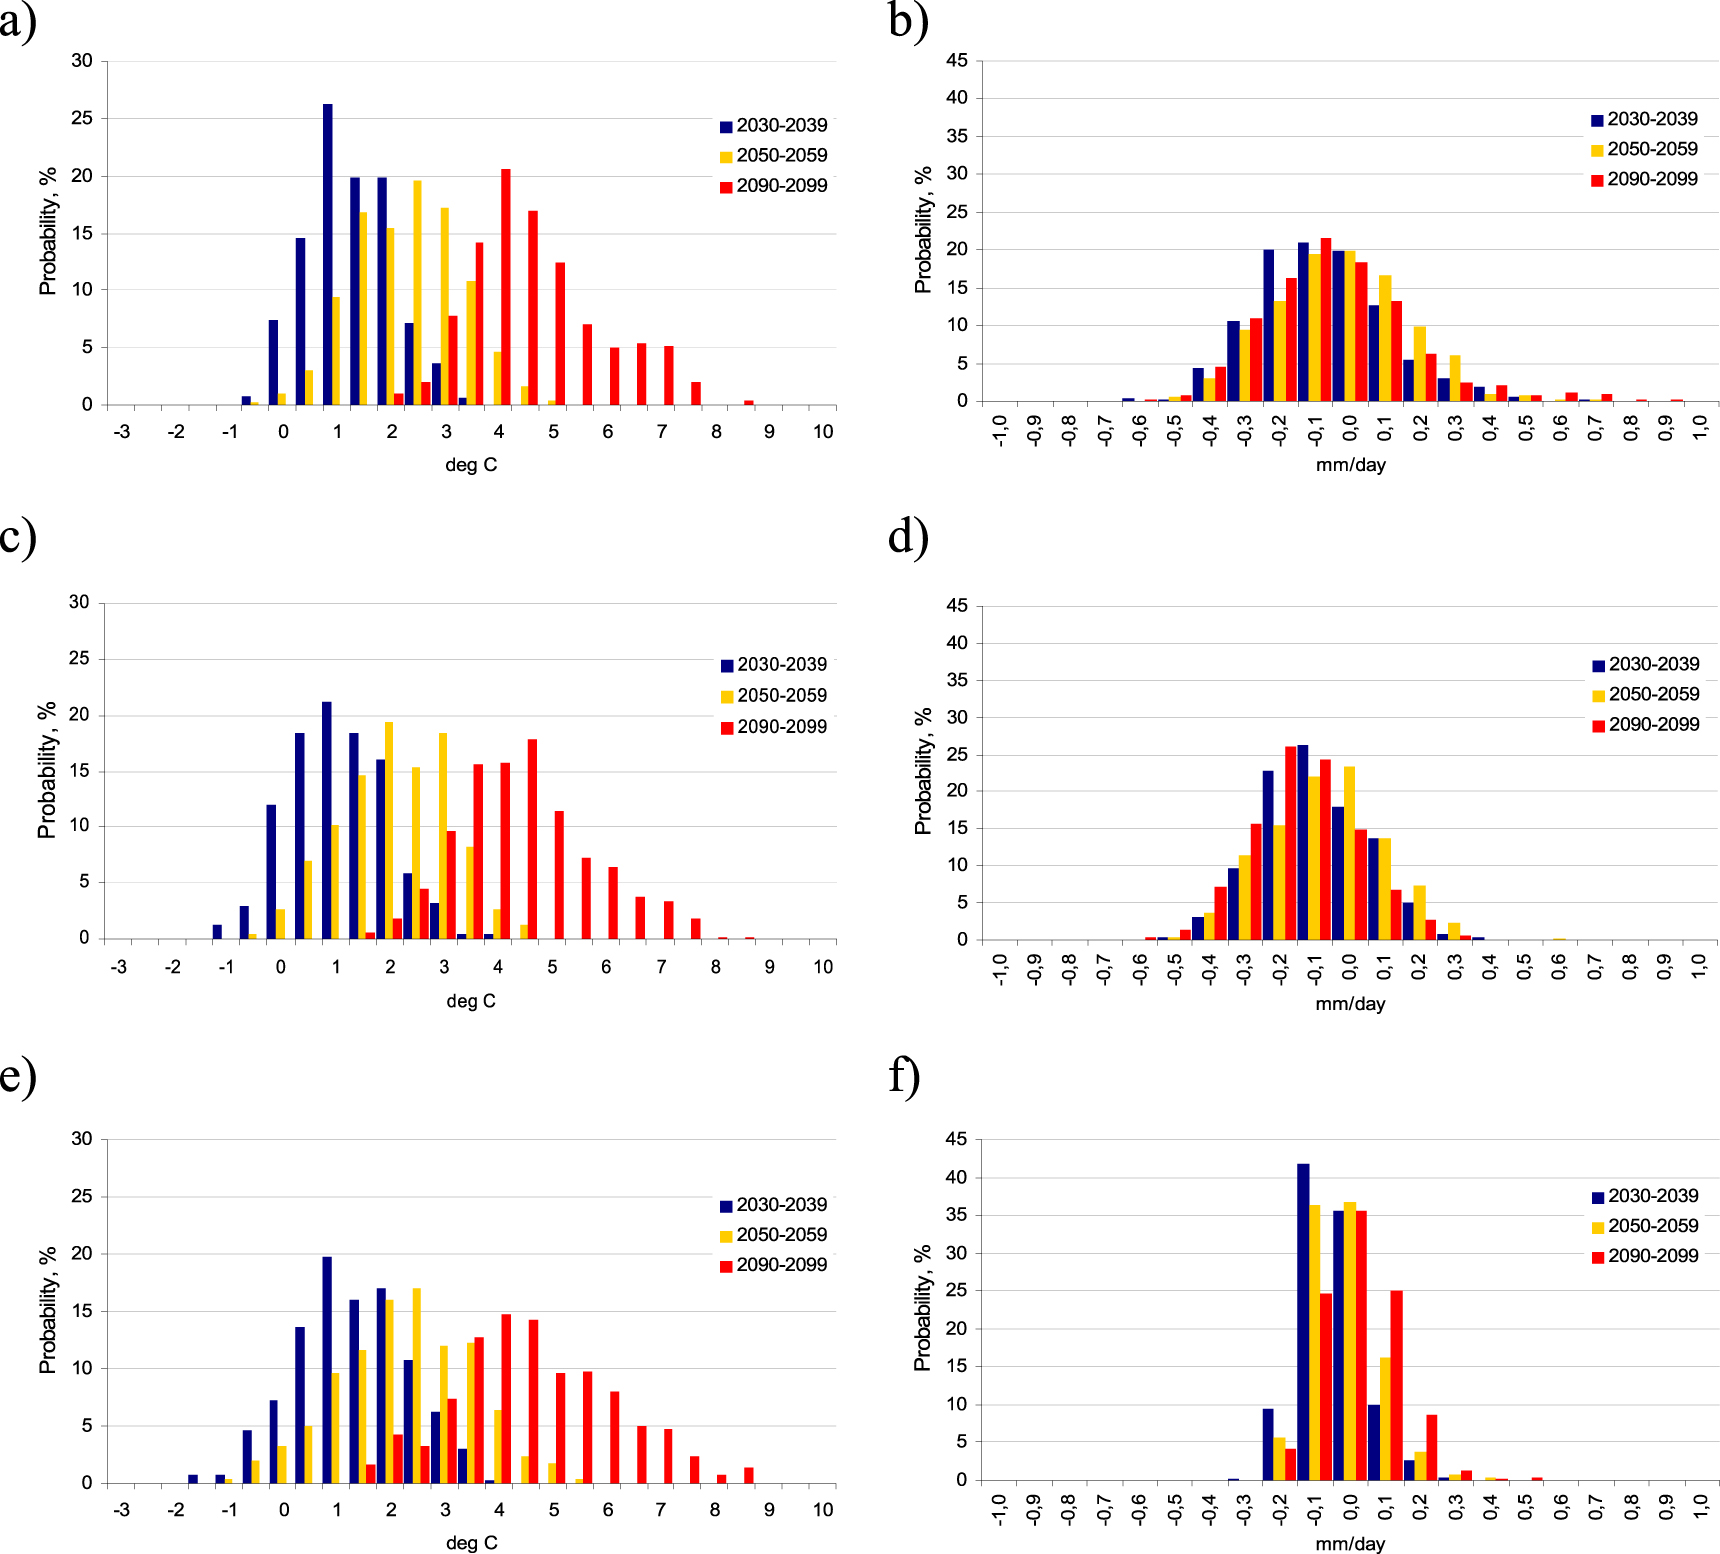
The most widely used time scale in the agricultural sector is the duration of the warm (growing) season. In this study, seasonal temperature and precipitation for individual years in the future are compared with those averaged over the baseline interval (1990–1999). Such a comparison allows for estimating the expected probability of future changes in hydrothermal conditions across agricultural regions. Despite the general effect of global warming (the majority of growing seasons are projected to be warmer than that in the baseline period), there is a non-zero probability of the occurrence of colder seasons at least until the mid-XXI century, as compared to baseline simulation (figure 5). The colder seasons can be accompanied by precipitation amounts close to that in the baseline period in CFD and SFD until the end of the XXI century. In PFD, there is a prominent consistency across the ensemble members in the projected decrease of precipitation by 0.1–0.2 mm d−1 during 2030–2099. This implies that in PFD, there is a higher risk of the increase in the frequency of droughts throughout the forthcoming decades as compared to that in the other two regions.
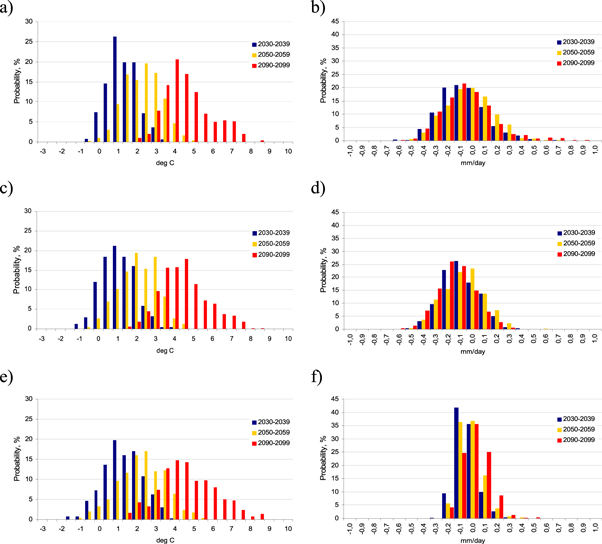
Figure 5. Probabilistic distribution functions of the projected changes in the surface air temperature (a), (c), (e) and precipitation (b), (d), (f) during warm period (May–September) in the CFD (a), (b), PFD (c), (d), and SFD (e), (f) as simulated by fifty-member ensemble of the RCM for 2030–2039, 2050–2059, and 2090–2099 relative to 1990–1999 under RCP8.5 scenario. Units are °C and mm d−1, respectively.
Download figure:
Standard image High-resolution image4. Projected changes in agroclimatic indices and productivity of grain crops
By and large, in CFD, SFD, and PFD, a decrease in the regional water budget is projected (table 1). As the surface air temperature increases, evaporation during the warm period (the period with a temperature above 5°C) tends to increase, accompanied by a weak change in precipitation (see above). An increase in evaporation capacity leads to an increase in the evaporation deficit (the difference between the potential and actual evaporation). The range of the evaporation deficit for the warm period is expected to increase from 41–61 mm by 2030–2039 to 102–167 mm by 2090–2099. The climate continentality index (the difference between July and January temperatures) is expected to increase insignificantly (by 0.2 °C–0.3 °C) in 2030–2039, but a more substantial increase (1.9 °C–2.4 °C) is projected by the end of XXI century.
Table 1. Changes in the temperature (T), precipitation (P) and other agroclimatic indicators during the spring wheat vegetation period by 2030–2039, 2050–2059, and 2090–2099 relative to 1990–1999 (also shown) as simulated by the impact model climate-soil-yield driven by regional climate model ensemble projection under IPCC RCP8.5 scenario. Shown are the mean changes and the changes for the two out of fifty modeling realizations that correspond to the wettest ('wet') and most xeric ('dry') projections. The selection of these two is carried out based on the analysis of the projected yield along with heat and moisture availability in the future.
| Federal district | Projection | Mean T, °C January | Mean T, °C July | Sum of T > 10 °C | Germination date, day | Vegetation period, day | Mean T of the vegetation period, °C | Mean P of vegetation period, % | Hydrothermal coefficient | Soil moisture in upper 1 m layer in June, mm | Evaporation deficit, mm |
|---|---|---|---|---|---|---|---|---|---|---|---|
| 2030–2039 | |||||||||||
| CFDa | Mean | 2.2 | 2.0 | 401 | −5 | −5 | 1.0 | −12 | −0.14 | −17 | 61 |
| Wet | 1.2 | 0.2 | 262 | −8 | 2 | −0.2 | 17 | 0.19 | −20 | 64 | |
| Dry | 1.5 | 4.0 | 948 | −8 | −12 | 2.3 | −26 | −0.27 | −19 | 101 | |
| PFD | Mean | 2.1 | 1.8 | 351 | −5 | −7 | 1.2 | −13 | −0.14 | −17 | 59 |
| Wet | 0.3 | 0.5 | 143 | −1 | −1 | 0.2 | 9 | 0.09 | −9 | 31 | |
| Dry | 2.3 | 4.0 | 740 | −10 | −13 | 2.4 | −25 | −0.25 | −26 | 92 | |
| SFD | Mean | 1.9 | 1.9 | 418 | −6 | −3 | 0.5 | 4 | 0.07 | −8 | 41 |
| Wet | 1.5 | 1.1 | 254 | −9 | 3 | −0.6 | 2 | 0.01 | −8 | 32 | |
| Dry | 0.9 | 3.4 | 784 | −7 | −7 | 1.3 | −3 | −0.01 | −7 | 57 | |
| 2050–2059 | |||||||||||
| CFDa | Mean | 3.8 | 3.0 | 681 | −10 | −7 | 1.2 | −11 | −0.12 | −23 | 97 |
| Wet | 0.5 | 1.5 | 353 | −5 | −2 | 0.4 | −1 | −0.02 | −19 | 71 | |
| Dry | 2.4 | 5.0 | 1018 | −20 | −15 | 3.1 | −37 | −0.42 | −14 | 140 | |
| PFD | Mean | 4.2 | 2.8 | 629 | −11 | −10 | 1.6 | −15 | −0.16 | −29 | 101 |
| Wet | 0.9 | 1.5 | 376 | −9 | −4 | 0.6 | −12 | −0.15 | −22 | 71 | |
| Dry | 2.5 | 3.8 | 825 | −20 | −13 | 2.2 | −20 | −0.20 | −40 | 130 | |
| SFD | Mean | 3.3 | 2.9 | 720 | −10 | −4 | 0.8 | 5 | 0.08 | −10 | 63 |
| Wet | 1.5 | 1.2 | 435 | −7 | 0 | −0.2 | 17 | 0.15 | −13 | 44 | |
| Dry | 0.9 | 4.7 | 1035 | −18 | −11 | 2.7 | −52 | −0.43 | 3 | 57 | |
| 2090–2099 | |||||||||||
| CFDa | Mean | 8.4 | 5.6 | 1339 | −22 | −9 | 1.6 | −19 | −0.19 | −32 | 137 |
| Wet | 8.8 | 4.5 | 1258 | −27 | −3 | 0.0 | 40 | 0.52 | −41 | 125 | |
| Dry | 12.5 | 8.0 | 2063 | −26 | −16 | 3.7 | −32 | −0.36 | −73 | 135 | |
| PFD | Mean | 8.4 | 5.6 | 1271 | −22 | −14 | 2.5 | −25 | −0.26 | −45 | 167 |
| Wet | 9.7 | 5.4 | 1261 | −23 | −14 | 2.2 | −12 | −0.12 | −47 | 174 | |
| Dry | 11.6 | 8.1 | 1917 | −29 | −19 | 3.6 | −31 | −0.29 | −46 | 189 | |
| SFD | Mean | 7.3 | 5.4 | 1383 | −27 | −1 | 0.6 | 11 | 0.13 | −24 | 102 |
| Wet | 7.1 | 4.8 | 1348 | −44 | 13 | −2.1 | 65 | 0.54 | −34 | 104 | |
| Dry | 10.0 | 7.5 | 1999 | −35 | −1 | 1.6 | 4 | 0.09 | −51 | 106 | |
| Mean values for 1990–1999 | |||||||||||
| °C | °C | °C | dd mm | day | °C | mm | mm | mm | |||
| CFDa | — | −9.5 | 20.2 | 2519 | 05.05 | 87 | 17.5 | 172 | 1.13 | 118 | 397 |
| PFD | — | −14.1 | 19.0 | 2102 | 19.05 | 90 | 17.0 | 168 | 1.11 | 127 | 315 |
| SFD | — | −6.4 | 23.3 | 3236 | 28.04 | 82 | 18.9 | 122 | 0.80 | 51 | 604 |
To characterize the degree of humidification of the region, the hydrothermal coefficient (HTC) is used [31]:
where t is the daily mean temperature (°C) for the period May–August, r is the sum of precipitation (mm) for the same period. The analysis shows that under the RCP8.5, the degree of climate aridity increases in all three districts for all periods considered. In CFD and PFD, the HTC is projected to decrease in the range −0.16 to −0.12 by 2050–2059, and −0.26 to −0.19 by the end of XXI century. Thus, the respective decrease of moisture content in the upper 1 m soil layer in PFD amounts to 29 and 45 mm. The expected increase in aridity affects the territory of SFD to a lesser degree, as there is no pronounced decrease in HTC and only a slight decrease in soil moisture content in June.
In the near and mid-term, the sums of active temperatures are projected to increase in the ranges 351 °C–418 °C (2030–2039) and 629 °C–720 °C (2050–2059). By the end of the XXI century, the sums are projected to almost double with respect to those in the baseline period. The respective dates of germination of spring wheat occur 5–6, 10–11 or 22–27 days earlier than in the baseline period. In the mid-term, the sums of precipitation during the growing season of spring wheat are projected to decrease by 11%–15% in CFD and PFD and to increase by 4%–5% in SFD. By the end of the century, the mean temperature of vegetation season (the period from seed germination date to the date of maturity) rises by 1.6 °C–2.5 °C along with the decrease in precipitation in CFD and PFD by 19%–25%.
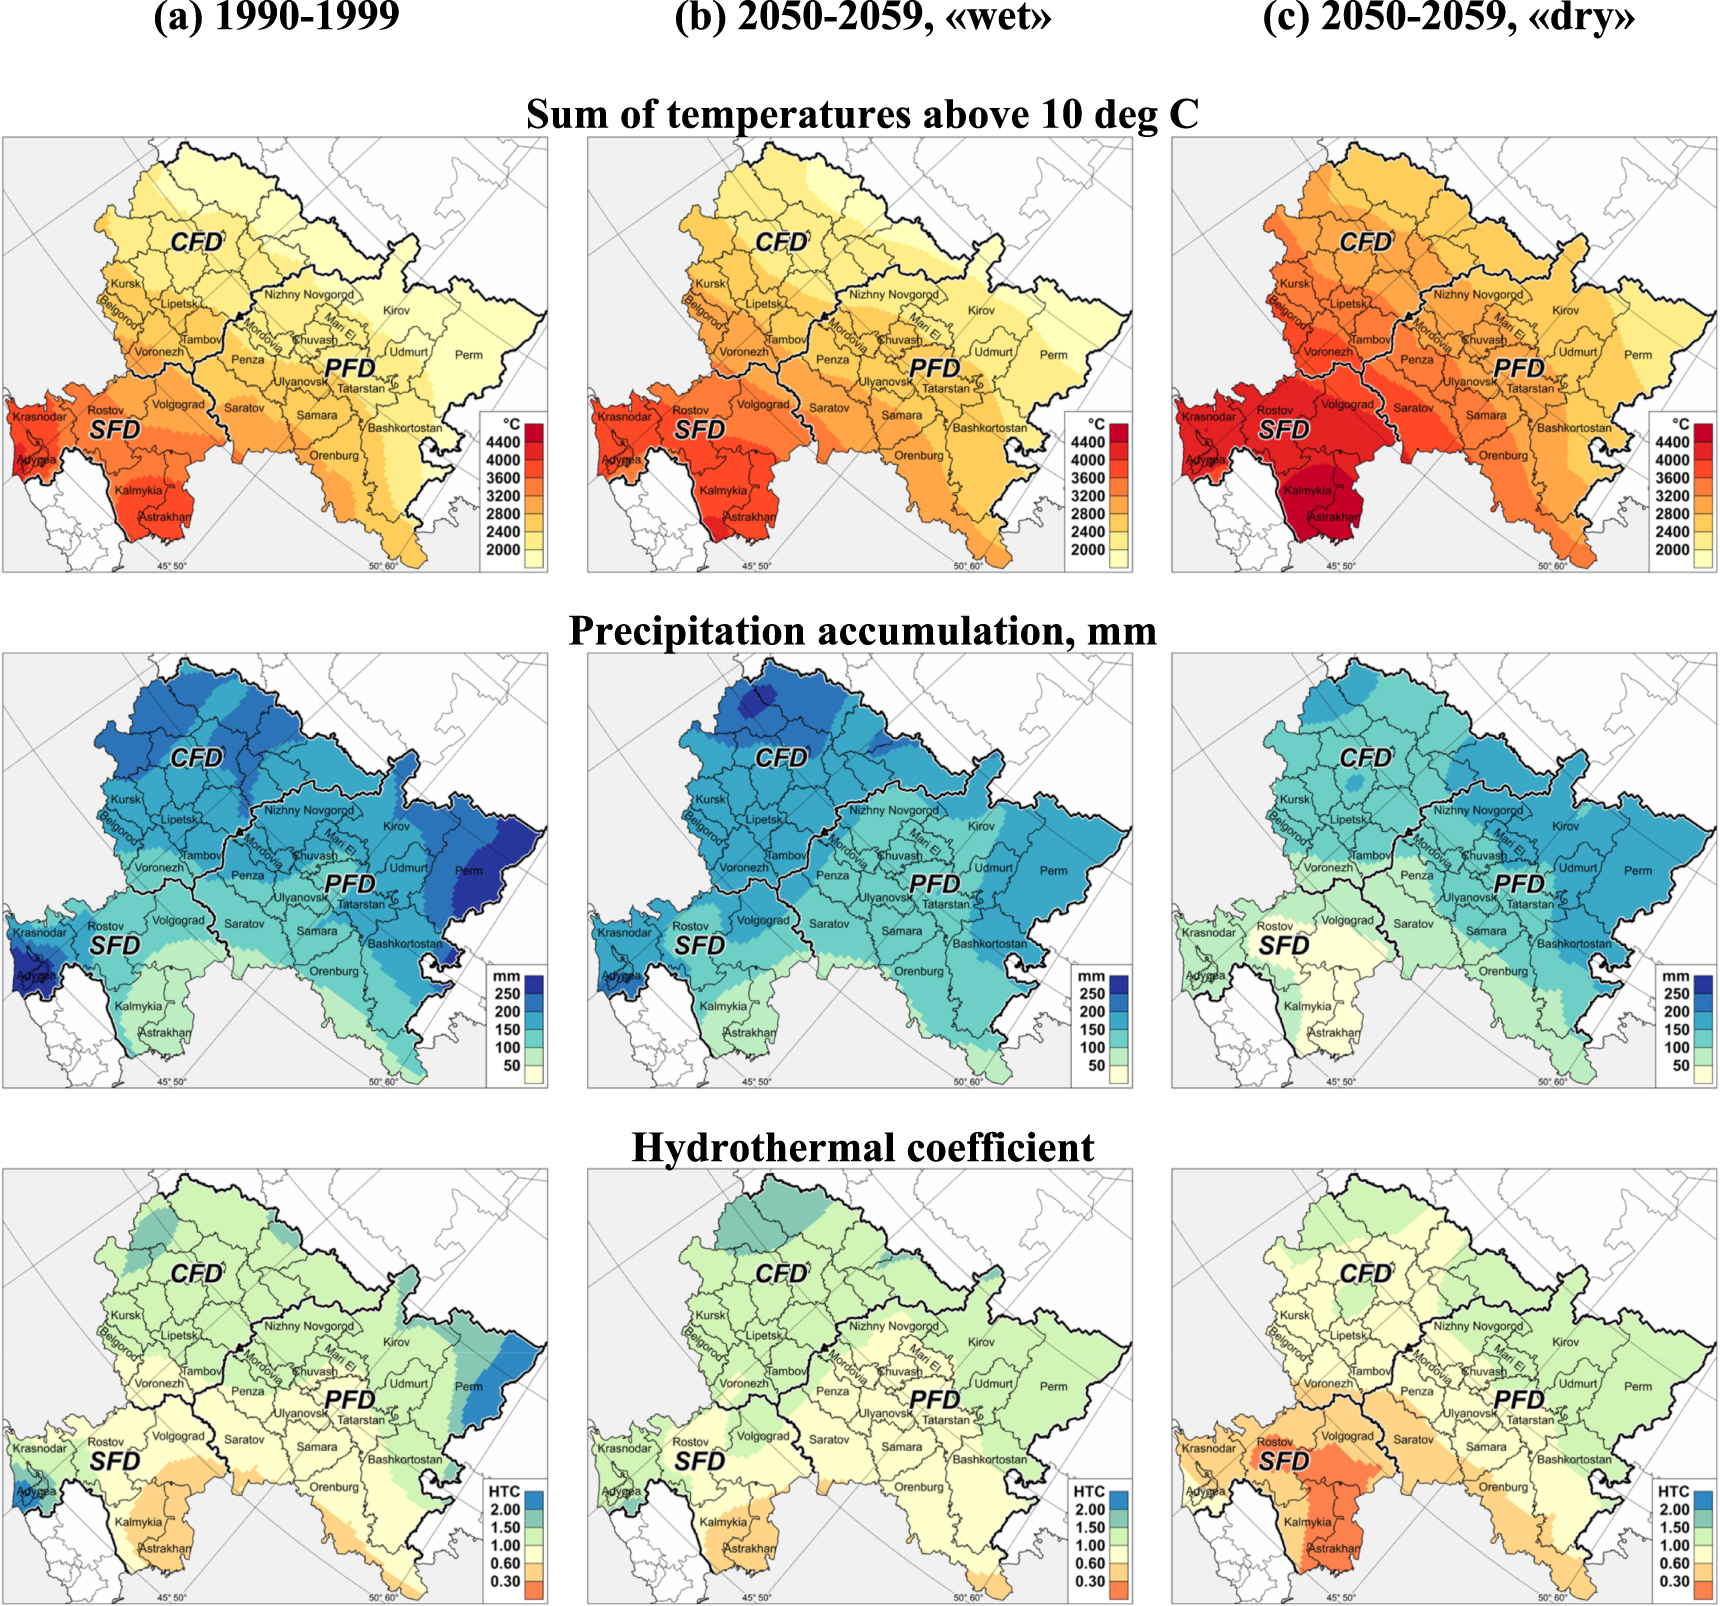
Calculation of agroclimatic indices for the two 'extreme' realizations ('wet' and 'dry') allows one to evaluate the range of uncertainty in predicting the impacts of climate change on the agricultural sector. Regarding the mid-term perspective (2050–2059) there is an increase in July temperature (table 1) ranging from 3.8 °C–5.0 °C ('dry') to 1.2 °C–1.5 °C ('wet'). By the mid-XXI century for the 'dry' realization, HTC decreases by 0.20–0.43, associated with the reduction in precipitation during the vegetation period by 20% (PFD), 37% (CFD) and 52% (SFD). This suggests a drastic deterioration of vegetation regime. The differences between the 'wet' and 'dry' realizations in the projected sums of temperatures above 10ºC, precipitation and HTC (figure 6), indicate a significant contribution of natural climate variability to the uncertainty in agroclimatic indices.

Figure 6. Fifty-member ensemble mean sum of temperatures above 10 °C, precipitation (mm d−1) and hydrothermal coefficient for the warm period in 1990–1999 (a) and the two 'extreme' model projections (≪wet≫ and ≪dry≫) for 2050–2059 (b), (c). See figure 1 for the district identifiers.
Download figure:
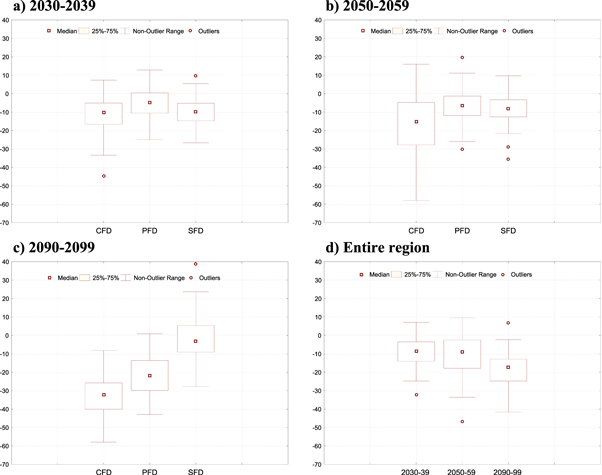
Standard image High-resolution imageYields in the Central Black-Earth region of CFD are expected to decrease by 11.7 ± 3.0% (2030–2039) and by 15.8 ± 5.1% (2050–2059) (table 2 and figure 7). By the end of the century, the yield of cereals is projected to reduce by the one third relative to the current level under the assumption that there no adaptation measures (to cope with negative changes in heat and moisture supply) are taken. The decrease in the productivity of spring wheat is projected for PFD to be −6.7 ± 3.0% by 2050–2059. This is a smaller decrease as compared to that expected in the Central Black-Earth region located mostly southward of Moscow (CFD). In the near term, a drop by 9.9 ± 2.3% in the spring wheat productivity is projected for SFD. By the end of the century, the expected change in the agrometeorological conditions of the growing season may cause a significant shift in the germination date to the beginning of the year. This is accompanied by an increase in temperature (0.6 °C) and precipitation (11%) (table 1). This will lead to an insignificant change in the productivity (2.6 ± 3.4%) in SFD.
Table 2. Fifty-member ensemble mean changes in the spring wheat productivity for different horizons in the XXI century and respective 95% confidence interval.
| Period | |||
|---|---|---|---|
| 2030–2039 | 2050–2059 | 2090–2099 | |
| Federal district | Change relative to 1990–1999, % | ||
| CFDa | −11.7 ± 3.0 | −15.8 ± 5.1 | −32.9 ± 3.4 |
| PFD | −5.7 ± 2.4 | −6.7 ± 3.0 | −21.5 ± 3.1 |
| SFD | −9.9 ± 2.3 | −8.2 ± 3.0 | −2.6 ± 3.4 |
| All | −9.1 ± 2.3 | −10.3 ± 3.2 | −18.9 ± 2.8 |
Figure 7. Box plots of the predicted changes (%) in the average spring wheat yield for 2030–2039 (a), 2050–2059 (b), 2090–2099 (c) in CFD, PFD and SFD and for the entire territory (d). Whiskers denote variance range of the district-level spring wheat yields.
Download figure:
Standard image High-resolution image
5. Summary
High-resolution regional projections of climate change impacts on agriculture indicate an intensification of unfavorable conditions for the cultivation of cereals across current main grain-producing regions of European Russia. The negative impacts are largely associated with the increase in aridity. By the mid-XXI century, the productivity of cereals is expected to decrease, especially in southern CFD and to a lesser extent in PFD which are the principal spring wheat districts. In the absence of adaptation measures, by the end of the century, the yield of spring wheat is projected to reduce by one third.
On the other hand, the vegetation season and temperature sums significantly increase. This allows for the use of late-ripening varieties in agriculture, which are usually more productive. Our numerical experiments accounting for an increase in the sums of effective temperatures during the periods of ripening-earing and earing-sprouting have shown that the use of mid-ripening and late-ripening varieties could lead to the yield increase by 15%. Efficient use of additional heat resources in future can be achieved through the introduction of more thermophilic crop varieties, as well as the cultivation of aftercrops (i.e. use of thermal resources remaining after harvesting the main crop). This will also lead to an increase in the productivity of both grain and forage crops under the current agrotechnical level of cultivation. A study carried out for Canada [32] concludes that under the projected climate changes, the area allocated to wheat will continue to decrease into the future by 2.7–4.6% in various soil zones. The study concludes that the choice of wheat is preferred over pulses, feed, and forages, while the choice of specialty oilseeds (flaxseed, mustard seed, and canary seed) is projected to become preferred over wheat in the future. Conducting a similar study for Russia would be a good start for an assessment accounting for the variety of climatic conditions across the vast territory of the country.
The uncertainty of the estimates obtained in this study is relatively high, mainly because of the high variability of precipitation during the warm season as compared to the anthropogenically induced changes. Multimodel ensembles along with a multiscenario approach should enhance the above assessment of the impacts and uncertainties particularly those associated with changes in water balance components across the regions where droughts are expected to be a more frequent occurrence in the future. High-resolution probabilistic climate projections, similar to that applied in this study, open the door to optimizing the management of the agricultural sector and developing sectoral adaptation strategies across the country at regional down to local levels.
Acknowledgments
The study is supported by the Russian Science Foundation (Grant 16-17-00063). We would also like to express gratitude to the two anonymous reviewers for their helpful comments and recommendations.