

Abstract
Agroforestry systems comprise trees and crops, or trees and pastures within the same field. Globally, they cover approximately 1 billion hectares of land and contribute to the livelihoods of over 900 million people. Agroforestry systems have the capacity to sequester large quantities of carbon (C) in both soil and biomass. However, these systems have not yet been fully considered in the approach to C accounting developed by the Intergovernmental Panel on Climate Change, largely due to the high diversity of agroforestry systems and scarcity of relevant data. Our literature review identified a total of 72 scientific, peer-reviewed articles associated with biomass C storage (50) and with soil organic carbon (SOC) (122), containing a total of 542 observations (324 and 218, respectively). Based on a synthesis of the reported observations, we are presenting a set of Tier 1 coefficients for biomass C storage for each of the eight main agroforestry systems identified, including alley cropping, fallows, hedgerows, multistrata, parklands, shaded perennial-crop, silvoarable and silvopastoral systems, disaggregated by climate and region. Using the same agroforestry classification, we are presenting a set of stock change factors (FLU) and SOC accumulation/loss rates for three main land use changes (LUCs): cropland to agroforestry; forest to agroforestry; and grassland to agroforestry. Globally, the mean SOC stock change factors (± confidence intervals) were estimated to be 1.25 ± 0.04, 0.89 ± 0.07, and 1.19 ± 0.10, for the three main LUCs, respectively. However, these average coefficients hide huge disparities across and within different climates, regions, and types of agroforestry systems, highlighting the necessity to adopt the more disaggregated coefficients provided herein. We encourage national governments to synthesize data from local field experiments to generate country-specific factors for more robust estimation of biomass and SOC storage.
Export citation and abstract BibTeX RIS

Original content from this work may be used under the terms of the Creative Commons Attribution 3.0 licence. Any further distribution of this work must maintain attribution to the author(s) and the title of the work, journal citation and DOI.
Introduction
According to FAO (2016), agriculture is still the main global driver of deforestation. More precisely, commercial agriculture is the main driver, followed by subsistence agriculture (Hosonuma et al 2012). Deforestation is the main source of anthropogenic greenhouse gases (GHGs) emissions from the Agriculture, Forestry and Other Land Use (AFOLU) sector. For the last decade (2007–2016), emissions from Land Use Change (LUC), including deforestation, are estimated at 1.3 ± 0.7 Gt C yr−1 (Le Quéré et al 2018). Meeting the world's increasing demand for food and other land-based products, without additional deforestation, will require productive landscapes that are managed sustainably (FAO 2009, 2016), accompanied by a modification of diets and a reduction of waste (Smith 2013, Smith et al 2013). Increasing the presence of multipurpose systems, such as agroforestry systems, is part of the solution (Paustian et al 2016).
Agroforestry systems are complex agro-ecosystems combining trees and crops, or trees and pastures, within the same field (Nair 1993). Agroforestry is a generic term that includes a wide variety of systems, varying by tree and crop species arrangements as a function of the climate zone and region, rendering the classification of agroforestry systems challenging (Nair 1985, Somarriba 1992, Torquebiau 2000). Agroforestry systems can build soil fertility, prevent soil erosion, enhance biodiversity and largely contribute to the resilience of farming systems through the provision of ecosystem services, such as the diverse set of tree products, such as fodder, fuelwood, food and building materials.
The benefit of agroforestry systems in terms of climate change regulation is widely recognized (Albrecht and Kandji 2003), with recent syntheses (Kumar and Nair 2011, Lorenz and Lal 2014) and meta-analyses (Chatterjee et al 2018, de Stefano and Jacobson 2018, Feliciano et al 2018, Shi et al 2018) reiterating their positive impact on SOC sequestration and global and national carbon C budgets (Zomer et al 2016). Agroforestry systems also have an important role to play in adaptation to climate change due to their contribution to enhanced water use, storage and efficiency, improved microclimate, and diversified income and food sources (Lasco et al 2014).
Despite the suite of socioeconomic and environmental benefits associated with agroforestry systems, they are not widely recognized as such within the scientific community and are only eligible for payment of ecosystem services, under the Clean and Development Mechanisms, if compliant with the definition of afforestation and reforestation activities (UNFCCC 2013, 2015). Indeed, the complexity of agroforestry systems renders the estimation of their impact on GHG fluxes challenging (Nair 2012). The capacity of soils and biomass in agroforestry systems to store C depends on several factors, including local pedoclimatic conditions, previous land-use, tree density and species, harvesting and pruning practices and management activities. In general, the transition from an agriculture system to an agroforestry system is beneficial to SOC, while the conversion of secondary or primary forests to agroforestry systems leads to SOC losses (de Stefano and Jacobson 2018, Feliciano et al 2018).
The IPCC Good Practice Guidance (Penman et al 2003) and National GHG Inventory Guidelines (NGHGI) (IPCC 2006) provide recommendations on methods and default estimates for assessing C stocks and emissions at three tiers of detail, ranging from Tier 1 (with average emission/stock change factors for large eco-regions of the world and globally-available data, simplest to use) up to Tier 3 (with high resolution methods specific for each country and repeated through time). According to IPCC (2006) Guidelines for NGHGIs, agroforestry systems are classified under the category 'perennial crops', which comprises gathered trees and shrubs, in combination with herbaceous crops (e.g. agroforestry) or orchards, vineyards and plantations such as cocoa, coffee, tea, oil palm, coconut, rubber trees, and bananas. As a result of insufficient data, agroforestry is classified as a perennial crop.
Under the IPCC 'perennial crops' category, a set of average sequestration rates per climate type are proposed. The aboveground biomass growth rate was estimated at 10 t C ha−1 yr−1 for tropical wet, 2.6 t C ha−1 yr−1 for tropical moist, 1.8 t C ha−1 yr−1 for tropical dry, and 2.1 t C ha−1 yr−1 for all temperate climates (IPCC 2006). A high level of uncertainty was attributed to these factors (standard error range of ±75% in all climates), which represent the coefficients to estimate aboveground biomass carbon storage across all perennial and agroforestry systems, regardless of their diversity. The same knowledge gap is also observed in the global biomass C map, where cultivated and managed lands are given a fixed biomass C value of 5 tC ha−1, with no distinction for agroforestry systems (Ruesch and Gibbs 2008). No coefficients have been proposed yet for SOC sequestration in agroforestry systems.
The objectives of the paper is to (i) propose more accurate Tier 1 emission factors for aboveground and belowground biomass C sequestration by climate and region for different agroforestry systems and (ii) propose response ratio (or management factors) and Tier 1 emission factors for SOC sequestration by LUC, climate and region for different agroforestry systems.
Materials and methods
Literature search and data extraction
We conducted a literature review of available studies that estimated SOC stocks (or the information necessary to calculate them, i.e. SOC content and bulk density), and/or biomass C stocks. The research process included use of several research engines and knowledge platforms, namely ISI—Web of Knowledge, Google Scholar, and Scopus. A key-word search was performed using the following keys: biomass OR soil AND ('carbon stock*' OR 'carbon pool*' OR 'carbon sequestration' OR 'carbon concentration') AND (agroforest* OR parkland* OR homegarden OR multistrata OR hedgerow OR windbreak OR shelterbelt OR 'live fence' OR 'tree intercrop*' OR silvo*arable OR silvo*pasture OR 'rotation* wood*' OR tree*fallow* OR (tree* AND 'improve* fallow*') OR (tree* AND relay*crop*) OR (tree* AND alley*crop*)).
Several parameters were deemed necessary for the data to be contained in the database, specifically: the previous land use, the depth of measurement and the time frame over which the LUC had occurred should be reported. In addition, studies also had to provide the location or climate data of the study sites in order to classify the data by climate regimes according to the IPCC guidelines (IPCC 2007). If the required data were not present in the text or in tables, data were extracted from graphs using the WebPlotDigitizer software. In the case that a study included multiple sites, they were treated as separate data points. In general, only data from primary sources were collected in the database. If data from a review of primary sources were included in the database, the data were only reported once.
As a result of this systematic literature review, we collected data from a collection of 50 peer reviewed studies that reported biomass C storage and 72 studies that reported SOC stock changes in agroforestry systems. In total, 324 and 218 observations were obtained for biomass and SOC storage, respectively. The full database is available in appendix 1 and 2, available online at stacks.iop.org/ERL/13/124020/mmedia.
Changes in SOC stocks
In general, the majority of selected publications reported SOC stock and only a few used the equivalent soil mass approach. In the case that the SOC concentration and bulk density were reported, the SOC stock was calculated. Only six publications did not report bulk densities, which were estimated using the mean bulk density per soil type as proposed by Batjes (1996).
In the case that both a synchronic (SOC stocks measured in the agroforestry and in an adjacent control plot) and diachronic (SOC stocks measured in the same plot before and after LUC) approaches were presented for the same site, the priority was given to the diachronic approach as the one most widely considered among the scientific literature as reliable (Costa Junior et al 2013). In the case that SOC stocks were presented at different periods of time, only one date was identified in order to avoid dependency of observations and priority was given to the most recent measurements as SOC stock changes are usually not detected during the first several years due to measurement uncertainties (Smith 2004). In the case that SOC stocks were measured at different depths, only the value measured at 0–30 cm was taken into account. If stocks were only measured at 0–20 and 0–40 cm, the deepest depth (0–40 cm) was considered because it included the ploughed horizon and most tree and crop roots. If only one depth was available but did not correspond to 0–30 cm, the observations was still considered.

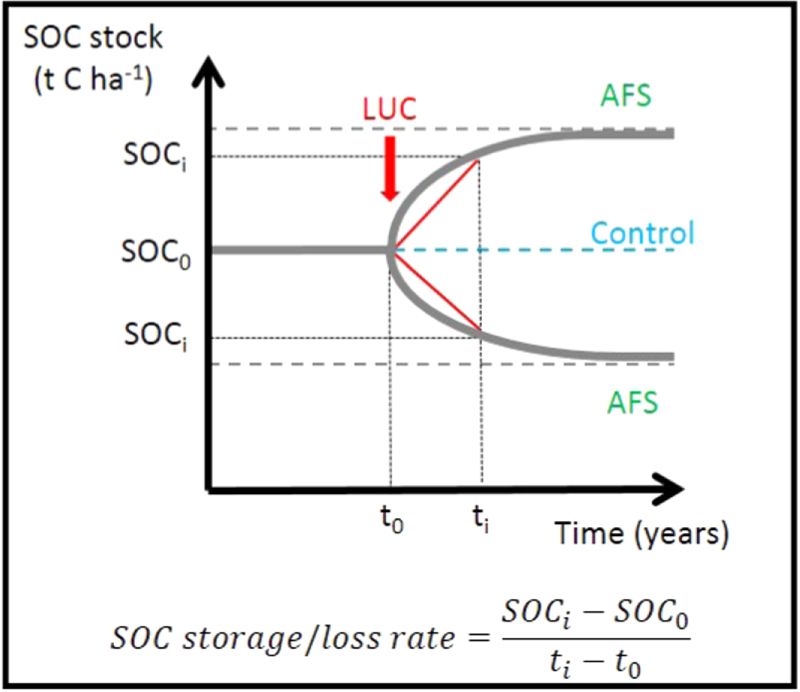
Figure 1. Calculation of SOC storage/loss rates for the different land use changes (LUC). The different Land Use Changes were: Cropland to Agroforestry, Control = Cropland (N = 158); Forest to Agroforestry, Control = Forest (N = 29); Grassland to Agroforestry, Control = Grassland (N = 28); Plantation to Agroforestry, Control = Plantation (N = 3). AFS: Agroforestry systems.
Download figure:
Standard image High-resolution imageTwo different methods were applied to calculate SOC storage or loss rates (figure 1). The first one (equation (1)), used by the IPCC (2006) for the Tier 1 method, is a stock change factor (FLU, dimensionless). It indicates a relative change in SOC stocks in the new land use compared to the previous one. It is also called a response ratio (Ogle et al 2004, 2005), or management factor (Maia et al 2013). FLU higher than 1 correspond to a SOC storage, while FLU lower than 1 correspond to a SOC loss.

The second method (equation (2)) was used to estimate absolute changes in SOC stocks. SOC storage/loss rates (t C ha−1 yr−1) were then calculated using the following formula (figure 2):

where SOC stocks are expressed in t C ha−1, and the age corresponded to the agroforestry age in years.

Figure 2. Sites of published studies on SOC (circles) and biomass (triangles) storage in various agroforestry systems. A few studies reported both SOC and biomass (squares). See footnotes of tables 2 and 3 for the full list of publications.
Download figure:
Standard image High-resolution imageAnnual biomass increment
If only biomass was reported in a study, the carbon fraction (CF) of dry matter of 0.47 was applied to convert it into a carbon stock (IPCC 2006).
The root:shoot ratio (R) is defined as the ratio of belowground biomass to aboveground biomass and is the primary method used by nations to estimate below ground biomass and C stocks for NGHGIs (Mokany et al 2006). In the case that the root:shoot ratio was not empirically-derived, default estimates for perennial woody vegetation recommended by IPCC (2006) were used for each climatic zone: 0.27 in Boreal, 0.26 in Temperate, and 0.24 in Tropical (Cairns et al 1997).
Agroforestry classification
The different types of agroforestry systems considered in this manuscript are presented in table 1. This classification is adapted from Nair et al (2009) where the same term 'alley cropping' was used for very different agroforestry systems in tropical and temperate regions. In this study, we make a distinction between tropical alley cropping, which involve dense alleys of fast-growing, usually leguminous woody species, and temperate silvoarable systems, which contain a low numbers of trees, usually for timber, in rows spaced widely enough to allow for mechanization (table 1).
Table 1. Description of major agroforestry types (adapted from Nair et al (2009).
| Type of agroforestry system | Definition |
|---|---|
| Alley cropping | Fast-growing, usually leguminous, woody species (mainly shrubs) grown in crop fields, usually at high densities. The woody species are regularly pruned and the prunings are applied as mulch into the alleys as a source of organic matter and nutrients. Usually found in tropical regions. Sometimes referred as 'intercropping systems'. |
| Fallows | Only sequential agroforestry system considered here. Include both improved and natural fallows. |
| Hedgerows | They consist of linear plantation around the fields. They include also shelterbelts, windbreaks and live fences. |
| Multistrata systems | Multistorey combinations of a large number of various trees at high density, and perennial and annual crops. They include home gardens and agroforests. |
| Parklands | Intercropping of agricultural crops or grazing land under low density mature scattered trees. Typical of dry areas like Sahel (e.g. Faidherbia albida). |
| Shaded perennial-crop systems | Growing shade-tolerant species such as cacao and coffee under, or in between, overstorey shade trees that can be used for timber or other commercial tree products. |
| Silvoarable systems | Woody species planted in parallel tree rows to allow mechanization and intercropped with an annual crop; usually used for timber (e.g. Juglans spp), but also for fuel (e.g. Populus spp). Usually low tree density per hectare. Usually found in temperate regions, but not exclusively. |
| Silvopastures | Woody species planted on permanent grasslands, often grazed. |
Data analysis
Four main land conversions were studied for SOC storage/loss, cropland to agroforestry, forest to agroforestry, grassland to agroforestry, and plantation to agroforestry. Four publications also reported conversion from abandoned cropland to agroforestry (Diels et al 2004, Swamy and Puri 2005, Baumert et al 2016, Bright et al 2017). These abandoned croplands are defined as former long-term croplands uncropped (natural fallow) a couple of years before the establishment of the agroforestry system. Due to insufficient data, they were included in the category 'cropland to agroforestry'. The effect of the previous land use on annual biomass increment rates was considered negligible (IPCC 2006).
All the graphs and statistical analyses were performed using R software version 3.1.1 (R Development Core Team 2013), at a significance level of <0.05.
Results
Data on SOC stocks were collected in 31 countries, plus 4 US states, 4 Canadian provinces and in one French overseas department (figure 2, appendix 1). Data on aboveground biomass were obtained from 33 different countries, plus 1 US state, and 3 Canadian provinces (figure 2, appendix 2).
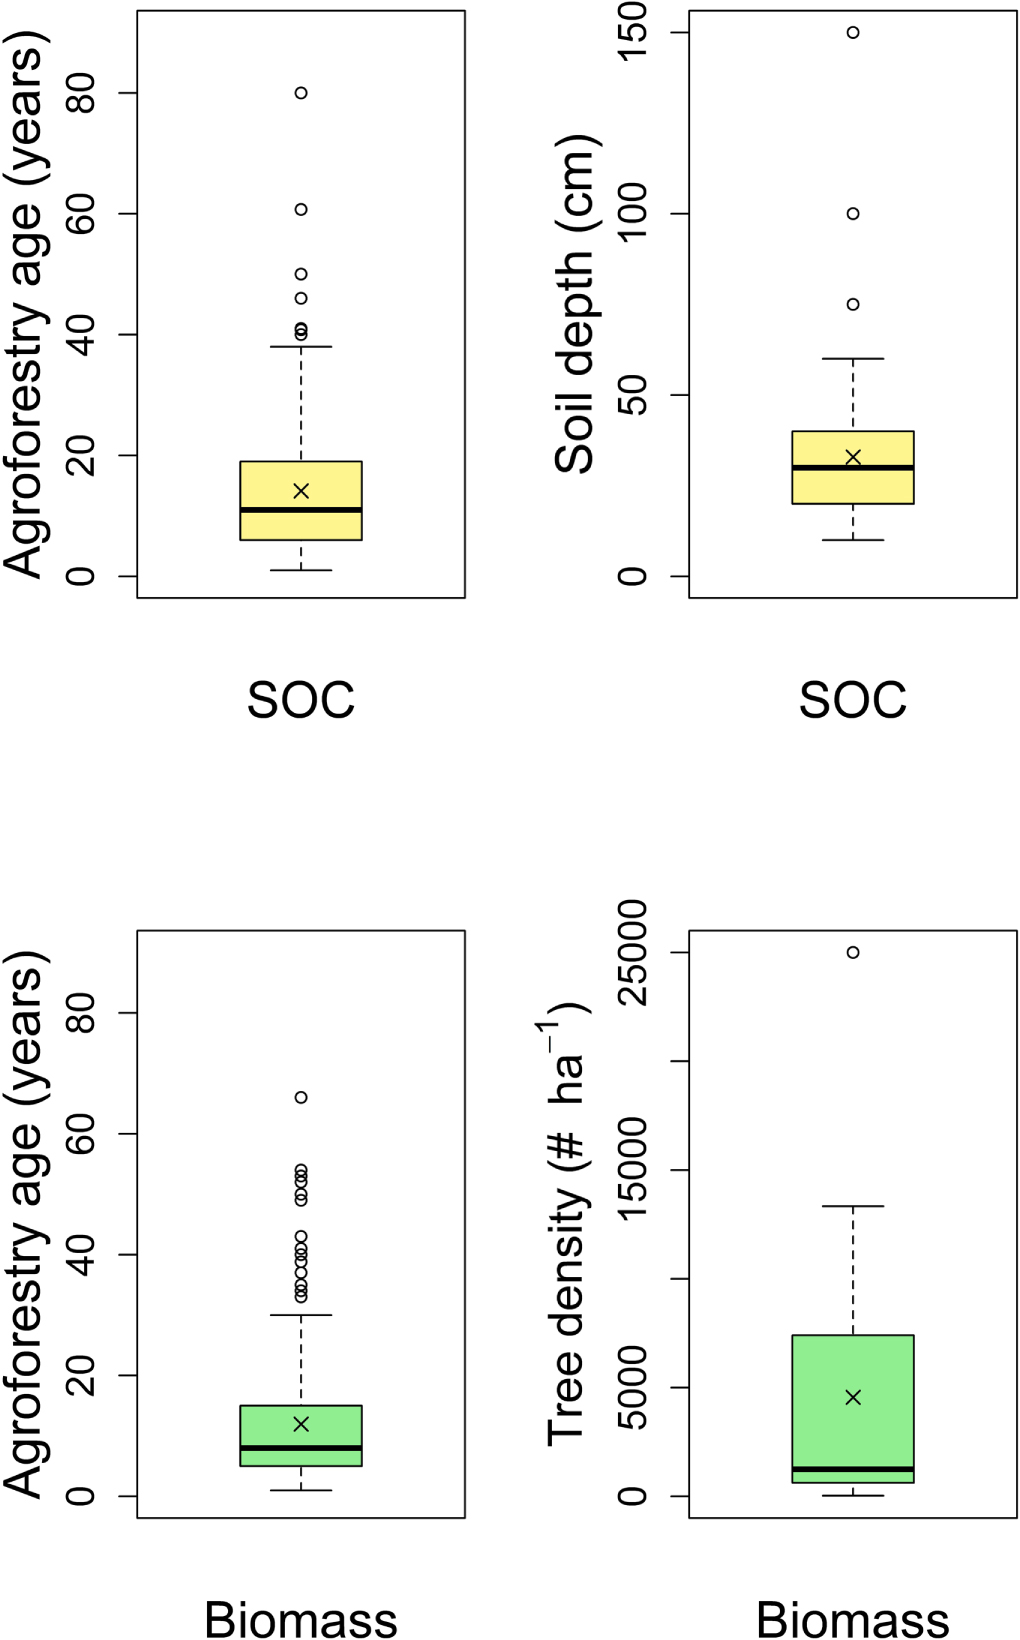
In the SOC database, the median and mean age of the agroforestry systems were 11.0 and 14.1 years, respectively, while the median and mean soil depth were 30.0 and 32.9 cm (figure 3). In the biomass database, the median and mean age of the agroforestry systems were 8.0 and 12.0 years, respectively, while the median and mean tree density were 1250 and 4533 trees ha−1 (figure 3).

Figure 3. Distribution of site ages (years) and soil depth (cm) in the SOC and biomass databases. Upper and lower edges of boxes indicate 75th and 25th percentiles, horizontal lines within boxes indicate median, whiskers below and above the boxes indicate the 10th and 90th percentiles, and crosses indicate means. Outliers are plotted as individual points.
Download figure:
Standard image High-resolution imageThe mean SOC storage rate (± confidence intervals) for croplands converted to agroforestry systems was 0.75 ± 0.19 t C ha−1 yr−1, while the mean SOC loss rate for forests converted to agroforestry systems was −1.15 ± 1.02 t C ha−1 yr−1, all regions, climates, and agroforestry systems taken together (figure 4). Mean SOC change rates for the conversion from grasslands to agroforestry systems was not significantly different from zero (0.23 ± 0.25 t C ha−1 yr−1). The mean stock change factors (± confidence intervals) were 1.25 ± 0.04, 0.89 ± 0.07, 1.19 ± 0.10, for croplands converted to agroforestry, forests to agroforestry, and grassland to agroforestry, respectively (figure 4).

Figure 4. Soil organic carbon (SOC) storage/loss rates and stock change factors (FLU) for different land uses converted to agroforestry systems. AFS: AgroForestry Systems. All climates and types of agroforestry systems are mixed in this graph. Upper and lower edges of boxes indicate 75th and 25th percentiles, horizontal lines within boxes indicate median, whiskers below and above the boxes indicate the 10th and 90th percentiles, and crosses indicate mean SOC storage rate per type of subsystem. Outliers are plotted as individual points. *represents SOC storage rates significantly different from 0 (P ≤ 0.05).
Download figure:
Standard image High-resolution image
The response ratio (FLU) and SOC storage/loss rates for different land use conversions to agroforestry systems are presented per climate type and region in table 2. Aboveground biomass sequestration rates are presented in table 3.
Table 2. Response ratio (FLU) and SOC storage/loss rates per climate type and region for different land use conversions to agroforestry systems. SOC storage rates for hedgerows are presented per kilometer of hedgerows, not per hectare of agricultural field. The tree density represents total tree density of the agroforestry system, including perennial crops (coffee, cacao) in the case of shaded perennial and multistrata systems. For hedgerows, tree density is presented per kilometer of hedgerows. N: number of observations; SD: standard deviation; CI: confidence interval; Min: minimum observed SOC storage rate; Max: maximum observed SOC storage rate. Ab. Cropland: Abandoned Cropland (former cropland uncultivated (natural fallow) for a couple of years before conversion to agroforestry).
| Climate | Tree density | Response ratio (FLU) | SOC storage/loss rate | ||||||||
|---|---|---|---|---|---|---|---|---|---|---|---|
| (# ha−1) | (tC ha−1 yr−1) | ||||||||||
| Region | Land use change | N | Mean ± SD | Mean ± SD | 95% CI | Min | Max | Mean ± SD | 95% CI | Min | Max |
| Cool temperate (n = 35) | |||||||||||
| Asia | Cropland to Silvoarable | 2 | 833 ± 0 | 1.05 ± 0.11 | — | 0.97 | 1.12 | 0.24 ± 0.49 | — | −0.11 | 0.59 |
| Europe | Cropland to Hedgerow | 4 | 125 ± 0 | 1.41 ± 0.20 | 0.19 | 1.22 | 1.65 | 0.68 ± 0.34 | 0.36 | 0.26 | 0.99 |
| Cropland to Silvoarable | 1 | 99 | 1.05 | — | — | — | 0.51 | — | — | — | |
| Grassland to Silvopasture | 5 | 260 ± 134 | 1.08 ± 0.14 | 0.13 | 0.92 | 1.28 | 0.19 ± 0.41 | 0.18 | −0.27 | 0.76 | |
| North America | Cropland to Hedgerow | 6 | 546 ± 373 | 1.24 ± 0.10 | 0.08 | 1.15 | 1.41 | 0.67 ± 0.23 | 0.18 | 0.37 | 1.02 |
| Cropland to Silvoarable | 16 | 231 ± 149 | 1.08 ± 0.22 | 0.11 | 0.76 | 1.77 | 0.19 ± 1.54 | 0.75 | −3.07 | 4.20 | |
| South America | Grassland to Silvopasture | 1 | 400 | 1.09 | — | — | — | 0.93 | — | — | — |
| All regions | Cropland to Hedgerow | 10 | 406 ± 363 | 1.30 ± 0.16 | 0.10 | 1.15 | 1.65 | 0.67 ± 0.26 | 10 | 0.26 | 1.02 |
| Cropland to Silvoarable | 19 | 287 ± 238 | 1.08 ± 0.20 | 0.09 | 0.76 | 0.77 | 0.21 ± 1.41 | 0.63 | −3.07 | 4.20 | |
| Grassland to Silvopasture | 6 | 283 ± 133 | 1.08 ± 0.13 | 0.10 | 0.92 | 1.28 | 0.31 ± 0.48 | 0.38 | −0.27 | 0.93 | |
| Warm temperate (n = 32) | |||||||||||
| Asia | Cropland to Silvoarable | 7 | 333 ± 121 | 1.40 ± 0.22 | 0.16 | 1.02 | 1.68 | 1.33 ± 1.47 | 1.09 | 0.14 | 3.80 |
| Europe | Cropland to Hedgerow | 8 | 125 ± 0 | 1.11 ± 0.22 | 0.94 | 1.62 | 0.15 ± 0.23 | 0.16 | −0.14 | 0.51 | |
| Cropland to Silvoarable | 6 | 88 ± 50 | 1.12 ± 0.17 | 0.13 | 1.01 | 1.45 | 0.28 ± 0.16 | 0.13 | 0.10 | 0.46 | |
| Cropland to Silvopasture | 4 | 1667 ± 962 | 1.17 ± 0.13 | 0.13 | 1.03 | 1.35 | 1.93 ± 1.54 | 1.51 | 0.38 | 4.05 | |
| Grassland to Silvopasture | 2 | 35 | 1.03 ± 0.16 | 0.22 | 0.92 | 1.14 | −0.34 ± 0.54 | — | −0.72 | 0.05 | |
| North America | Cropland to Hedgerow | 3 | 1111 | 1.16 ± 0.14 | 0.16 | 1.05 | 1.32 | 0.52 ± 0.72 | 0.81 | 0.10 | 1.35 |
| Grassland to Hedgerow | 1 | 1333 | 1.14 | — | — | — | 0.68 | — | — | — | |
| Grassland to Silvopasture | 1 | 571 | 0.94 | — | — | — | −0.60 | — | — | — | |
| All regions | Cropland to Hedgerow | 11 | 235 ± 329 | 1.13 ± 0.19 | 0.11 | 0.94 | 1.62 | 0.25 ± 0.41 | 0.24 | −0.14 | 1.35 |
| Cropland to Silvoarable | 13 | 220 ± 156 | 1.27 ± 0.24 | 0.13 | 1.01 | 1.68 | 0.85 ± 1.18 | 0.64 | 0.10 | 3.80 | |
| Cropland to Silvopasture | 4 | 1667 ± 962 | 1.17 ± 0.13 | 0.13 | 1.03 | 1.35 | 1.93 ± 1.54 | 1.51 | 0.38 | 4.05 | |
| Grassland to Hedgerow | 1 | 1333 | 1.14 | — | — | — | 0.68 | — | — | — | |
| Grassland to Silvopasture | 3 | 303 ± 379 | 1.00 ± 0.12 | 0.14 | 0.92 | 1.14 | −0.42 ± 0.41 | 0.47 | −0.72 | 0.05 | |
| Temperate (all) (n = 67) | |||||||||||
| Cropland to Hedgerow | 21 | 320± 347 | 1.21 ± 0.20 | 0.08 | 0.94 | 1.65 | 0.45 ± 0.40 | 0.17 | −0.14 | 1.35 | |
| Cropland to Silvoarable | 32 | 260 ± 208 | 1.16 ± 0.23 | 0.08 | 0.76 | 1.77 | 0.47 ± 1.34 | 0.46 | −3.07 | 4.20 | |
| Cropland to Silvopasture | 4 | 1667 ± 962 | 1.17 ± 0.13 | 0.13 | 1.03 | 1.35 | 1.93 ± 1.54 | 1.51 | 0.38 | 4.05 | |
| Grassland to Hedgerow | 1 | 1333 | 1.14 | — | — | — | 0.68 | — | — | — | |
| Grassland to Silvopasture | 9 | 288 ± 182 | 1.05 ± 0.13 | 0.08 | 0.92 | 1.28 | 0.07 ± 0.57 | 0.37 | −0.72 | 0.93 | |
| Tropical dry (n = 68) | |||||||||||
| Africa | Cropland to Alley cropping | 6 | 2999 ± 3107 | 1.63 ± 0.15 | 0.12 | 1.36 | 1.83 | 0.49 ± 0.49 | 0.39 | 0.16 | 1.14 |
| Cropland to Fallow | 19 | 10 000 ± 0 | 1.40 ± 0.24 | 0.11 | 1.04 | 1.97 | 0.99 ± 0.59 | 0.27 | 0.11 | 2.52 | |
| Cropland to Silvoarable | 10 | 726 ± 436 | 1.06 ± 0.14 | 0.09 | 0.81 | 1.28 | 0.36 ± 1.57 | 0.98 | −2.41 | 3.89 | |
| Grassland to Parkland | 5 | 198 ± 78 | 1.15 ± 0.18 | 0.16 | 0.98 | 1.44 | 0.07 ± 0.08 | 0.07 | −0.03 | 0.19 | |
| Asia | Cropland to Silvoarable | 22 | 518 ± 233 | 1.23 ± 0.22 | 0.09 | 0.96 | 1.80 | 0.92 ± 1.48 | 0.62 | −0.08 | 6.10 |
| Grassland to Silvopasture | 4 | 278 ± 0 | 1.44 ± 0.18 | 0.18 | 1.30 | 1.70 | 0.48 ± 0.16 | 0.16 | 0.33 | 0.69 | |
| South America | Forest to Alley cropping | 1 | 200 | 0.67 | — | — | — | −4.91 | — | — | — |
| Forest to Silvopasture | 1 | 260 | 0.93 | — | — | — | −1.00 | — | — | — | |
| All regions | Cropland to Alley cropping | 6 | 2999 ± 3107 | 1.63 ± 0.15 | 0.12 | 1.36 | 1.83 | 0.49 ± 0.49 | 0.39 | 0.16 | 1.14 |
| Cropland to Fallow | 19 | 10 000 ± 0 | 1.40 ± 0.24 | 0.11 | 1.04 | 1.97 | 0.99 ± 0.59 | 0.27 | 0.11 | 2.52 | |
| Cropland to Silvoarable | 32 | 589 ± 326 | 1.17 ± 0.21 | 0.07 | 0.81 | 1.80 | 0.74 ± 1.51 | 0.52 | −2.41 | 6.10 | |
| Forest to Alley cropping | 1 | 200 | 0.67 | — | — | — | −4.91 | — | — | — | |
| Forest to Silvopasture | 1 | 260 | 0.93 | — | — | — | −1.00 | — | — | — | |
| Grassland to Parkland | 5 | 198 ± 78 | 1.15 ± 0.18 | 0.16 | 0.98 | 1.44 | 0.07 ± 0.08 | 0.07 | −0.03 | 0.19 | |
| Grassland to Silvopasture | 4 | 278 ± 0 | 1.44 ± 0.18 | 0.18 | 1.30 | 1.70 | 0.48 ± 0.16 | 0.16 | 0.33 | 0.69 | |
| Tropical moist (n = 47) | |||||||||||
| Africa | Cropland to Alley cropping | 12 | 8148 ± 2735 | 1.25 ± 0.23 | 0.13 | 0.98 | 1.65 | 0.21 ± 0.12 | 0.07 | −0.04 | 0.34 |
| Forest to Shaded Perennial | 2 | 1397 ± 73 | 1.09 ± 0.19 | — | 0.95 | 1.22 | 0.07 ± 0.25 | — | −0.11 | 0.24 | |
| Asia | Cropland to Alley cropping | 4 | 4000 ± 0 | 1.47 ± 0.17 | 0.17 | 1.28 | 1.67 | 1.92 ± 0.74 | 0.73 | 1.12 | 2.78 |
| Cropland to Fallow | 3 | — | 1.13 ± 0.16 | 0.18 | 0.96 | 1.27 | 0.75 ± 1.31 | 1.48 | −0.75 | 1.68 | |
| Cropland to Hedgerow | 2 | 40 000 ± 0 | 1.17 ± 0.09 | — | 1.10 | 1.23 | 0.60 ± 0.33 | — | 0.37 | 0.83 | |
| Cropland to Silvoarable | 1/2 | 859 ± 357 | 1.08 | — | — | — | 1.32 ± 1.27 | — | 0.42 | 2.21 | |
| Central America | Cropland to Fallow | 2 | 998 ± 85 | 1.00 ± 0.14 | — | 0.90 | 1.10 | −0.60 ± 1.51 | — | −1.67 | 0.47 |
| Cropland to Silvoarable | 1 | 425 | 1.19 | — | — | — | 2.91 | — | — | — | |
| Grassland to Silvopasture | 3 | 12 000 ± 0 | 1.25 ± 0.32 | 0.36 | 0.91 | 1.54 | 0.97 ± 1.32 | 1.49 | −0.44 | 2.17 | |
| North America | Grassland to Silvopasture | 4 | — | 1.33 ± 0.50 | 0.49 | 0.98 | 2.07 | 0.19 ± 0.31 | 0.30 | −0.02 | 0.64 |
| South America | Cropland to Alley cropping | 1 | — | 1.09 | — | — | — | 1.01 | — | — | — |
| Cropland to Multistrata | 2 | — | 2.24 ± 0.06 | — | 2.19 | 2.28 | 3.14 ± 0.95 | — | 2.47 | 3.81 | |
| Forest to Shaded Perennial | 6 | 1220 ± 444 | 1.07 ± 0.17 | 0.14 | 0.87 | 1.24 | 1.60 ± 2.65 | 2.12 | −0.34 | 6.55 | |
| Forest to Silvopasture | 2 | 250 ± 0 | 1.01 ± 0.04 | — | 0.98 | 1.03 | 1.30 ± 2.45 | — | −0.43 | 3.03 | |
| Grassland to Shaded Perennial | 1 | 1233 | 0.95 | — | — | — | −1.56 | — | — | — | |
| All regions | Cropland to Alley cropping | 17 | 16 111 ± 14 436 | 1.29 ± 0.23 | 0.11 | 0.98 | 1.67 | 0.79 ± 0.91 | 0.49 | −0.04 | 2.78 |
| Cropland to Fallow | 5 | 998 ± 85 | 1.08 ± 0.15 | 0.13 | 0.90 | 1.27 | 0.21 ± 1.40 | 1.23 | −1.67 | 1.68 | |
| Cropland to Hedgerow | 2 | 4000 ± 0 | 1.17 ± 0.09 | — | 1.10 | 1.23 | 0.60 ± 0.33 | — | 0.37 | 0.83 | |
| Cropland to Multistrata | 2 | — | 2.24 ± 0.06 | — | 2.19 | 2.28 | 3.14 ± 0.95 | — | 2.47 | 3.81 | |
| Cropland to Silvoarable | 2/3 | 714 ± 356 | 1.14 ± 0.08 | 0.09 | 1.08 | 1.19 | 1.85 ± 1.28 | 1.45 | 0.42 | 2.91 | |
| Forest to Shaded Perennial | 8 | 1264 ± 385 | 1.07 ± 0.16 | 0.11 | 0.87 | 1.24 | 1.21 ± 2.35 | 1.63 | −0.34 | 6.55 | |
| Forest to Silvopasture | 2 | 250 ± 0 | 1.01 ± 0.04 | — | 0.98 | 1.03 | 1.30 ± 2.45 | — | −0.43 | 3.03 | |
| Grassland to Shaded Perennial | 1 | 1233 | 0.95 | — | — | — | −1.56 | — | — | — | |
| Grassland to Silvopasture | 7 | 12 000 ± 0 | 1.29 ± 0.40 | 0.91 | 2.07 | 0.52 ± 0.89 | 0.66 | −0.44 | 2.17 | ||
| Tropical montane (n = 20) | |||||||||||
| Africa | Cropland to Fallow | 0/2 | — | — | — | — | — | 0.39 ± 0.02 | — | 0.37 | 0.40 |
| Cropland to Multistrata | 8 | — | 1.35 ± 0.41 | 0.28 | 0.95 | 2.20 | 1.21 ± 1.04 | 0.72 | −0.17 | 2.77 | |
| Forest to Parkland | 10 | 5 ± 0 | 0.74 ± 0.08 | 0.05 | 0.65 | 0.89 | −3.67 ± 2.09 | 1.29 | −6.42 | −0.88 | |
| Tropical wet (n = 16) | |||||||||||
| Africa | Forest to Shaded Perennial | 1 | 1477 | 0.99 | −0.01 | — | — | — | |||
| Asia | Forest to Shaded Perennial | 2 | — | 0.76 ± 0.14 | 0.20 | 0.66 | 0.86 | −1.23 ± 0.71 | — | −1.73 | −0.72 |
| Central America | Cropland to Alley cropping | 5 | 2222 ± 1521 | 1.19 ± 0.15 | 0.14 | 1.04 | 1.38 | 0.90 ± 0.86 | 0.77 | 0.26 | 2.34 |
| Forest to Multistrata | 1 | — | 1.00 | — | — | — | 0.00 | — | — | — | |
| Forest to Shaded Perennial | 1 | 10 102 | 0.85 | — | — | — | −0.17 | — | — | — | |
| Grassland to Hedgerow | 1 | 1110 | 1.11 | — | — | — | 0.80 | — | — | — | |
| Plantation to Shaded Perennial | 3 | 1019 ± 641 | 1.07 ± 0.06 | 0.07 | 1.01 | 1.13 | 0.61 ± 0.52 | 0.59 | 0.13 | 1.17 | |
| South America | Forest to Multistrata | 1 | 577 | 0.96 | — | — | — | −0.26 | — | — | — |
| Forest to Silvoarable | 1 | — | 0.95 | — | — | — | −0.26 | — | — | — | |
| All regions | Cropland to Alley cropping | 5 | 2222 ± 1521 | 1.19 ± 0.15 | 0.14 | 1.04 | 1.38 | 0.90 ± 0.86 | 0.77 | 0.26 | 2.34 |
| Forest to Multistrata | 2 | 577 | 0.98 ± 0.03 | 0.04 | 0.96 | 1.00 | −0.13 ± 0.18 | — | −0.26 | 0.00 | |
| Forest to Shaded Perennial | 4 | 5790 ± 6099 | 0.84 ± 0.14 | 0.13 | 0.66 | 0.99 | −0.66 ± 0.77 | 0.76 | −1.73 | −0.01 | |
| Forest to Silvoarable | 1 | — | 0.95 | — | — | — | −0.26 | — | — | — | |
| Grassland to Hedgerow | 1 | 1110 | 1.11 | — | — | — | 0.80 | — | — | — | |
| Plantation to Shaded Perennial | 3 | 1019 ± 641 | 1.07 ± 0.06 | 0.07 | 1.01 | 1.13 | 0.61 ± 0.52 | 0.59 | 0.13 | 1.17 | |
| Tropical (all) (n = 151) | |||||||||||
| Cropland to Alley cropping | 28 | 10 625 ± 12 960 | 1.35 ± 0.25 | 0.09 | 0.98 | 1.83 | 0.67 ± 0.75 | 0.28 | −0.04 | 2.78 | |
| Cropland to Fallow | 24/26 | 8875 ± 3075 | 1.34 ± 0.26 | 0.10 | 0.90 | 1.97 | 0.79 ± 0.83 | 0.32 | −1.67 | 2.52 | |
| Cropland to Hedgerow | 2 | 4000 ± 0 | 1.17 ± 0.09 | — | 1.10 | 1.23 | 0.60 ± 0.33 | — | 0.37 | 0.83 | |
| Cropland to Multistrata | 10 | — | 1.53 ± 0.52 | 0.32 | 0.95 | 2.28 | 1.59 ± 1.27 | 0.79 | −0.17 | 3.81 | |
| Cropland to Silvoarable | 34/35 | 601 ± 325 | 1.17 ± 0.21 | 0.07 | 0.81 | 1.80 | 0.84 ± 1.50 | 0.50 | −2.41 | 6.10 | |
| Forest to Alley cropping | 1 | 200 | 0.67 | — | — | — | −4.91 | — | — | — | |
| Forest to Multistrata | 2 | 577 | 0.98 ± 0.03 | 0.04 | 0.96 | 1.00 | −0.13 ± 0.18 | — | −0.26 | 0.00 | |
| Forest to Parkland | 5 | 5 ± 0 | 0.74 ± 0.08 | 0.07 | 0.65 | 0.84 | −2.64 ± 1.94 | 1.70 | −5.58 | −0.88 | |
| Forest to Shaded Perennial | 12 | 2169 ± 2809 | 1.00 ± 0.19 | 0.66 | 1.24 | 0.59 ± 2.13 | 1.20 | −1.73 | 6.55 | ||
| Forest to Silvoarable | 1 | — | 0.95 | — | — | — | −0.26 | — | — | — | |
| Forest to Silvopasture | 3 | 253 ± 6 | 0.98 ± 0.05 | 0.06 | 0.93 | 1.03 | 0.53 ± 2.18 | 2.47 | −1.00 | 3.03 | |
| Grassland to Hedgerow | 1 | 1110 | 1.11 | — | — | — | 0.80 | — | — | — | |
| Grassland to Parkland | 5 | 198 ± 78 | 1.15 ± 0.18 | 0.16 | 0.98 | 1.44 | 0.07 ± 0.08 | 0.07 | −0.03 | 0.19 | |
| Grassland to Shaded Perennial | 1 | 1233 | 0.95 | — | — | — | −1.56 | — | — | — | |
| Grassland to Silvopasture | 11 | 4185 ± 6053 | 1.34 ± 0.33 | 0.20 | 0.91 | 2.07 | 0.50 ± 0.70 | 0.41 | −0.44 | 2.17 | |
| Plantation to Shaded Perennial | 3 | 1019 ± 641 | 1.07 ± 0.06 | 0.07 | 1.01 | 1.13 | 0.61 ± 0.52 | 0.59 | 0.13 | 1.17 | |
a. Based on information from the following studies:1)Land Use Change = Cropland to Agroforestry; Control = Cropland Adhikary et al (2017), Bambrick et al (2010), Baumert et al (2016), Benbi et al (2012), Bertalot et al (2014), Bright et al (2017), Cardinael et al (2015a), Cardinael et al (2017), Chander et al (1998), Chauhan et al (2010), de Lima et al (2011), Dhillon & Van Rees (2017), Diels et al (2004), Fernández-Núñez et al (2010), Gupta et al (2009), Kang et al (1999), Kaonga & Coleman (2008), Kaur et al (2000), Kimaro et al (2011), Lasco & Suson (1999), Lenka et al (2012), Lu et al (2015), Maikhuri et al (2000), Makumba et al (2007), Mao et al (2012), Mazzarino et al (1993), Oelbermann et al (2004), Oelbermann et al (2006), Pardon et al (2017), Peichl et al (2006), Raddad et al (2006), Ramesh et al (2015), Rimhanen et al (2016), Sauer et al (2007), Seitz et al (2017), Singh & Gill (2014) Soto-Pinto et al (2010), Swamy & Puri (2005), Thiel et al (2015), Upson & Burgess (2013), Verchot et al (2011), Wang et al (2015), Wiesmeier et al (2018), Winans et al (2014), Winans et al (2016), Wotherspoon et al (2014). 2)Land Use Change = Forest to Agroforestry; Control = Forest Alegre & Rao (1996), Demessie et al (2013), Gama-Rodrigues et al (2010), Hertel et al (2009), Kirby & Potvin (2007), Maia et al (2007), Monroe et al (2016), Nijmeijer et al (2018), Norgrove & Hauser (2013), Schmitt-Harsh et al (2012), Schroth et al (2002), Singh et al (2010), Tonucci et al (2011) .3)Land Use Change = Grassland to Agroforestry; Control = Grassland Abaker et al (2016), Beckert et al (2016), Cardinael et al (2017), Dube et al (2012), Fornara et al (2018), Haile et al (2008), Howlett et al (2011a), Mangalassery et al (2014), Monroe et al (2016), Paudel et al (2012), Sharrow & Ismail (2004), Sierra & Nygren (2005), Soto-Pinto et al (2010), Upson et al (2016), Villanueva-López et al (2015) .4)Land Use Change = Plantation to Agroforestry; Control = Plantation Beer et al (1990), Hergoualc'h et al (2012).
Table 3. Aboveground and belowground biomass increment rates for different agroforestry systems per climate type and regions. Biomass storage rates and tree density for hedgerows are presented per kilometer of hedgerows, not per hectare of agricultural field. The tree density represents total tree density of the agroforestry system, including perennial crops (coffee, cacao) in the case of shaded perennial and multistrata systems. N: number of observations; ABG: aboveground; BLG: belowground; SD: standard deviation; CI: confidence interval; min: minimum observed SOC storage rate; Max: maximum observed SOC storage rate.
| Climate region | Agroforestry system | N | Tree density (# ha−1) | ABG biomass storage rate (tC ha−1 yr−1) | BLG biomass storage rate (tC ha−1 yr−1) | ||||||
|---|---|---|---|---|---|---|---|---|---|---|---|
| Mean ± SD | Mean ± SD | 95% CI | Min | Max | Mean ± SD | 95% CI | Min | Max | |||
| Cool temperate (n = 27) | |||||||||||
| Asia | Silvoarable | 2 | 833 ± 0 | 2.97 ± 0.02 | — | 2.96 | 2.98 | 0.77 ± 0.00 | — | 0.77 | 0.78 |
| Europe | Silvopasture | 4 | 225 ± 126 | 2.17 ± 1.05 | 1.03 | 1.12 | 3.17 | 0.56 ± 0.28 | 0.27 | 0.29 | 0.83 |
| North America | Hedgerow | 12 | 816 ± 853 | 0.87 ± 0.75 | 0.42 | 0.31 | 3.15 | 0.23 ± 0.19 | 0.11 | 0.08 | 0.82 |
| Silvoarable | 7 | 111 ± 0 | 0.59 ± 0.23 | 0.17 | 0.40 | 0.99 | 0.14 ± 0.04 | 0.03 | 0.09 | 0.22 | |
| Silvopasture | 1 | 571 | 0.97 | — | — | — | 0.11 | — | — | — | |
| South America | Silvopasture | 1 | 400 | 1.18 | — | — | — | 0.52 | — | — | — |
| All regions | Hedgerow | 12 | 400 ± 0 | 0.87 ± 0.75 | 0.42 | 0.31 | 3.15 | 0.23 ± 0.19 | 0.11 | 0.08 | 0.82 |
| Silvoarable | 9 | 271 ± 318 | 1.12 ± 1.07 | 0.70 | 0.40 | 2.98 | 0.28 ± 0.28 | 0.18 | 0.09 | 0.78 | |
| Silvopasture | 6 | 312 ± 175 | 1.81 ± 0.99 | 0.80 | 0.97 | 3.17 | 0.48 ± 0.28 | 0.23 | 0.11 | 0.83 | |
| Warm temperate (n = 9) | |||||||||||
| Europe | Silvoarable | 5 | 76 ± 38 | 0.52 ± 0.60 | 0.53 | 0.00 | 1.48 | 0.14 ± 0.15 | 0.13 | 0.00 | 0.37 |
| Silvopasture | 4 | 1667 ± 962 | 3.11 ± 2.88 | 2.82 | 0.73 | 7.16 | 1.03 ± 1.01 | 0.99 | 0.21 | 2.44 | |
| Temperate (all) (n = 36) | |||||||||||
| Hedgerow | 12 | 816 ± 853 | 0.87 ± 0.75 | 0.42 | 0.31 | 3.15 | 0.23 ± 0.19 | 0.11 | 0.08 | 0.82 | |
| Silvoarable | 14 | 202 ± 269 | 0.91 ± 0.91 | 0.50 | 0.00 | 2.98 | 0.23 ± 0.25 | 0.13 | 0.00 | 0.78 | |
| Silvopasture | 10 | 854 ± 903 | 2.33 ± 1.94 | 1.20 | 0.73 | 7.16 | 0.70 ± 0.68 | 0.42 | 0.11 | 2.44 | |
| Tropical dry (n = 101) | |||||||||||
| Africa | Alley cropping | 20 | 1000 ± 0 | 1.88 ± 1.21 | 0.53 | 0.42 | 4.53 | 0.45 ± 0.29 | 0.13 | 0.10 | 1.09 |
| Fallow | 22 | — | 5.61 ± 2.78 | 1.16 | 2.32 | 11.33 | 2.54 ± 2.28 | 0.95 | 0.56 | 10.40 | |
| Hedgerow | 2 | 1667 ± 471 | 0.48 ± 0.18 | — | 0.36 | 0.61 | 0.12 ± 0.04 | 0.06 | 0.09 | 0.15 | |
| Multistrata | 3 | 2771 ± 1413 | 1.63 ± 0.38 | 0.43 | 1.19 | 1.91 | 0.46 ± 0.11 | 0.12 | 0.33 | 0.53 | |
| Parkland | 7 | 152 ± 102 | 0.59 ± 0.46 | 0.34 | 0.22 | 1.54 | 0.21 ± 0.11 | 0.08 | 0.10 | 0.38 | |
| Asia | Alley cropping | 15 | 10 430 ± 2746 | 2.79 ± 1.35 | 0.68 | 1.09 | 5.81 | 0.67 ± 0.32 | 0.16 | 0.26 | 1.40 |
| Fallow | 9 | 1250 ± 0 | 5.61 ± 5.05 | 3.30 | 1.22 | 17.43 | 0.53 ± 0.24 | 0.16 | 0.17 | 0.95 | |
| Silvoarable | 6 | 540 ± 98 | 6.24 ± 2.77 | 2.22 | 3.59 | 9.71 | 1.62 ± 0.68 | 0.54 | 0.81 | 2.41 | |
| Silvopasture | 17 | 1609 ± 938 | 3.07 ± 3.99 | 2.02 | 0.06 | 13.21 | 0.84 ± 1.02 | 0.49 | 0.02 | 3.26 | |
| All regions | Alley cropping | 35 | 5041 ± 5052 | 2.27 ± 1.33 | 0.44 | 0.42 | 5.81 | 0.54 ± 0.32 | 0.11 | 0.10 | 1.40 |
| Fallow | 31 | 1250 ± 0 | 5.61 ± 3.50 | 1.23 | 1.22 | 17.43 | 1.95 ± 2.13 | 0.75 | 0.17 | 10.40 | |
| Hedgerow | 2 | 5833 ± 1179 | 0.48 ± 0.18 | — | 0.36 | 0.61 | 0.12 ± 0.04 | 0.06 | 0.09 | 0.15 | |
| Multistrata | 3 | 2771 ± 1413 | 1.63 ± 0.38 | 0.43 | 1.19 | 1.91 | 0.46 ± 0.11 | 0.12 | 0.33 | 0.53 | |
| Parkland | 7 | 152 ± 102 | 0.59 ± 0.46 | 0.34 | 0.22 | 1.54 | 0.21 ± 0.11 | 0.08 | 0.10 | 0.38 | |
| Silvoarable | 6 | 540 ± 98 | 6.24 ± 2.77 | 2.22 | 3.59 | 9.71 | 1.62 ± 0.68 | 0.54 | 0.81 | 2.41 | |
| Silvopasture | 17 | 1609 ± 938 | 3.07 ± 3.99 | 1.90 | 0.06 | 13.21 | 0.84 ± 1.02 | 0.49 | 0.02 | 3.26 | |
| Tropical moist (n = 97) | |||||||||||
| Africa | Alley cropping | 28 | 7233 ± 1805 | 2.75 ± 1.63 | 0.60 | 0.30 | 6.58 | 0.59 ± 0.38 | 0.14 | 0.07 | 1.58 |
| Multistrata | 3 | 1902 ± 1253 | 2.98 ± 0.74 | 0.84 | 2.15 | 3.58 | 0.72 ± 0.18 | 0.20 | 0.52 | 0.86 | |
| Shaded Perennial | 5 | — | 1.82 ± 0.71 | 0.62 | 0.63 | 2.38 | 0.44 ± 0.17 | 0.15 | 0.15 | 0.57 | |
| Silvoarable | 5 | — | 5.09 ± 2.27 | 1.99 | 1.35 | 6.76 | 1.22 ± 0.54 | 0.48 | 0.32 | 1.62 | |
| Asia | Fallow | 1 | — | 5.30 | — | — | — | 1.27 | — | — | — |
| Multistrata | 21 | 628 ± 247 | 3.03 ± 2.09 | 0.89 | 0.42 | 9.29 | 0.73 ± 0.50 | 0.21 | 0.10 | 2.23 | |
| Shaded Perennial | 2 | 1481 ± 0 | 2.07 ± 0.54 | — | 1.69 | 2.45 | 0.50 ± 0.13 | — | 0.41 | 0.59 | |
| Silvoarable | 11 | 1065 ± 152 | 1.50 ± 1.12 | 0.66 | 0.64 | 4.61 | 0.35 ± 0.27 | 0.16 | 0.15 | 1.11 | |
| Central America | Alley cropping | 15 | 25 000 ± 0 | 2.28 ± 1.04 | 0.52 | 0.45 | 4.41 | 0.55 ± 0.25 | 0.13 | 0.11 | 1.06 |
| South America | Shaded Perennial | 6 | 4131 ± 779 | 3.06 ± 2.51 | 2.01 | 1.07 | 7.64 | 0.71 ± 0.57 | 0.46 | 0.26 | 1.76 |
| All regions | Alley cropping | 43 | 13 733 ± 8781 | 2.59 ± 1.45 | 0.43 | 0.30 | 6.58 | 0.58 ± 0.34 | 0.11 | 0.07 | 1.68 |
| Fallow | 1 | — | 5.30 | — | — | — | 1.27 | — | — | — | |
| Multistrata | 24 | 802 ± 634 | 3.02 ± 1.96 | 0.78 | 0.42 | 9.29 | 0.73 ± 0.47 | 0.19 | 0.10 | 2.23 | |
| Shaded Perennial | 13 | 3071 ± 1552 | 2.43 ± 1.79 | 0.97 | 0.63 | 7.64 | 0.57 ± 0.40 | 0.22 | 0.15 | 1.76 | |
| Silvoarable | 16 | 1065 ± 152 | 2.63 ± 2.27 | 1.11 | 0.64 | 6.76 | 0.62 ± 0.55 | 0.27 | 0.15 | 1.62 | |
| Tropical montane (n = 30) | |||||||||||
| Africa | Fallow | 30 | 7521 ± 4182 | 3.12 ± 1.31 | 0.47 | 0.56 | 6.35 | 1.12 ± 0.74 | 0.26 | 0.14 | 4.50 |
| Tropical wet (n = 60) | |||||||||||
| Africa | Fallow | 3 | — | 6.21 ± 2.92 | 3.31 | 2.90 | 8.46 | 1.49 ± 0.70 | 0.79 | 0.70 | 2.03 |
| Multistrata | 2 | — | 2.89 ± 0.94 | — | 2.23 | 3.55 | 0.69 ± 0.22 | — | 0.53 | 0.85 | |
| Shaded Perennial | 1 | 1477 | 3.16 | — | — | — | 0.71 | — | — | — | |
| Asia | Fallow | 2 | — | 2.00 ± 2.52 | — | 0.22 | 3.78 | 0.48 ± 0.60 | — | 0.05 | 0.91 |
| Multistrata | 11 | — | 4.83 ± 4.05 | 2.40 | 0.51 | 15.51 | 1.16 ± 0.97 | 0.58 | 0.12 | 3.72 | |
| Shaded Perennial | 2 | 1608 ± 188 | 1.79 ± 1.21 | — | 0.93 | 2.64 | 0.42 ± 0.18 | — | 0.29 | 0.54 | |
| Silvopasture | 1 | — | 0.06 | — | — | — | 0.01 | — | — | — | |
| Central America | Alley cropping | 12 | 1203 ± 1000 | 1.88 ± 1.70 | 0.96 | 0.13 | 4.57 | 0.45 ± 0.41 | 0.23 | 0.03 | 1.10 |
| Hedgerow | 1 | 1110 | 0.43 | — | — | — | 0.10 | — | — | — | |
| Multistrata | 1 | — | 3.25 | — | — | — | 0.78 | — | — | — | |
| Shaded Perennial | 10 | 5967 ± 1724 | 2.28 ± 1.53 | 1.07 | 0.73 | 6.00 | 0.51 ± 0.38 | 0.23 | 0.18 | 1.44 | |
| South America | Fallow | 2 | — | 4.76 ± 1.19 | 1.65 | 3.92 | 5.60 | 1.14 ± 0.29 | — | 0.94 | 1.34 |
| Multistrata | 10 | 475 ± 159 | 2.60 ± 1.77 | 1.09 | 0.88 | 7.26 | 0.70 ± 0.41 | 0.25 | 0.28 | 1.74 | |
| Shaded Perennial | 2 | — | 2.96 ± 1.15 | — | 2.14 | 3.77 | 0.71 ± 0.28 | — | 0.51 | 0.90 | |
| All regions | Intercropping | 12 | 1203 ± 1000 | 1.88 ± 1.70 | 0.96 | 0.13 | 4.57 | 0.45 ± 0.41 | 0.23 | 0.03 | 1.10 |
| Fallow | 7 | — | 4.59 ± 2.77 | 2.06 | 0.22 | 8.46 | 1.10 ± 0.67 | 0.49 | 0.05 | 2.03 | |
| Hedgerow | 1 | 1110 | 0.43 | — | — | — | 0.10 | — | — | — | |
| Multistrata | 24 | 475 ± 159 | 3.67 ± 3.10 | 1.24 | 0.51 | 15.51 | 0.91 ± 0.73 | 0.29 | 0.12 | 3.72 | |
| Shaded Perennial | 15 | 4766 ± 2513 | 2.36 ± 1.36 | 0.69 | 0.73 | 6.00 | 0.54 ± 0.33 | 0.17 | 0.18 | 1.44 | |
| Silvopasture | 1 | — | 0.06 | — | — | — | 0.01 | — | — | — | |
| Tropical (all) (n = 288) | |||||||||||
| Alley cropping | 90 | 8568 ± 8403 | 2.37 ± 1.45 | 0.30 | 0.13 | 6.58 | 0.55 ± 0.34 | 0.07 | 0.03 | 1.68 | |
| Fallow | 69 | 6074 ± 4529 | 4.42 ± 2.86 | 0.68 | 0.22 | 17.43 | 1.49 ± 1.56 | 0.37 | 0.05 | 10.40 | |
| Hedgerow | 3 | 1481 ± 463 | 0.47 ± 0.13 | 0.15 | 0.36 | 0.61 | 0.11 ± 0.03 | 0.04 | 0.09 | 0.15 | |
| Multistrata | 51 | 929 ± 901 | 3.25 ± 2.54 | 0.70 | 0.42 | 15.51 | 0.80 ± 0.60 | 0.16 | 0.10 | 3.72 | |
| Parkland | 7 | 152 ± 102 | 0.59 ± 0.46 | 0.34 | 0.22 | 1.54 | 0.21 ± 0.11 | 0.08 | 0.10 | 0.38 | |
| Shaded Perennial | 28 | 4236 ± 2347 | 2.40 ± 1.54 | 0.57 | 0.63 | 7.64 | 0.55 ± 0.36 | 0.13 | 0.15 | 1.76 | |
| Silvoarable | 22 | 880 ± 290 | 3.61 ± 2.87 | 1.20 | 0.64 | 9.71 | 0.89 ± 0.73 | 0.31 | 0.15 | 2.41 | |
| Silvopasture | 18 | 1609 ± 938 | 2.91 ± 3.94 | 1.82 | 0.06 | 14.05 | 0.79 ± 1.01 | 0.47 | 0.01 | 3.26 | |
a. Based on information from the following studies: Abaker et al (2016), Adesina et al (1999), Aihou et al (1999), Albrecht & Kandji (2003), Beckert et al (2016), Brakas & Aune (2011), Bright et al (2017), Cardinael et al (2017), Chauhan et al (2010), Diels et al (2004), Dube et al (2012), Ehrenbergerová et al (2016), Fernández-Núñez et al (2010), Isaac et al (2003), Isaac et al (2005), Kang, (1997), Kaonga & Bayliss-Smith (2009), Kaur et al (2002), Kimaro et al (2011), Kirby & Potvin (2007), Kort & Turnock (1999), Kumar et al (1998), Lasco & Suson (1999), Maikhuri et al (2000), Makumba et al (2007), Mangalassery et al (2014), Mao et al (2012), Mittal & Singh (1989), Negash & Kanninen (2015), Norgrove & Hauser (2013), Nyadzi et al (2003), Oelbermann et al (2005), Palm et al (1999), Peichl et al (2006), Polzot, (2004), Rajab et al (2016), Rao et al (1991), Roshetko et al (2002), Schmitt-Harsh et al (2012), Schroth et al (2002), Sharrow & Ismail (2004), Siles et al (2010), Singh & Gill (2014), Smiley & Kroschel (2008), Somarriba et al (2013), Swamy & Puri (2005), Takimoto et al (2008), Villanueva-López et al (2015), Wade et al (2010), Wotherspoon et al (2014).
Discussion
Land use conversion to agroforestry systems
In general, conversion from croplands to agroforestry systems resulted in increased SOC stock but with large variation. A few studies however reported a SOC loss (Baumert et al 2016), but with no clear explanation as to the driver. It could be due to soil disturbance during tree planting, followed by an erosive event. The SOC storage rate depends on various agroforestry system characteristics, such as tree density, age and species but also on management factors (Kim et al 2016), including pruning, soil tillage and fertilization (Feliciano et al 2018). Initial conditions such as SOC stock in the previous cropland, and local pedoclimatic factors (e.g. rainfall, soil texture) are also important drivers of SOC storage (Corbeels et al 2018, Feliciano et al 2018). However, the amount of C input to the soil is probably one of the main factor explaining increased SOC stocks in croplands converted to agroforestry (Cardinael et al 2018, Fujisaki et al 2018).
Conversion from forests to agroforestry systems generally induced SOC loss. This result confirms recent findings (Chatterjee et al 2018, de Stefano and Jacobson 2018, Feliciano et al 2018, Shi et al 2018). However, the loss is usually less than if forests were converted to croplands (Schmitt-Harsh et al 2012, Norgrove and Hauser 2013). Globally, conversion from grasslands to agroforestry systems did not improve SOC stocks. This result is in accordance with Poeplau et al (2011) who found no difference in SOC stocks of afforested grasslands in Europe, and with Fujisaki et al (2015) who found slightly higher SOC stocks in grasslands than in forests. However, we did not explore here the effect of the grassland management on SOC storage. Converting degraded grasslands to silvopastures could increase SOC stocks (Mangalassery et al 2014).
Challenges in estimating SOC stock changes in agroforestry systems
As pointed out by Nair (2012), there is a significant lack of rigorous data on C sequestration in agroforestry systems. To assess changes in SOC stock and storage/loss following a LUC, some basic data are required: a description of the previous land use, SOC stocks or SOC content and bulk densities in both the previous and new land use, soil depth considered, and time span since conversion. Unfortunately, the literature review showed that these basic data were not always present. The concerned papers were therefore not used to estimate the new emission factors. Many authors have, for instance, measured SOC in agroforestry but not in a reference system, preventing assessment of whether soil had lost or gained organic C (Pandey et al 2000, Roshetko et al 2002, Isaac et al 2005, Mungai et al 2006, Muñoz et al 2007, Singh and Sharma 2007, Smiley and Kroschel 2008, Saha et al 2009, Labata et al 2012, Seddaiu et al 2013, Simón et al 2013, Guimarães et al 2014, Sitzia et al 2014, Nath et al 2015, Ramos et al 2018, Sun et al 2018). Some publications compared SOC stocks in agroforestry and in a « reference » system, but this reference system was different from the land use present before conversion to agroforestry (Drechsel et al 1991, Materechera and Mkhabela 2001, Isaac et al 2003, Nyamadzawo et al 2008, Takimoto et al 2008, Howlett et al 2011b, Cardinael et al 2012, Gelaw et al 2014, Jacobi et al 2014, Ehrenbergerová et al 2016, Rajab et al 2016). This could be very problematic, such as when a forest is converted to either a shaded-perennial crop system or a monocrop plantation. Comparing SOC stocks in the agroforestry and in the plantation could result in an apparent SOC storage, while in reality the conversion of the forest to the agroforestry system usually leads to a loss in SOC.
The age of the agroforestry system or the time span since conversion from a previous land use is also often missing in most studies, making it impossible to estimate the rate of change in SOC stock (Kater et al 1992, Kessler 1992, Walter et al 2003, Wade et al 2010, Labata et al 2012, Alvarado et al 2013, Simón et al 2013, Frazão et al 2014, Goswami et al 2014, Rocha et al 2014, Sitzia et al 2014, Baah-Acheamfour et al 2015, Jadan et al 2015, Asase and Tetteh 2016, Tumwebaze and Byakagaba 2016). Several articles only reported SOC content, and bulk densities were missing (Drechsel et al 1991, Mazzarino et al 1993, Chander et al 1998, Kang et al 1999, Kaur et al 2000, Pandey et al 2000, Singh and Sharma 2007, Kumar et al 2010, Mao et al 2012, Cardinali et al 2014, Sitzia et al 2014, Dubiez et al 2018, Nijmeijer et al 2018, Sun et al 2018).
The loss of SOC following a LUC can be very quick while it usually takes much longer to gain SOC (Smith 2004), especially with low tree densities. The studies using a diachronic approach to quantify SOC changes in agroforestry are rare (Beer et al 1990, Mazzarino et al 1993, Maikhuri et al 2000, Oelbermann et al 2004, Sierra and Nygren 2005, Swamy and Puri 2005, Raddad et al 2006, Lenka et al 2012, Singh and Gill 2014, Wang et al 2015), most of them have been performed using a synchronic or chronosequence approach. The diachronic approach has been recognized to be a more accurate method to assess SOC changes than other methods (Costa Junior et al 2013). More agroforestry trials using this approach should be established. LUC is often associated with a modification of soil bulk density, and a calculation of SOC stocks on an equivalent soil mass basis instead of on a fixed depth is recommended (Ellert and Bettany 1995, Ellert et al 2002, Wendt and Hauser 2013). Surprisingly, very few studies on SOC storage in agroforestry followed this recommendation (Bambrick et al 2010, Cardinael et al 2015a, Upson et al 2016, Cardinael et al 2017, Wiesmeier et al 2018).
The main difficulty to properly assess SOC changes in agroforestry systems compared to other land uses is the spatial heterogeneity. Scattered trees induce a gradient in organic inputs to the soil (Cardinael et al 2018), and an large number of soil samples have to be taken to explore this heterogeneity (Cardinael et al 2015a, Upson et al 2016). Developing technologies, such as visible and near-infrared spectroscopy could be used to reduce the cost and the time to monitor SOC changes (Cambou et al 2016, Viscarra Rossel et al 2016).
Deep roots and carbon storage
Roots of agroforestry trees can grow very deep in the soil due to competition with the associated crops and to soil tillage (Cardinael et al 2015b). Great uncertainties exist on the fate of fresh organic inputs in deep soil layers and on their interaction with older soil organic matter, such as priming effect (Fontaine et al 2007). However, since a large amount of root inputs can be incorporated into these systems (Germon et al 2016, Cardinael et al 2018), it would probably be very valuable to expand research on this topic. Cardinael et al (2018) indeed found that SOC profiles (2 m depth) in a long-term agroforestry systems where only well described if priming effect was included in the model. Only few studies have measured SOC storage in deep soil layers of agroforestry systems (Haile et al 2008, Howlett et al 2011a, Upson and Burgess 2013, Cardinael et al 2015a), more studies are required. Moreover, very few studies have quantified both above and belowground biomass of agroforestry systems, and the use of the root:shoot ratio determined on forest ecosystems could be problematic. Due to their low density, agroforestry trees usually grow faster than forest trees (Balandier and Dupraz 1998), and they also benefit from crop inputs (fertilization), and their root systems compete with annual crops. Moreover, agroforestry trees are often pruned. Carbon allocation between aerial and belowground parts of the trees might therefore be modified. The use of non-destructive and repeatable methods, such as ground penetrating radar could be a good way to acquire more data on agroforestry root systems (Borden et al 2014).
Revised stock change factors for agroforestry
Several tools use tier coefficients to provide an estimation of the C-balance associated with the adoption of improved land management options, as compared with a 'business as usual' scenario. This is for instance the case of the EX-ACT (EX-Ante Carbon-balance Tool) tool developed by the Food and Agriculture Organization of the United Nations (FAO), providing ex-ante measurements of the mitigation impact of agriculture and forestry development projects, estimating net C balance from GHG emissions and C sequestration (Bernoux et al 2010). EX-ACT has been developed using primarily the IPCC (2006) Guidelines for NGHGIs (IPCC 2006), complemented by other existing methodologies and reviews of default coefficients. Default estimates for mitigation options in the agriculture sector are mostly from the 4th Assessment Report of IPCC (2007) (Smith et al 2007).
Our newly derived factors can be used to improve these tools to estimate C sequestration in any country with a minimal amount of data by using the IPCC method. These factors may have systematic biases when not representative of management effects, climate, or soils in a particular region. Consequently, nations with available resources should consider synthesizing data from local field experiments to generate country-specific factors. However, these new estimates certainly represent a significant improvement to better account for the diversity of agroforestry systems. They were all previously included into the 'perennial crops' category, together with vineyards and orchards, and are now split into eight main types of agroforestry systems per climate and region. The presentation of emission factors for the biomass and soil using the same classification of agroforestry systems represents another important added value of this study.
Acknowledgments
The authors would like to thank all members of the EX-ACT and MICCA teams at FAO who helped us to undertake this study. Gratitude is especially owned to Krystal Crumpler for reviewing an initial version. The study was supported through funding by the French Development Agency, the Food and Agriculture Organization of the United Nations (FAO), in particular through the Agricultural Development Economics Division (ESA) and the Climate and Environment (CBC) Division supported by the Federal Ministry of Agriculture of Germany under the projects GCP/GLO/500/GER and GCP/GLO/875/GER.