


Abstract
Climate change can put an intense pressure on already scarce water resources in the Middle East, potentially catalyzing the risk of serious water conflicts. Albeit most efforts to quantify the potential impact of climate change in the Middle East use global climate model outputs, here we employ two regional climate model outputs which are expected to provide more trustworthy projections for the region with a complex terrain and variable land surfaces. We find that not ubiquitous does future climate change lead to a decline in annual precipitation total in the region; nevertheless, the projected decline stems from an increase in number of dry days (NDD) rather than a decrease in precipitation intensity on rainy days. The increase in annual precipitation total in the southern part is driven by changes in both NDD and precipitation intensity. The drought periods will be longer (up to 90%) in about 80% of the Middle East area. The prolonged droughts in the future will increase the already high level of water stress in the region and force people to migrate or live in dreadful conditions of water poverty.
Export citation and abstract BibTeX RIS

Original content from this work may be used under the terms of the Creative Commons Attribution 3.0 licence. Any further distribution of this work must maintain attribution to the author(s) and the title of the work, journal citation and DOI.
Introduction
The Middle East is one of the world's most water-scarce and dry regions which lacks adequate available water resources to meet human demands (Kummu et al 2010, Barlow et al 2016, Veldkamp et al 2016). The region has about one fifth of the world average annual renewable water supplies per capita (El Kharraz et al 2012). The dramatic water scarcity of the region has been further exacerbated by fast population growth with an inappropriate spatial distribution, land use/cover change, agriculture expansion, urban construction and industrial development (Madani 2014, AghaKouchak et al 2015). As the world's second fastest growing population after sub-Saharan Africa, the population in the Middle East region is projected to double by 2050 (Roudi-Fahimi and Kent 2007), leading to a fall in per capita water availability by half. This projected decrease in water availability will affect the society whose economy highly depends on agriculture (Ashraf et al 2017).
A multiplier of the water scarcity threat in the Middle East is climate change which puts additional pressures on the availability of the water resources. In a warmer atmosphere, atmospheric moisture convergence and divergence magnitudes are expected to increase as a result of increasing moisture content of the atmosphere, leading to the definition of the simple paradigm 'wet regions get wetter, dry regions get drier under climate change' (Held and Soden 2006, Burls and Fedorov 2017). This future picture of available water is worrying for the dry Middle East region where water is already scarce with a declining precipitation in the past decades (Tabari and Hosseinzadeh Talaee 2011, Almazroui et al 2012, Donat et al 2014) and the ongoing drought started in 1998 is the worst in the last nine centuries (Cook et al 2016).
To address this huge developing challenge in the Middle East, there is a specific need to depict a complete and more accurate picture of future water scarcity and drought under climate change conditions to ensure water security and diminish the negative effects and the costs to the society. The projections of global climate models (GCMs) point to an overall drying signal for the Middle East (Dai 2013, IPCC 2013); however, the precipitation simulations by GCMs with a coarse spatial resolution of 1°–3° may be biased for the region with a complex terrain (Black et al 2010) and variable land surfaces (e.g., mountains, deserts, coastlines, inland water bodies) (Maraun et al 2017, El-Samra et al 2018). A more trustworthy representation of the land surface features along with a better simulation of meso-spatial scale processes and the atmospheric circulation and gradients are provided at finer spatial resolutions of regional climate models (RCMs) (Torma et al 2015, Mohan and Sati 2016, Lucas-Picher et al 2017, Ahmadalipour and Moradkhani 2018, Minder et al 2018). It will bridge various gaps in our understanding of the influence of the unique topography of the Middle East on the precipitation and drought projections and of the associated uncertainties. Of special interests are how do fine-scale climate change projections over the Middle East differ from what we already know from the parent GCMs and how certain are these fine-scale projected changes.
While there has been some research on the impact of climate change on precipitation in the Middle East using RCMs (Evans 2008, Chenoweth et al 2011, Almazroui 2013, Tabari and Willems 2018), none has investigated the potential impact on dryness and drought and the associated uncertainties. This study examines the impact of climate change on dryness, drought and annual precipitation in the Middle East region, by taking into account the influence of the model spatial resolution on the results and the degree of confidence that we can place in the conclusions.
Materials and methods
Models and scenarios
The RCMs used in this study from the WAS-CORDEX (Coordinated Regional Climate Downscaling Experiment framework over the South Asia domain) ensemble are RCA4 (Kupiainen et al 2011, Samuelsson et al 2011) and REMO (Jacob et al 2012). Forcing fields come from six CMIP5 (Coupled Model Intercomparison Project Phase 5) GCMs including CNRM-CM5, EC-EARTH, GFDL-ESM2M, IPSL-CM5A-MR, MIROC5 and MPI-ESM-LR (table S1 is available online at stacks.iop.org/ERL/13/104005/mmedia). The ensemble is unbalanced with respect to the RCMs with six RCA4 simulations and one REMO simulation. This gives a higher weight to the RCA4 simulations in the results. However, due to the limited number of RCMs, one run per climate model (1R1M) strategy is not applicable and all of the available simulations are included in the analysis. The effect of the unbalanced matrix is tested by comparing the results of all simulations and the 1R1M strategy in which the results of the RCA4 and REMO models nested in the same GCM (MPI-ESM-LR) are used.
Simulations cover current climate conditions (1971–2000) and future climate period (2070–2099) under two Representative Concentration Pathways of RCP4.5 (corresponding to about 2 °C global warming by the end of this century) and RCP8.5 (business-as-usual scenario). The RCM simulations with a 0.44° spatial resolution were derived from the CMIP5 GCMs with a spatial resolution ranging between 1.1° and 2.5° as shown in table S1. The considered domain contains 28 countries with an area over 13 million sq km and a population over 850 million (table S2). The original WAS-CORDEX and CMIP5 files are masked out to the study domain.
Definition of dryness and drought
The indicator of the number of dry days (NDD) is used to evaluate dryness in the region. A dry day is defined as one where precipitation is less than 1 mm. As the coarser climate models (driving GCMs) tend to overestimate the number of days with light precipitation (i.e., drizzle problem; Rulfová et al 2017, Moon et al 2018) and for the consistency between the results of driving and driven models, this threshold was selected to define a dry day. Following the IPCC AR5 (IPCC 2013), the longest dry spell (LDS) indicator is used as the indicator of drought. A dry spell is defined as a period of consecutive days with a precipitation of less than 1 mm, immediately preceded and followed by a wet day. Defining this indicator on a yearly basis, where dry spells always end at the end of each year as in Tebaldi et al (2006), is not relevant for the arid Middle East region where dry spells may span a period longer than one year. To avoid the splitting of dry spells, the LDS in the 30 years period (control and scenario) is considered. Hence, the LDS calculated has an empirical return period of 30 years. As this drought indicator is based on only lack of precipitation, it is an indication of meteorological drought. In addition to these dryness and drought indicators, changes in the total annual amount of precipitation (PTOT) are analyzed to check if the change in precipitation shortage indicators is consistent with that in precipitation totals.
Statistical methods
To determine climate change signals, the length of LDS, NDD and PTOT for the control (1971–2000) and scenario (2070–2099) periods are computed and the ratio between them is calculated. The robustness of the climate change signals is quantified on the basis of the climate model agreement on the sign of change. A climate change signal is robust when more than 70% of the models agree on the sign of change, while less than that threshold is interpreted as 'unreliable change'. The consistency between the projected changes in the three indicators was investigated by correlating the projected areal average changes of the indicators over the Middle East.
The PTOT changes are due to the changes in NDD and/or precipitation intensity. To explore what portion of the PTOT changes can be attributed to the NDD changes, the ratio of the NDD changes in a given month multiplied by the average precipitation amount on wet days in the same month in the historical period over the PTOT changes is calculated. The difference between the PTOT changes and the PTOT changes due to the NDD changes show the PTOT changes due to precipitation intensity changes (Polade et al 2014).
For uncertainty analysis of projections, the variance decomposition-same sample size method (Hosseinzadehtalaei et al 2017, Tabari and Willems 2018) is used. To limit the effect of different sample sizes of uncertainty contributors, this method computes uncertainty based on the common sample size among the uncertainty components using random sampling. In the framework of the sampling-theory based bootstrapping procedure, the common size of samples for the components with larger sample sizes is randomly selected from the full population. The discrepancy among the samples in terms of standard deviation (σ) or variance (σ2) is determined. This process is repeated an adequately large number of times and the median of σ or σ2 of the bootstrap samples denotes the uncertainty.
To examine how a high resolution representation of meso-scale features in the Middle East can affect the climate change signals, the results of the WAS-CORDEX RCMs are compared with the ones from the driving CMIP5 GCMs. Because of different horizontal resolutions of the RCM and GCMs, the model results are regridded to the same resolution. After regridding, the ensemble downscaling signal (EDS) (Giorgi et al 2016, Tabari and Willems 2018) is computed as the median of the difference between the spatial anomalies of RCM and GCM based changes over different RCM-GCM combinations.
Results and discussion
Figure 1 illustrates the changes in PTOT, NDD and LDS based on the median ensemble of the WAS-CORDEX RCMs for RCP4.5 and RCP8.5 over the Middle East region. PTOT is expected to decrease in the northern and western parts of the Middle East region, while it will increase in the southern and eastern parts. The robust PTOT increase is more pronounced for Oman, Yemen, southern Saudi Arabia and Somalia (figures 1 and S1), in agreement with a strong increase of annual precipitation in the southern parts of the Arabian Peninsula using CMIP3 (Almazroui et al 2016) and CMIP5 (Almazroui et al 2017) GCM ensembles. Almost all climate model runs agree on the increasing PTOT signal in the southern and eastern parts (figure S2). A robust declining PTOT signal of >20% is observed in Egypt, Israel, Palestinian Territory, Lebanon, Jordan, Syria, western Turkey, northern Iraq and northern Sudan. The precipitation increase in the southern part of the Middle East is because of the northward movement of the intertropical convergence zone into the domain throughout the century, while the precipitation decrease in the northern part in due to the poleward shift of mid-latitude storm track resulting in a decreased density and intensity of storm track (cyclonic activity) over the Eastern Mediterranean region (Evans 2009, Favre and Gershunov 2009). Our results for the dipole-like pattern of the PTOT change over the Middle East (i.e., increase in the southern and decrease in the northern part) are clearly in contrast to 'wet regions get wetter, dry regions get drier under climate change' paradigm.
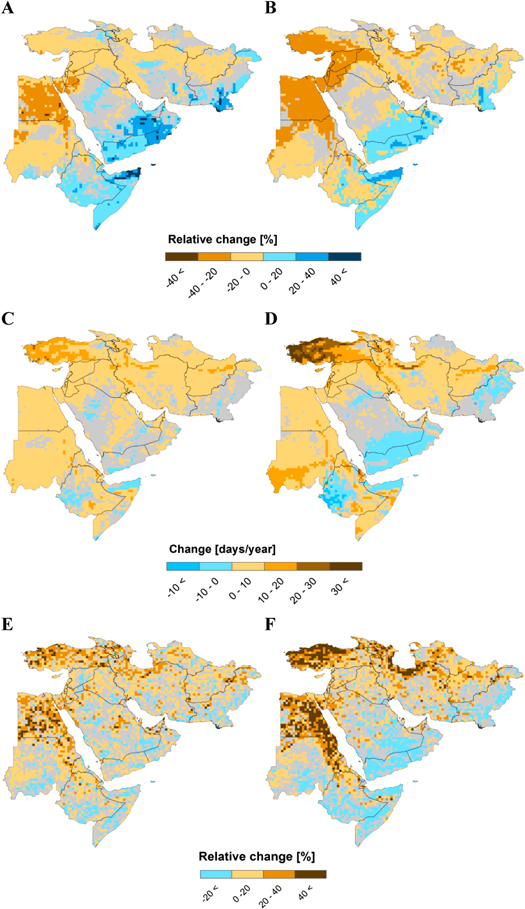
Figure 1. Projected changes in PTOT (A), (B), NDD (C), (D) and LDS (E), (F) over the Middle East region between 1971–2000 and 2070–2099 based on the median ensemble of seven WAS-CORDEX RCM runs for RCP4.5 (A), (C), (E) and RCP8.5 (B), (D), (F). Values are masked in gray where the changes are not robust (changes are robust when more than 70% of all model runs (five out of seven runs) agree on the sign of the change).
Download figure:
Standard image High-resolution imageAlthough about half of the Middle East area will experience decreased precipitation—predominantly in Levant—projected decreases in NDD are more uniform, shifting towards less frequent rainy days. In fact, NDD will increase almost all over the Middle East region (85% and 75% of the domain respectively for RCP4.5 and RCP8.5; figure 2). The spatial variation of the NDD changes is small and mostly limited to ±5% (figures 2 and S1). Consistent with the literature (Polade et al 2014, 2017), a large NDD increase is observed for Turkey, going up to 23%. The robust decreasing NDD signal in western Turkey is confirmed by all the model runs (figure S2). There is a clear inverse relationship (r = 0.59) between NDD and PTOT changes from the individual RCM runs (figure 3). To investigate what fraction of the PTOT changes is due to the NDD changes, the percentage contribution of the NDD changes is shown in figure 4. The result is that the NDD change is mainly responsible for the PTOT change with a high spatial consistency of changes in the indicators. The spatial consistency between the NDD and PTOT changes is higher for RCP4.5 (91% of the area) compared to RCP8.5 (82% of the area). In 52% and 53% of the Middle East for RCP4.5 and RCP8.5 respectively, the NDD changes account for more than 80% of the PTOT changes. By contrast, the PTOT increase in the southern part is driven by a combination of the projected decrease in the NDD and the increase in precipitation intensity. These results confirm the results obtained using the CMIP5 GCMs (Polade et al 2014). The analysis of the NDD change contribution to the PTOT changes in different months reveal that the NDD changes in the winter months have the lowest contribution to the PTOT changes, while the contribution is the highest in the autumn and summer months (figures 4(C)–(F)). The highest NDD change contribution in the autumn (summer) months is observed in 41% (25%) and 56% (17%) of the Middle East for RCP4.5 and RCP8.5, respectively.

Figure 2. Empirical cumulative distribution function (CDF) of PTOT, NDD and LDS changes based on the median ensemble of seven WAS-CORDEX RCM runs for RCP4.5 (A) and RCP8.5 (B) over the Middle East region. The percentage on the plots with the color corresponding to each indicator shows the fraction of the grid cells experiencing an increasing signal.
Download figure:
Standard image High-resolution image
Figure 3. Relationship between the regional average changes in PTOT, NDD and LDS for individual RCM runs over the Middle East region. Linear trendline and correlation coefficient are provided on each panel. The changes are computed for the period 2070–2099 respect to the reference 1971–2000.
Download figure:
Standard image High-resolution image
Figure 4. (A), (B) Percentage contribution of NDD changes to PTOT changes over the Middle East region based on the median ensemble of seven WAS-CORDEX RCM runs, and the months with the highest (C), (D) and the lowest (E), (F) contribution of NDD changes for RCP4.5 (A), (C), (E) and RCP8.5 (B), (D), (F). A weighted kernel neighborhood method was used to eliminate noise in the spatial maps in the panels (C)–(F), which is the reason for the tiny mismatch in some places between the highest and lowest contribution maps. The changes are computed for the period 2070–2099 respect to the reference 1971–2000. Negative values indicate competing changes of NDD and PTOT (i.e., same direction of change).
Download figure:
Standard image High-resolution imageThe other indicator used for representing dry conditions and water shortage is LDS. The areas of projected increase and decrease in LDS are almost identical with those for PTOT and NDD (figure 1). The across-model relationship between the LDS and PTOT changes (r = 0.85; inverse relationship) is stronger than that between the LDS and NDD changes (r = 0.59; direct relationship) (figure 3). The LDS is also expected to increase for most of the region: 88% and 77% of the domain respectively for RCP4.5 and RCP8.5 (figure 2). The LDS increase goes up to 90% compared to the maximum NDD increase of about 23% (>30 days). Spatially, the eye-catching increases of more than 40% in LDS are apparent in Turkey, Egypt, Sudan and the northern part of Iran (i.e., southern coast of the Caspian Sea). Comparison of the changes for the PTOT, NDD and LDS indicators shows that intense precipitation will increase at a larger extent compared to mean precipitation, while mean precipitation change has a larger spatial variation over the domain (figures 1 and 2). Moreover, the PTOT, NDD and LDS changes are amplified and less spatially homogeneous for RCP8.5 in comparison to RCP4.5. Assessing the 'wet regions get wetter, dry regions get drier' paradigm based on the dryness and drought indicators reveals the validity of this paradigm in the Middle East, while it is violated regarding the results of annual precipitation change. This shows the high dependency of the paradigm to the indicator used to obtain moisture change.
To investigate the effect of the unbalanced RCM-GCM matrix, the changes in PTOT, NDD and LDS based on the 1R1M strategy are shown in figure S3. The spatial pattern of the changes for the 1R1M strategy is similar to that for all simulations, although for the latter the median scenario based changes are smaller due to the compensating effect of a larger ensemble.
The PTOT, NDD and LDS projections reported in this paper are based on the median ensemble of climate models. The median ensemble is a useful measure to quantify the average response to external forcings, but does not deliver any information on projections uncertainty with respect to unforced climate variability (IPCC 2013). We, therefore, convey such information for the obtained climate change signals in PTOT, NDD and LDS. The NDD change has by far the smallest total uncertainty (figure S4). Less consistency across climate models for the PTOT change compared with NDD is because the former is a result of an interaction between the changes in NDD and precipitation intensity on rainy days (Pierce et al 2013). The large total uncertainty in the PTOT changes is particularly pronounced in the regions with increasing signals (figure S4(A)). The total uncertainty in the PTOT, NDD and LDS changes is decomposed into GCM, RCM and RCP uncertainties. The GCM and RCP uncertainties are the dominant and least important sources of uncertainty for PTOT, respectively (figure 5). The choice of GCMs has also represented the largest fraction of the precipitation change uncertainty in the other CORDEX regions (Gampe et al 2016). The NDD changes follow the same pattern as PTOT changes, while for the LDS changes the RCM uncertainty dominates the total uncertainty. For all the three indicators considered, the RCP uncertainty is less than 20%, whereas it goes as high as 48% for the GCM uncertainty. The results show that the relative importance of the different sources of uncertainty depends on the indicator of interest. The GCM uncertainty ranges from 40% for LDS to 48% for NDD, RCM uncertainty from 35% for PTOT to 43% for LDS and the RCP uncertainty from 15% for NDD to 19% for PTOT (figure 5(J)). The spatial distribution of the relative contributions of these sources also depends on the indicator of interest (figures 5(A)–(I)).
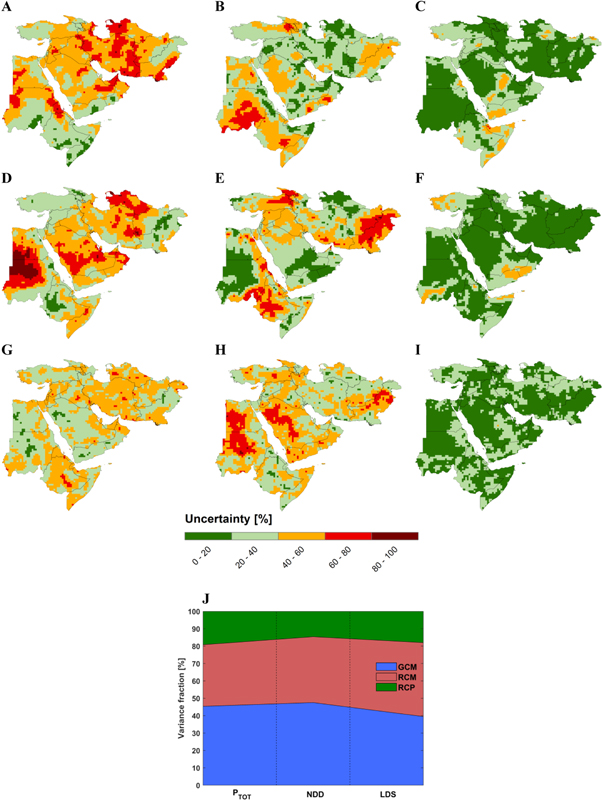
Figure 5. The local fraction of total uncertainty in PTOT (A)–(C), NDD (D)–(F) and LDS (G)–(I) changes explained by GCM (A), (D), (G), RCM (B), (E), (H) and RCP (C), (F), (I) uncertainties over the Middle East region, and (J) the total uncertainty decomposed by GCMs, RCMs and RCPs uncertainties.
Download figure:
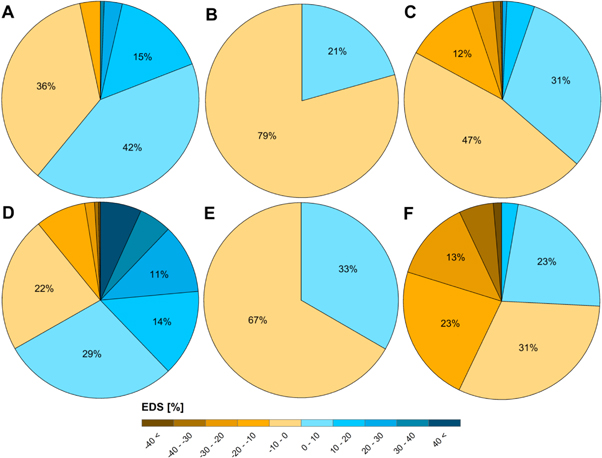
Standard image High-resolution imageTo investigate the impact of the model spatial resolution on the results, the climate change signals derived from the WAS-CORDEX RCMs are compared with those from the driving CMIP5 GCMs based on the EDS. The positive value of this index shows a larger (smaller) change by the RCMs compared to the driving GCMs. For PTOT, a larger change is projected by the WAS-CORDEX RCMs, with a positive downscaling signal covering 60% and 67% of the area (figure 6). A spatial variability of the downscaling signal can be identified, with the largest downscaling signal or the biggest difference between the RCMs and the driving GCMs in the southern part of the Arabian Peninsula (figure S5). The opposite pattern to PTOT is seen for NDD, where the GCM changes are larger than the RCM changes in 79% and 67% of the area for RCP4.5 and RCP8.5, respectively (figure 6). The RCM and GCM results are more consistent for NDD in comparison to PTOT, with the maximum change difference of 10%. In the case of the LDS changes, the RCMs project smaller changes than the driving CMIP5 GCMs (figure 6). These smaller changes of the RCMs are seen in 64% and 74% of the area for RCP4.5 and RCP8.5, respectively. The largest discrepancy between the RCM and GCM projections for the LDS changes is observed in the eastern part of Turkey (figure S5). For all the three indicators, the difference between the RCM and GCM changes is bigger for the highest level of emission scenario (RCP8.5) compared to the intermediate scenario RCP4.5.
Figure 6. Percentage of the Middle East area with different classes of ensemble downscaling signal for PTOT (A), (D), NDD (B), (E) and LDS (C), (F) for RCP4.5 (A), (B), (C) and RCP8.5 (D), (E), (F). Darker colors denote a larger difference between the CORDEX RCMs and the driving CMIP5 GCMs. Only the percentages larger than 10% are written on the pie charts.
Download figure:
Standard image High-resolution image
Conclusions
This study investigates the impact of climate change on the total annual amount of precipitation, dryness and drought in the Middle East using the WAS-CORDEX RCM results. As opposed to 'wet regions get wetter, dry regions get drier under climate change' paradigm, annual precipitation is not expected to uniformly decrease in mostly arid Middle East region, but it will also increase in about half of the area. The annual precipitation increase is mainly observed in the southern and eastern parts. However, a slight increase in the NDD is expected for almost the entire Middle East and the region will experience longer dry spells in the future. These results are in agreement with the paradigm, revealing the sensitivity of the paradigm to the indicator selected for deriving moisture change. The annual precipitation decrease is dominated by the changes in NDD, whereas the annual precipitation increase is controlled by the changes in both NDD and precipitation intensity. The uncertainty analysis of climate change projections reveals the GCM uncertainty as the major contributor to the total uncertainty in PTOT and NDD changes, while RCM is identified as the most dominant component for the LDS changes.
When comparing the climate change signals between the WAS-CORDEX RCMs and the driving CMIP5 GCMs, stronger PTOT changes are projected by the RCMs. On the contrary, the GCMs project larger changes for NDD and LDS. Among the considered indicators, NDD shows the highest consistency between the RCM and GCM results, with a difference of <10% for the entire domain. In other words, our results reveal an underestimation of climate change signals for annual precipitation total by coarse scale models, and an overestimation for the LDS. It emphasizes the important role of climate model's resolution for better representation of more detailed topographical features and large-scale precipitation pattern over the Middle East region. Nevertheless, the WAS-CORDEX RCMs with a spatial resolution of 0.44° are capable of providing topography in greater details beyond the capability of the parent CMIP5 GCMs, but still are insufficient to resolve orography in very complex terrain.
Together, although the results of this study do not show a widespread decreasing signal for PTOT all over the Middle East, the results for NDD and LDS reveal less frequent rainy days and prolonged dry periods. The anticipated prolonged drought conditions will have dire implications in the region which is already struggling with water scarcity issues. The exacerbation of the current water scarcity places an enormous pressure on food production and water security and raise the risk of political conflict over transboundary water resources in the Middle East.
Acknowledgments
This study was supported by the 2016 Ernest du Bois Fund from the King Baudouin Foundation for the best PhD thesis in Belgium on the theme of water availability and the protection of the water resources. The CMIP5 GCM and CORDEX RCM data are freely available at the website of the Earth System Grid Federation (https://esgf-index1.ceda.ac.uk).