


Abstract
There is currently a lack of representative, systematic and harmonised greenhouse gas (GHG) observations covering the variety of natural and human-altered biomes that occur in Africa. This impedes the long-term assessment of the drivers of climate change, in addition to their impacts and feedback loops at the continental scale, but also limits our understanding of the contribution of the African continent to the global carbon (C) cycle. Given the current and projected transformation of socio-economic conditions in Africa (i.e. the increasing trend of urbanisation and population growth) and the adverse impacts of climate change, the development of a GHG research infrastructure (RI) is needed to support the design of suitable mitigation and adaptation strategies required to assure food, fuel, nutrition and economic security for the African population. This paper presents the initial results of the EU-African SEACRIFOG project, which aims to design a GHG observation RI for Africa. The first stages of this project included the identification and engagement of key stakeholders, the definition of the conceptual monitoring framework and an assessment of existing infrastructural capacity. Feedback from stakeholder sectors was obtained through three Stakeholder Consultation Workshops held in Kenya, Ghana and Zambia. Main concerns identified were data quality and accessibility, the need for capacity building and networking among the scientific community, and adaptation to climate change, which was confirmed to be a priority for Africa. This feedback in addition to input from experts in the atmospheric, terrestrial and oceanic thematic areas, facilitated the selection of a set of 'essential variables' that need to be measured in the future environmental RI. An inventory of 47 existing and planned networks across the continent allowed for an assessment of the current RIs needs and gaps in Africa. Overall, the development of a harmonised and standardised pan-African RI will serve to address the continent's primary societal and scientific challenges through a potential cross-domain synergy among existing and planned networks at regional, continental and global scales.
Export citation and abstract BibTeX RIS

Original content from this work may be used under the terms of the Creative Commons Attribution 3.0 licence. Any further distribution of this work must maintain attribution to the author(s) and the title of the work, journal citation and DOI.
1. Introduction
Africa is undergoing a profound and rapid transformation, which is expected to continue throughout the 21st century. Principal drivers include urbanisation, increasing economic and social development, current and predicted climate change, and an increase in population growth. The continent has had the highest population growth rate in recent years, and it is expected that more than half of the projected global population growth until 2050 will occur in Africa, doubling its current population of close to 1.3 billion (∼17% of the world population) to more than 2.5 billion (UN 2017). These demographic trends are expected to lead to an increase in energy and natural resources demand (Cerutti et al 2015), and the intensification and expansion of agricultural systems (Herrero et al 2008, Rosenstock et al 2013). Despite the general trend of migration from rural to urban areas in Africa, over 60% of the African population still live in rural areas (UN 2014). Consequently, the current African contribution to global carbon (C) emissions from fossil fuel consumption and cement production have increased but still remains negligible (3.6% in 2014; Boden et al 2017). In contrast, emissions from land use change and forestry represent more than one third of the total African emissions (Valentini et al 2014), which is more than twice the global average for this sector (∼14%; Le Quéré et al 2018).
African countries belong to the Non-Annex I parties of the United Nations Framework Convention on Climate Change (UNFCCC), who report their national greenhouse gas (GHG) inventories with lower periodicity compared to the Annex I parties. Additionally, GHG emission estimates associated with the agriculture and livestock sectors are often biased by using IPCC Tier 1 approaches (IPCC 1996, Rosenstock et al 2013, Pelster et al 2016, 2017, Goopy et al 2018). While most African nations published national GHG emission inventories in 1994 and 2000, knowledge gaps still exist at the continental scale with reports currently absent for four of the fifty-four African countries (UNFCCC 2018). Overall, given the structural transformation of the continent, African GHG emissions are likely to increase in the short-term (Hickman et al 2011). This emphasises the need to accurately quantify the emissions from these sectors and to use that knowledge to inform and design suitable mitigation policies.
The most recent and complete estimate of the African C budget was performed by Valentini et al (2014), using various methodologies including inventory data, ecosystem flux measurements, modelling approaches and atmospheric inversion techniques. Their results demonstrated the importance of Africa in the global C cycle, contributing 16% and 33% of the total C sink and tropical C biomass reservoir, respectively, in addition to ∼25% of its inter-annual variability. Their net C balance estimates for Africa ranged from a small source of 0.05 ± 0.28 Pg C yr−1 to a sink of −1.34 ± 1.32 Pg C yr−1, depending on the method applied. Furthermore, the estimated emission of nitrous oxide (N2O) (mostly derived from fertilisation in agricultural systems) and methane (CH4) fluxes (due to methanogenesis in inland waters and the enteric fermentation of ruminants) amounted to 2.62 ± 1.28 Pg CO2-eq yr−1. Combining their median estimate for net biome C balance with estimates for fossil fuel carbon dioxide (CO2) emissions and non-CO2 GHG emissions, Valentini et al (2014) concluded that Africa is a net source of GHG emissions. Other studies have also identified considerable uncertainties in the nitrogen (N) budgets of livestock systems (Rufino et al 2014) and associated GHG emission hotspots within the agriculture, forestry and other land uses sector (Roman-Cuesta et al 2016, Baccini et al 2017, Pearson et al 2017). Although significant knowledge has been derived from specific African regions such as Kenya (i.e. Arias-Navarro et al 2016, 2017, Jacobs et al 2017, Ortiz-Gonzalo et al 2018, Owuor et al 2018), there is a general lack of ground-based observations to constrain both continental (Valentini et al 2014) and global GHG budgets (Marcolla et al 2017, Zhu et al 2018).
Besides assistance in GHG budget determination and UNFCCC emission reporting, environmental observation also serves in identifying viable adaptation options especially for Africa, given its high vulnerability to adverse impacts of climate change (IPCC 2007, UNDP 2007, Niang et al 2014). In fact, almost two-thirds of African countries are dependent on rainfed agriculture (Chevallier 2010), which is often limited by scarce and highly variable water resources (Rockstrom et al 2014). Moreover, the ongoing population growth may further exacerbate the vulnerability of agricultural, farming and mixed crop-livestock systems, which are indispensable for the sustenance of predominantly smallholder livelihoods (Herrero et al 2008, FAO 2013). Even, most of sub-Saharan Africa has shown a drying trend over the last six decades (Tadross et al 2009, Wang et al 2018) and an increase in the inter-annual variability of precipitation during the last eleven decades (Sloat et al 2018). Likewise, several studies have demonstrated the detrimental effect of the projected future increase in temperature on maize (−5%), wheat (−17%), millet (−10%), sorghum (−15%; Knox et al 2012) and rice (−24%; van Oort and Zwart 2018) yields. A decline in meat and milk production has also been observed (Scholes et al 2015) due to a reduction in feed intake (3%–5% for each 1 °C; NRC, National Research Council 1981) and a projected decline in forage extent and quantity in African rangelands (Boone et al 2018). Hence, assessment of the suitability of adaptation strategies, such as improved water harvesting (Rockström and Falkenmark 2015), appropriate soil and nutrient management, and the diversification of crops, livestock and livelihoods (Thornton and Herrero 2014, Mango et al 2018), remains essential to enhance the resilience of agricultural systems. Furthermore, most of these strategies entail relevant mitigation co-benefits (Thornton and Herrero 2014). Overall, only adapted agriculture that pursues lower GHG emissions (i.e. 'climate-smart') and involves early-warning systems for climate extremes, will assure food security in the future.
Despite the socio-economic and environmental scenarios that project serious climate-related challenges in Africa, there is a lack of representative, systematic and harmonised ground observations across the continent (figure 1; Niang et al 2014, Kulmala 2018), which hampers the assessment of the relative role of Africa in the current global change paradigm.
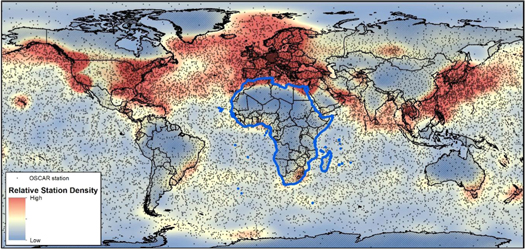
Figure 1. Worldwide distribution of stations listed in the Observing Systems Capability Analysis and Review tool (OSCAR) of the World Meteorological Organization (WMO) as in April 2018.
Download figure:
Standard image High-resolution imageIn this regard, environmental research infrastructures (RIs) play an indispensable role in generating the baseline knowledge needed to assess the drivers, impacts and feedback loops of climate change in the long-term (Hari et al 2016), to validate atmospheric inversions, satellite data and models (Peters et al 2017, Leip et al 2018), and to evaluate the suitability and success of already implemented adaptation and mitigation strategies (Rosenstock et al 2013, Franz et al 2018). In the present paper, we present the initial results of the EU H2020 funded project 'Supporting EU-African Cooperation on Research Infrastructures for Food Security and Greenhouse Gas Observations' (SEACRIFOG; more detailed information at www.seacrifog.eu), whose goal is to develop a roadmap towards a RI for the long-term observation of GHG dynamics, covering the variety of climates, land-cover types and management practices within the African continent. The design of this network will be tailored to the African context by ensuring that continent-specific ecosystems as well as their interactions with the local and global climate system will be captured with sufficient accuracy. Accordingly, the specific objectives addressed in this work are:
- (i)to highlight the need for an integrated RI to provide GHG and related environmental data with enhanced coverage across Africa;
- (ii)to outline the approach adopted and the respective first results towards the design of this RI, which includes stakeholder engagement, the definition of the conceptual monitoring framework through the selection of the essential set of variables to be measured, and an assessment of existing infrastructural capacity.
2. Material and methods
2.1. Stakeholders dialogue
Stakeholder involvement has become a common practice in interdisciplinary research projects (Mielke et al 2017, Ginige et al 2018) and in the context of SEACRIFOG it is crucial to ensure that African knowledge is integrated into the project framework. This process entails the following stages: (i) stakeholder identification and classification; (ii) selection; (iii) engagement; and (iv) co-production of results. The first step of stage (i) was to define the stakeholders' categories with highest stakes in the project: (1) academia, (2) research, (3) infrastructures, (4) farmers, (5) NGOs, (6) UN and international organisations, (7) governmental institutions and (8) private sector. Secondly, the main topics to be addressed in the dialogue with stakeholders were defined: GHG and climate observation, land use change, food security, climate-smart agriculture, capacity development and links with policy. Then an inventory with more than 100 potentially relevant stakeholders was compiled via web search and the project partners' networks. With the project consortium having a long history of partnership in Africa, this latter point proved crucial to enable effective and proactive stakeholder engagement. Finally, all identified stakeholders were classified according to the above categories and topics, as well as their geographical coverage (local, national, regional, global).
The key criterion for the stakeholders' selection (stage (ii)) was to balance the above classes in order to ensure equal representation of the different categories. Additional criteria were: presence of direct contacts within the consortium, stakeholders' responsiveness and gender balance. Further criteria were specifically adopted to facilitate the participation in the stakeholder workshops: joining already planned relevant events and inviting stakeholders preferably from the target geographical region of that event in order to minimise travel costs while maximising local expertise. The stakeholders' engagement and results co-production stages (iii and iv) started with the organisation of three regional Stakeholders Consultation Workshops, held in Nairobi (Kenya—East Africa, 31 May 2017), Sunyani (Ghana—West Africa, 16 June 2017) and Lusaka (Zambia—South Africa, 18 April 2018). The world café approach (Brown and Isaacs 2005, Palacios-Agundez et al 2013) was adopted to ensure a participative stakeholder dialogue and capacity knowledge co-production.
2.2. Selection of the essential set of variables to be monitored
In order to define the exact scope of the observation network to be designed, the preliminary set of 'essential variables' to be measured was established based on the conceptual framework shown in figure 2, in accordance to Bojinski et al (2014).
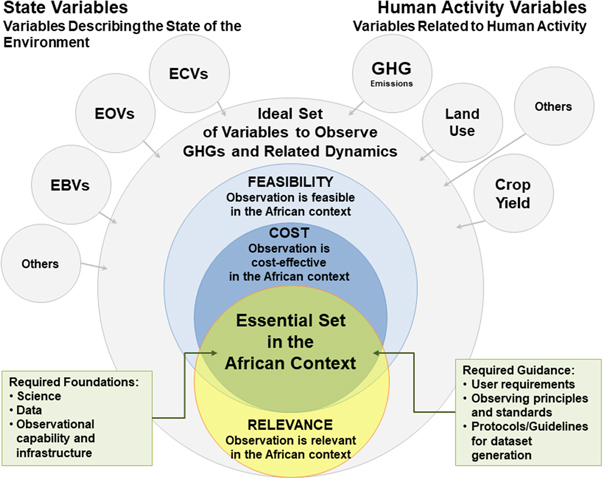
Figure 2. Conceptual framework describing the approach used to define the set of the 'essential variables' to be measured in order to observe greenhouse gas and related dynamics across the African continent. ©American Meteorological Society. Used with permission from Bojinski et al (2014).
Download figure:
Standard image High-resolution imageWith the aim of maximising interoperability and avoiding duplication of efforts, this approach was aligned with ongoing global RI initiatives by using the essential climate, oceanic and biodiversity variables (ECVs, EOVs and EBVs, respectively) already defined by the World Meteorological Organization (WMO), the Global Ocean Observing System (GOOS) and the Group On Earth Observations Biodiversity Observation Network, respectively. In a first step, the 'ideal' set of variables comprised the above-mentioned variable sets as well as other variables reflecting the abiotic, biotic and anthropogenic factors potentially affecting GHG dynamics over space and time. In a second step, the contributors were asked to rate each variable in the 'ideal' set against the assessment criteria based on the 'relevance', 'feasibility' and 'cost' of the systematic long-term observation of each variable across Africa. Subsequently, using these ratings, a composite score was computed for each variable, which would serve as a triangulated measure of the 'essentiality' of a variable, i.e. its relative importance in the context of GHG and climate observation and food security in Africa. To calculate the variable score, ordinal rating values ('Low', 'Medium', 'High') were translated into numerical values (1, 2, 3) and the arithmetic means were calculated for the three criteria from all ratings given. The variable score was then calculated as the unweighted sum of these means.
The variable selection process was undertaken in a participatory way, by gathering the expertise from the SEACRIFOG project consortium and the wider environmental observation community through an interactive web-tool (http://seacrifog-tool.sasscal.org/; see figure 1 in supplementary material available online at stacks.iop.org/ERL/13/085003/mmedia). This tool was written in the Shiny package of the R software environment and was specifically developed for the SEACRIFOG project to capture detailed definitions and available data products for each variable. Contributors were also able to nominate potentially relevant variables that were missing from the variable list which were subsequently rated against the assessment criteria. The variable assessment was based on a consultative process inviting the input from a total of 210 potential contributors. The variable score was computed from a total of 40 ratings by contributors who indicated their expertise in the terrestrial (65%), oceanic (35%) and/or atmospheric domain (20%). Overall, 45% of the contributors indicated that they are either from Africa or have conducted extensive research within Africa.
2.3. Inventory and assessment of current research infrastructures across the African continent
The current scheme of relevant RIs was assessed by compiling an inventory of existing and planned environmental observation networks across Africa and the surrounding oceans, which measure any of the identified variables of interest. These include ground-based, sea-borne, air-borne as well as space-borne observation infrastructures. The inventory was based on information from an initial literature web search, using keywords such as 'environmental monitoring in Africa' and 'GHG measurements', and also relevant research projects and expert consultations. As for the identification of variables, the collaborative web-tool was used to pool the expertise of the SEACRIFOG consortium and other stakeholders. For ground- and sea-based infrastructures, the location and operating status of all individual observation sites was captured where possible. This site-specific data allowed for subsequent analysis of the spatial coverage of observations to identify corresponding gaps and needs in terms of technical infrastructure. We further examined the distribution of the ground-based observation networks with regards to major natural (Olson et al 2001, https://worldwildlife.org/publications/terrestrial-ecoregions-of-the-world) and anthropogenic biomes (i.e. 'anthromes'; Ellis et al 2010, http://ecotope.org/anthromes/v2/data/) by cross-tabulating their spatial intersection using ArcGIS. The use of the latter allowed us to account for a disturbance gradient of natural ecosystems by representing the terrestrial biosphere in its contemporary, human-altered form. An important source of site data for a number of relevant global observation networks was the World Meteorological Organization's (WMO) Observing Systems Capability Analysis and Review Tool (OSCAR; https://oscar.wmo.int/surface/index.html). Other sources for site data were the websites of the respective networks (e.g. Aerosol Robotic Network, SASSCAL Weather Net) and direct expert information (e.g. Eddy Covariance Flux Stations). Since up-to-date information on the operating status of individual observing stations was not always accessible, the stations presented in all figures have thus been taken into consideration irrespective of their current individual operating status.
3. Results
3.1. Stakeholders dialogue
The engagement of key external stakeholders was crucial in order to tailor the development and implementation of the SEACRIFOG project to the identified fundamental issues of interest to these parties. The current state of (1) land use change implications for food security and climate-smart agriculture, (2) GHG observations, carbon stocks and climate change mitigation and (3) local capacity development in Africa, was discussed in three Stakeholder Consultation Workshops, attended by 72 participants (excluding the organisers) from 33 organisations (table 1).
Table 1. Synthesised information about the participants of the Stakeholder Consultation Workshops organised by the SEACRIFOG consortium (more detailed information can be found in table 1 of the supplementary material).
| Geographical coverage | Total number of stakeholders | Academia | Farmers | Governmental institution | Inter-governmental organisation | Non-governmental organisation | Research organisation | SEACRIFOG consortium | UN agency | UN programme | Total number of participants |
|---|---|---|---|---|---|---|---|---|---|---|---|
| Workshop 1 | 12 | 14 | 26 | ||||||||
| Ethiopia | 1 | 1 | |||||||||
| Finland | 2 | 2 | |||||||||
| Germany | 1 | 1 | |||||||||
| Global | 4 | 1 | 2 | 1 | 4 | ||||||
| Italy | 2 | 2 | |||||||||
| Kenya | 7 | 3 | 2 | 3 | 2 | 10 | |||||
| Namibia—Southern Africa (regional) | 1 | 1 | |||||||||
| Norway | 2 | 2 | |||||||||
| Regional | 1 | 1 | 1 | ||||||||
| South Africa | 1 | 1 | |||||||||
| Sweden | 1 | 1 | |||||||||
| Workshop 2 | 31 | 6 | 37 | ||||||||
| Czech Republic | 2 | 2 | |||||||||
| Finland | 1 | 1 | |||||||||
| Ghana | 28 | 18 | 5 | 5 | 1 | 29 | |||||
| Burkina Faso | 1 | 1 | |||||||||
| Italy | 1 | 11 | |||||||||
| Kenya | 2 | 2 | 2 | ||||||||
| Uganda | 1 | 1 | 1 | ||||||||
| Workshop 3 | 29 | 7 | 36 | ||||||||
| Angola | 2 | 2 | 2 | ||||||||
| Botswana | 3 | 3 | 3 | ||||||||
| Czech Republic | 2 | 2 | |||||||||
| Finland | 1 | 1 | |||||||||
| Germany | 2 | 2 | 1 | 3 | |||||||
| Italy | 1 | 1 | |||||||||
| Namibia | 3 | 2 | 1 | 3 | |||||||
| Namibia—Southern Africa (regional) | 2 | 2 | |||||||||
| South Africa | 1 | 1 | 1 | ||||||||
| Zambia | 18 | 14 | 2 | 2 | 18 | ||||||
| Total | 72 | 99 | |||||||||
The most prominent issues raised concerned data and metadata: availability, accessibility, usability, interoperability, resolution, format and quality. Additionally, the importance of sharing data and knowledge (i.e. methodological guidance and research results) was repeatedly raised by respondents, emphasising the need to develop not only technologies and RIs, but also strong, collaborative and proactive networking at different levels. Adaptation more than mitigation was confirmed to be a priority for Africa. Beside the scientific and technical aspects, the solution to most of the constraints could be a comprehensive approach able to consider not only scientific and ecological issues but also socio-economic dynamics (land tenure, urbanisation, jobs opportunities, market, prices, investments, etc), which may influence the success and the long-term sustainability of a RI network. Science alone is not always enough, thus mediation among scientists, traditional leaders and agriculture extension officers could help in facing some of the crucial practical aspects towards implementation. A coherent and thorough analysis and prioritisation of all these issues can therefore help in developing a range of options suitable for specific 'on field' conditions (at national or regional levels). Among the possible options, the developed countries' approach for an RI network on GHG observations was recognised as not being directly applicable to Africa, for different reasons, of which the most important are: high costs for implementation and maintenance, lack of qualified personnel and specialised companies, problems with energy supply, accessibility and protection of field sites, and challenging eco-climatic conditions.
3.2. Selection of the essential set of variables to be monitored
The aim of compiling an 'ideal' variable set was to identify all variables potentially relevant for the comprehensive understanding and quantification of GHG fluxes and its direct and indirect links with food security across the African continent. The 'essential' set is a subset of this 'ideal' set and is meant to adequately capture the major dimensions of environmental change in each realm (terrestrial, atmospheric, oceanic). Figure 3 lists all 89 variables which were nominated as part of the 'ideal' set as well as the outcome of their assessment represented by their respective score (in parentheses behind the variable name). Note that, in many cases, the variables comprise several 'sub-variables' that can be directly measured, so they could be considered as variable classes. Based on the rating score, a preliminary set of 'essential variables' for the long-term observation of GHG dynamics across Africa was defined as follows: all variables which either have a score higher than 66 and a minimum average relevance of 2 ('medium') or have a relevance of 2.5 ('medium to high') and higher. According to these parameters, the outcome is an indicative set of 42 variables (see variables in bold font in figure 3).
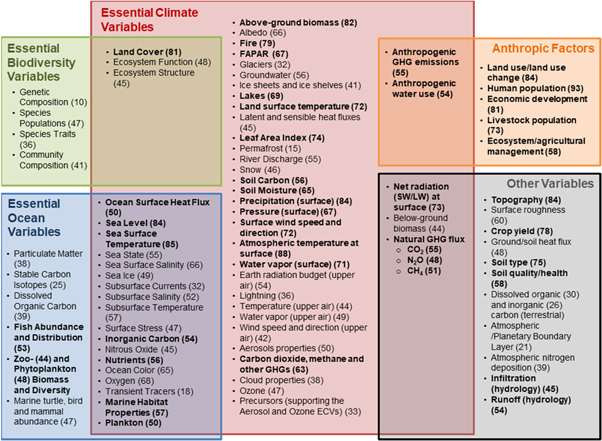
Figure 3. Indicative list of all candidate variables proposed and their assessment score (in parentheses) resulting from the consultative rating process. The preliminary set of 'essential variables' is highlighted in bold font.
Download figure:
Standard image High-resolution imageThe indicative 'essential' variable set was considered as a first iteration of a disciplined ongoing process, as has been the case for ECVs and EBVs. Following this analysis, the 'essential' variable set will be subject to a 'stress-test' by soliciting targeted feedback from established experts, networks and user groups. A second measure of variable prioritisation will further be added by assessing each variable in the context of its contribution to Africa's overall GHG budget. The greater the magnitude and uncertainty with regards to the GHG budget contribution of a given variable, the higher the assigned priority of corresponding observations. The aim for the observation network to be designed is to determine the African GHG budget with the same or lower uncertainty as currently available for similar continental-scale regions.
3.3. Inventory and assessment of current research infrastructures across the African continent
A total of 47 existing and planned environmental infrastructures were identified at time of submission (see table 2 of the supplementary material for more detailed information), together with their observational stations when applicable and available (figures 4–6).
Table 2. Number of stations and station density (per 10 000 km2) per biome on the African continent for the networks considered in figures 5(a) and (b). Corresponding figures were obtained by cross-tabulating the spatial intersection between biomes and stations using ArcGIS.
| Biome | Area (km2) | N. GHG and aerosol stations | GHG and aerosol station density | N. Weather stations | Weather station density |
|---|---|---|---|---|---|
| Temperate coniferous forests | 21 764 | 2 | 0.919 | 5 | 2.297 |
| Montane grasslands and shrublands | 857 684 | 19 | 0.222 | 110 | 1.283 |
| Flooded grasslands and savannas | 553 912 | 10 | 0.181 | 42 | 0.758 |
| Mediterranean forests, woodlands, and scrub | 842 758 | 14 | 0.166 | 145 | 1.721 |
| Mangroves | 66 626 | 1 | 0.150 | 14 | 2.101 |
| Tropical and subtropical dry broadleaf forests | 191 222 | 2 | 0.105 | 10 | 0.523 |
| Tropical and subtropical moist broadleaf forests | 3455 531 | 26 | 0.075 | 168 | 0.486 |
| Tropical and subtropical grasslands, savannas, and shrublands | 13 948 474 | 96 | 0.069 | 560 | 0.401 |
| Lakes | 154 730 | 1 | 0.065 | — | |
| Deserts and xeric shrublands | 9780 796 | 44 | 0.045 | 274 | 0.280 |
| Totals | 29 873 496 | 215 | 1328 |
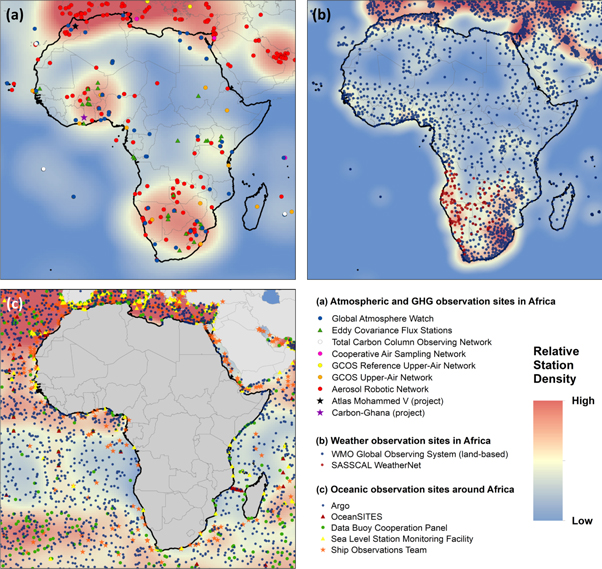
Figure 4. Observational stations of selected networks and their relative density for (a) ground-based atmospheric and greenhouse gas, (b) ground-based meteorological and (c) oceanic observation on and around the African continent. More detailed information of the represented networks can be found in table 2 of the supplementary material. The heatmaps are based on kernel density estimations of all stations of the considered networks within a bounding box of 40 to −40 degrees latitude and −50 to 80 degrees longitude. Note that the operational status of each station has not been taken into account since this information was not available for all networks. The source for the station data for most of the networks is the WMO's OSCAR tool.
Download figure:
Standard image High-resolution image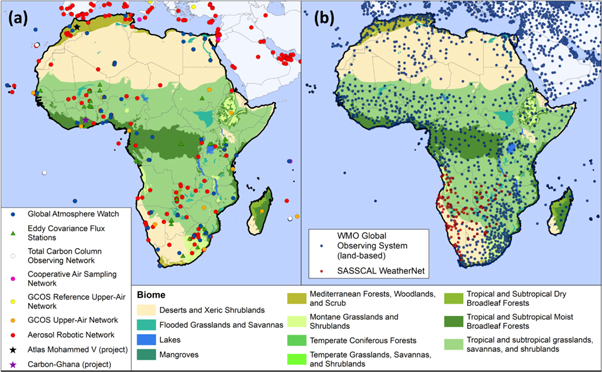
Figure 5. Observing stations of selected networks for (a) GHG and aerosols and (b) weather observation against the major biomes (Olson et al 2001) of the African continent. The source for the station data for most of the networks is the WMO's OSCAR tool.
Download figure:
Standard image High-resolution image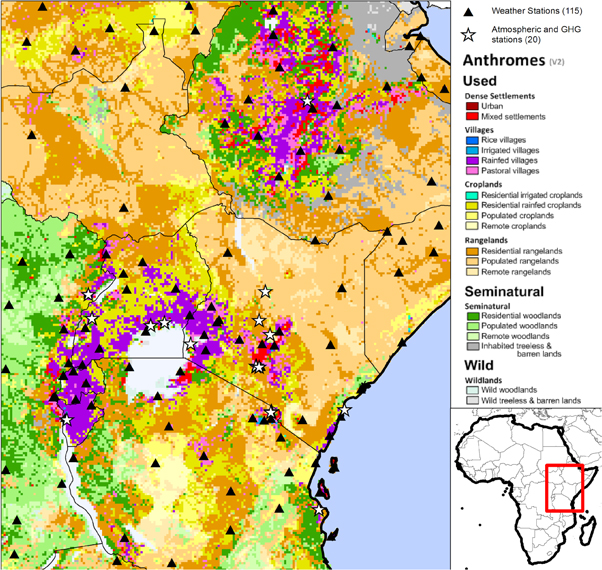
Figure 6. Observational stations of selected networks for atmospheric and greenhouse gases observation against the main anthromes (Ellis et al 2010) in East Africa. The source for the station data for most of the networks is the WMO's OSCAR tool.
Download figure:
Standard image High-resolution image
Figure 4(a) depicts the stations of various networks for GHG and aerosol observations across Africa. Among these, the Global Atmosphere Watch (GAW) and the Aerosol Robotic Network (Aeronet) are two important global networks for the ground-based measurement of the atmospheric composition. Both networks have stations across Africa, but their distribution is uneven and geographically sparse, with a relatively high station density in West and Southern Africa. The overall density of GAW stations in Africa is almost 25 times lower than in Europe, and is possibly even lower when accounting for the operational status of the stations. For example, out of 53 GAW stations on the continent depicted in figure 4(a), only 19 were operational in April 2018, most of which were located in North Africa, particularly Egypt. The inventory of GHG flux stations in Africa returned a similar trend. The inventory of eddy covariance (EC) stations (green triangles in figure 4(a)) were derived from the FLUXNET (6 stations) and the European Fluxes Database Cluster (20 stations), with a further 13 stations identified from the expert consultation. Currently, a total of eleven active EC stations are recording flux data across Africa, with eight of them located in South Africa. A further three stations are planned in DR Congo and Kenya, while there are 23 inactive stations, most of which were associated with the CarboAfrica project (2006–2010).
Figure 4(b) depicts the land-based stations of the WMO's Global Observing System, which is derived from the National Meteorological and Hydrological Services of WMO Members, as well as the SASSCAL Weather Net network in Southern Africa. Overall, although long time series of meteorological data are crucial in the context of climate change research, meteorological observations also show a strong bias towards Southern Africa. With regards to oceanic observations, figure 4(c) illustrates that, compared to the Mediterranean Sea, the oceans surrounding the African continent are only sparsely monitored by the global oceanic observation networks identified in this study.
In summary, the above indicates that the density of environmental observation stations across Africa is not only relatively low, but also has major spatial and temporal limitations. To be able to further assess inter-annual variability and long-term trends, which are crucial for understanding the processes, drivers and patterns of GHG dynamics, a more robust and structured approach is needed.
When considering the number of stations in each biome across the continent (see figure 5), it becomes apparent that some of the smaller biomes such as mangroves have very limited observations and that, overall, only few stations are located in each biome, particularly for GHG and aerosol observation. Furthermore, considering the significance of tropical and subtropical moist broadleaf forests as a continental and global carbon sink (Valentini et al 2014), the density of corresponding stations is very low. These observations are quantified in table 2 below, which lists the number of stations and average station densities for the entire African continent per biome based on their spatial intersection.
Figure 6 depicts the station distribution of the considered networks for the case of East Africa, indicating an increased density of stations in, or in vicinity of areas with high human impact such as settlements and villages. In order to verify this impression quantitatively, we analysed the spatial intersection between stations and anthromes across the entire landmass of Africa to determine the number of stations per anthrome. The results are presented in table 3. Both the degree of human disturbance and the corresponding stations densities decrease moving down the table, confirming for both GHG/aerosol and meteorological observing stations the positive correlation between station density and the degree of human disturbance. In turn, one can argue that low- or undisturbed ecosystems are understudied, leading to a higher uncertainty regarding their role in the African GHG budget.
Table 3. Number of stations and station density (per 10 000 km2) per anthrome (Ellis et al 2010) for the networks considered in figures 5(a) and (b). Corresponding figures were obtained by cross-tabulating the spatial intersection between anthromes and stations using ArcGIS.
| Anthrome | Area (km2) | N. GHG and aerosol stations | GHG and aerosol station density | N. Weather stations | Weather station density |
|---|---|---|---|---|---|
| DENSE SETTLEMENTS | 181 091 | 32 | 1.767 | 180 | 9.94 |
| Urban | 40 570 | 28 | 6.90 | 117 | 28.84 |
| Mixed settlements | 140 521 | 4 | 0.28 | 63 | 4.48 |
| VILLAGES | 1127 592 | 37 | 0.33 | 319 | 2.83 |
| Rice villages | 478 | 0.00 | 0.00 | ||
| Irrigated villages | 76 039 | 3 | 0.39 | 37 | 4.87 |
| Rainfed villages | 751 622 | 22 | 0.29 | 132 | 1.76 |
| Pastoral villages | 299 453 | 12 | 0.40 | 150 | 5.01 |
| CROPLANDS | 3176 498 | 38 | 0.12 | 159 | 0.50 |
| Residential irrigated cropland | 74 285 | 3 | 0.40 | 20 | 2.69 |
| Residential rainfed croplands | 2247 851 | 22 | 0.10 | 125 | 0.56 |
| Populated croplands | 704 914 | 5 | 0.07 | 8 | 0.11 |
| Remote croplands | 149 448 | 8 | 0.54 | 6 | 0.40 |
| RANGELANDS | 11 745 700 | 60 | 0.05 | 429 | 0.37 |
| Residential rangelands | 3987 659 | 22 | 0.06 | 238 | 0.60 |
| Populated rangelands | 5260 394 | 26 | 0.05 | 124 | 0.24 |
| Remote rangelands | 2497 647 | 12 | 0.05 | 67 | 0.27 |
| SEMINATURAL | 6151 580 | 31 | 0.05 | 147 | 0.24 |
| Residential woodlands | 1611 084 | 8 | 0.05 | 56 | 0.35 |
| Populated woodlands | 2279 254 | 5 | 0.02 | 32 | 0.14 |
| Remote woodlands | 459 980 | 1 | 0.02 | 6 | 0.13 |
| Inhabited treeless and barren | 1801 261 | 17 | 0.09 | 53 | 0.29 |
| WILDLANDS | 7360 073 | 15 | 0.02 | 84 | 0.11 |
| Wild woodlands | 352 377 | 3 | 0.09 | 5 | 0.14 |
| Wild treeless and barren lands | 7007 695 | 12 | 0.02 | 79 | 0.11 |
| TOTALS | 29 742 533 | 213 | 1318 |
4. Discussion
Our results illustrate the ongoing work of the SEACRIFOG project towards the development of an explicit concept of a pan-African GHG observation network. The involvement of relevant stakeholders (section 3.1) will ensure that the future network will serve to address the main African societal and scientific challenges. However, one important stakeholder group that were underrepresented in this consultation dialogue was the private sector, due to difficulties in generating its engagement. This requires a different and more targeted approach that will be part of the future activities of the SEACRIFOG project in order to derive input from this important stakeholder category. The preliminary selection of essential variables (section 3.2) forms the framework from which a harmonised and standardised research network can be developed. Finally, the inventory of existing and planned networks (section 3.3) allows for the assessment of the current RIs needs and gaps in Africa, and forms the starting point for a potential cross-domain synergy among existing and planned networks at regional, continental and global scales. However, the identification of the RIs' nature and status was challenging since many of the regional and local networks correspond to independent projects and the available information was generally limited and heterogeneous.
The above assessment of established African networks (figures 4–6; tables 2 and 3) provides significant evidence of the gaps in the observational capacity in Africa, and this knowledge will enhance the design of a fundamental continental GHG observation system that is coherent and integrated with existing ground-based regional (e.g. SAEON, SASSCAL ON; see table 2 in supplementary material) and global (e.g. GCOS, GOOS) initiatives. In fact, we have pursued the alignment with global RIs by using the worldwide-agreed ECVs, EOVs, and EBVs, and by considering the observing network design principles set by the World Meteorological Organization (WMO 2017). Furthermore, the implementation of any future network will need to unite efforts from independent research projects across the continent while addressing the usual limited lifetime of such activities, based on specific research questions and funding mechanisms. For instance, in South Africa a follow-up project to ARS AfricaE (https://ars-africae.org) named EMSAfrica (Ecosystem Management Support for climate change in Southern Africa) is intending to transfer the RIs associated with these projects into the Expanded Freshwater and Terrestrial Environmental Observation Network (EFTEON) under the framework of SAEON (South African Environmental Observation Network). In general, a federated RI will allow the operational costs to be shared and will increase the resilience of the RI through the acquisition of (meta)data that can be replicated based on a standard architecture for all monitored variables (e.g. temporal coverage, location or spatial coverage), in order to assure interoperability among the integrated networks. An integrated approach to RI network design and maintenance remains crucial in the context of limited long-term economic and technological support, as it allows a RI to expand from the initial fundamental measurement nodes, and over time, increase the observational capacity as funding and management mechanisms allow.
The future work of the SEACRIFOG consortium will focus on a sustained dialogue with relevant stakeholders through the creation of a permanent stakeholder board to identify and utilise any potential funding and operational synergy with already existing initiatives. Furthermore, the definitive set of 'essential variables' will be thoroughly evaluated against the availability of information from related networks and data products. Corresponding standardised methodological protocols will be gathered or produced to harmonise and standardise the measurement of all essential variables in the African context. The development of these protocols will be based on measurement requirements set by the international RI community (e.g. GCOS), those already published or in preparation (e.g. ICOS, SAMPLES, RAINFOR-GEM) and peer-reviewed articles (e.g. Wanyama et al 2018). The outcomes (i.e. essential variables and related RIs, data products and protocols) will be disseminated via the SEACRIFOG web-tool, webinars and workshops that will take place in Africa. Following this, a continental-scale atmospheric transport model, constrained by emission-surface priors and existing observations, will be run to suggest the optimal spatial distribution of that set of observations (Nickless et al 2015). A cost-effectiveness assessment will be then performed based on the desired accuracy and the required spatial and temporal resolution of the future network. A portfolio of observation techniques will then be developed from the compendium, to satisfy total cost and overall accuracy criteria, based on approaches developed for optimising the mix of technologies in energy systems (e.g. Cai et al 2009). The interoperability of the designed research data infrastructure will be based on a portfolio of metadata and data standards for the selected 'essential variables'.
The main challenges for the implementation of a consolidated RI for GHG observations across the vast territory of the African continent in the long-term will be the sustainable development of local capacity, the basic infrastructure assurance (e.g. energy supply) and the concept adaptation of already existing RIs in Europe or North America (e.g. ICOS, NEON) to Africa. However, the long-term success of this RI will ultimately rely on its sustained funding. The benefits of a future GHG observation RI in Africa stem from both scientific and socio-economical dimensions. On one hand, standardised in situ observations will contribute to the reduction of uncertainty associated with African and global GHG budgets, and in model development and validation while complementing existing global RIs. On the other hand, the resulting data will be crucial to support the design of early-warning systems as well as suitable mitigation and adaptation strategies that would contribute to food, nutrition and economic security for African populations, which in turn could provide financial incentives in the context of the global Environmental Carbon Market (UNFCCC). Furthermore, this RI will serve the international policy commitment of UNFCCC and the EU to support developing countries towards the accomplishment of their National Determined Contributions under the Paris Climate Agreement (COP21) and the achievement of the Sustainable Development Goals.
Acknowledgments
This work was entirely funded by the European Commission through the project 'Supporting EU-African Cooperation on Research Infrastructures for Food Security and Greenhouse Gas Observations' (SEACRIFOG; project ID 730995). Acknowledgement is also given to the German Federal Ministry of Education and Research (BMBF) for contributing to this research by supporting SASSCAL and to the Ministry of Education, Youth and Sports of Czech Republic to partially support the presented work within the National Sustainability Program I (NPU I), grant number LO1415 and project 'Completion of the research infrastructure CzeCOS to increase international quality of research of the global climate change impacts on ecosystem processes' (grant number CZ.02.1.01/0.0/0.0/16_013/0001609). We also thank the anonymous reviewers whose suggestions improved this manuscript. Lutz Merbold acknowledges support received via the CGIAR Research Program on Climate Change, Agriculture and Food Security (CCAFS) and the Research Program on Livestock, which are carried out with support from CGIAR Fund Donors and through bilateral funding agreements. For details please visit https://ccafs.cgiar.org/donors. The views expressed in this document cannot be taken to reflect the official opinions of these organizations. The authors have no conflicts of interest to declare.