

Abstract
Road freight transportation accounts for around 7% of total world energy-related carbon dioxide emissions. With the appropriate incentives, energy savings and emissions reductions can be achieved by shifting freight to rail or water modes, both of which are far more efficient than road. We briefly introduce five general strategies for decarbonizing freight transportation, and then focus on the literature and data relevant to estimating the global decarbonization potential through modal shift. We compare freight activity (in tonne-km) by mode for every country where data are available. We also describe major intraregional freight corridors, their modal structure, and their infrastructure needs. We find that the current world road and rail modal split is around 60:40. Most countries are experiencing strong growth in road freight and a shift from rail to road. Rail intermodal transportation holds great potential for replacing carbon-intense and fast-growing road freight, but it is essential to have a targeted design of freight systems, particularly in developing countries. Modal shift can be promoted by policies targeting infrastructure investments and internalizing external costs of road freight, but we find that not many countries have such policies in place. We identify research needs for decarbonizing the freight transportation sector both through improvements in the efficiency of individual modes and through new physical and institutional infrastructure that can support modal shift.
Export citation and abstract BibTeX RIS

Original content from this work may be used under the terms of the Creative Commons Attribution 3.0 licence.
Any further distribution of this work must maintain attribution to the author(s) and the title of the work, journal citation and DOI.
1. Introduction
To restrict the increase in global temperatures to less than 2 °C above preindustrial levels, rapid decarbonization of the global economy is necessary [1, 2]. The share of global greenhouse gas (GHG) emissions from transportation is rising, with oil demand in the transportation sector accounting for about 22% of global energy-related carbon dioxide (CO2) emissions in 2015 [3]. The International Energy Agency (IEA) estimates that road freight alone contributed 7% of total world energy-related CO2 emissions in 2015 [3], more than twice the total emissions from aviation [4]. There have been few systematic studies of deep decarbonization options for global and intraregional freight transport [5] and little political effort to mitigate GHG emissions from freight transportation [6]. For example, only four countries, the United States (US), Canada, China and Japan, regulate the fuel economy of heavy-duty vehicles. The European Union (EU) is currently developing such standards [3]. On the other hand, many countries have standards for particulate matter (PM) emissions, and these standards provide an incentive to improve fuel economy. The Nationally Appropriate Mitigation Actions, submitted to the United Nations Framework Convention on Climate Change by developing countries, also lack proposals that target the transportation sector [7]. While some modal shift measures in transportation have been included in Nationally Determined Contributions, proposals are heavily skewed towards passenger transportation [8].
In this paper, we focus specifically on road freight, which has a large and growing share of freight activity in most countries [3, 9], and we explore the potential for modal shift as a decarbonization strategy. We emphasize that the deep decarbonization of the freight sector can only be achieved by combining modal shift with multiple other strategies such as energy efficiency, switching to fuels with low or net zero carbon emissions, and improving operational efficiency. Many such changes are unlikely to occur without top-down or other policies to reduce emissions. We also discuss potential interactions and adverse effects of combining these strategies. Across the developing world, and in parts of the developed world, a key barrier to identifying opportunities for the adoption and deployment of modal shift and intermodal transport is the lack of sufficiently granular high-quality freight data. Governments collect data on country-specific freight activities, and international organizations such as the IEA, OECD [10] and the World Bank [11] gather national statistics, but data collection is sparse and inconsistent, with the exception of some important efforts from the IEA [3]. For this review, we created a database of freight activity between 2000 and 2017 for every country where data are available.
To our knowledge, this is the first comprehensive review of the modal shares of intraregional freight activities and the potential for modal shift in transport systems globally. We are aware of similar reviews with a regional focus, such as by the US Department of Energy (DOE) [12] and by Woodburn et al (2007) [13] and Hoen et al (2013) for Europe [14]. A 2001 report by the OECD took a global perspective on intermodal freight [15] and a United Nations report from 2015 included a chapter on modal shift [16].
We begin by introducing five general strategies to decarbonize global freight transport. After an overview of trends in freight transportation and the global modal structure, we provide an in-depth review of studies of the theoretical aspects of modal shift. We identify which factors influence shippers' mode choices, and we discuss the greatest barriers to increasing the share of rail, water and intermodal freight transportation. We conclude that discussion with an overview of strategies to promote modal shift. We then describe freight transportation systems and modal shift policies in specific regions of the world, including major intraregional freight corridors, their modal share, and their infrastructure needs. We conclude the review by summarizing existing estimates of the potential for modal shift.
We exclude ocean shipping, because fuel use and emissions from ocean shipping have been well studied and analyzed within the limitations of the available data [17]. We also only briefly discuss air transport of freight because it represents a small proportion of total emissions from transport, and offers limited opportunities for modal shift.
2. General strategies to decarbonize freight
Here we introduce five broad strategies to decarbonize road freight, which we describe below, using the same taxonomy as McKinnon (2016) [18]. These are: (1) reducing the demand for freight; (2) optimizing vehicle use and loading; (3) increasing the efficiency of freight vehicles; (4) reducing the carbon content of fuel used to transport freight; and (5) shifting freight to low carbon-intensity modes. Below we discuss each of these strategies.
2.1. Strategy 1: reducing the demand for freight transport
There is a strong relationship between the growth of freight activity and economic growth [9, 19, 20]. To the extent that this relationship is causal, this makes it difficult to lower the total demand for freight transportation. Inland freight transport is moreover of enormous importance to economic development of low-income countries [16, 21, 22]. While in the past freight demand grew much faster than the gross domestic product (GDP), the elasticity of trade and GDP is likely to be closer to one in the long term [18]. While there is some evidence of moderate decoupling of total freight activity and GDP in a few developed countries [9, 23], there is no decoupling of road freight activity and GDP [3, 9]. Furthermore, the demand for freight transportation is relatively inelastic to fuel prices [24, 25], suggesting that modest price signals may not induce much reduction in total freight activity. For example, a meta-analysis by de Jong et al [26] concluded that a 1% rise in fuel price reduces fuel demand by 0.2%–0.6%, vehicle kilometers by 0.1%–0.3%, and transport activity by 0.05%–0.3%.
Another strategy to reduce demand for road freight would be structural changes in supply chain management [18]. Such strategies would entail changes in the production location, in the origin-destination pattern in a supply chain, a reduction of demand for the goods being consumed, and novel production technologies [26]. For example, additive manufacturing (AM), which creates parts by depositing material layer by layer [27], can produce light, hollow products with intricate internal structures to give them strength. As such, it can reduce transport work by making both products [28 ] and vehicles lighter [29]. Some have argued that it can reduce the distances over which materials and products are transported, by stimulating localized production [30], but it faces issues with economies of scale, fabrication speed, and quality control [31]. Some estimates have suggested that AM could eventually account for less than 5% of total manufacturing output by value [32, 33] and reduce carbon dioxide emissions by less than 1% [34 ].
Many recent trends in supply chain management, such as just-in-time production, centralization of inventory, spatially fragmented production, and global trade and procurement, have led to an increase, rather than a decrease, in transportation demand [18, 21, 35].
2.2. Strategy 2: optimizing vehicle use and loading
Efficiency gains can be achieved by making better use of modal capacity. This includes efficient routing and supply-chain collaboration, backhauling (less empty runs), more efficient packing, and raising the legal limits for high-capacity vehicles in the trucking sector [3, 18]. Higher efficiency might also be achieved by lowering speeds, as has been the case with ocean shipping [17], and training drivers to reduce idling and drive more efficiently. The IEA has provided a detailed review of these systemic improvements in the road freight sector and their potential for reducing GHG emissions [3].
2.3. Strategy 3: increasing the efficiency of freight vehicles
In figure 1, we summarize reported estimates of the average carbon intensity (in gCO2 per tkm) for different regions and modes. Naturally, these estimates have uncertainty associated with them and depend on the assumptions made. For example, for road vehicles, these estimates will depend on age, fuel type, payload, terrain, driving patterns and other factors. We find that overall rail and inland water freight modes are much less carbon intensive than road for all regions, and that inland water transport is more carbon intensive than rail in most regions. Shipping on inland waterways is typically also more carbon intensive than ocean shipping [5]. For carbon intensities of different types of vehicles without a regional specification we refer the reader to the Fifth Assessment Report of the Intergovernmental Panel on Climate Change (table 8.3) [5]. In the next sections we provide more detail regarding the carbon intensity and the technological emissions reduction potentials associated with each mode.

Figure 1. Carbon intensity of surface freight modes in different regions. Each marker represents an average estimate for the region or a country in that region from a different data source (refer to supplementary materials for values and sources). Road carbon intensity values distinguish medium- and heavy-duty vehicles. We do not differentiate sources that report life-cycle emissions from those reporting tailpipe emissions as this difference is well within the uncertainty.
Download figure:
Standard image High-resolution image2.3.1. Road freight
Despite the uncertainty across the studies in figure 1, we find that the range of road freight energy intensities varies between regions. This has to do with economic, geographic and infrastructure constraints that determine which vehicles are in use. For a detailed review on heavy-duty vehicle technology and utilization we refer the reader to [3, 36, 37].
The US National Academies of Science, Engineering and Medicine (NASEM) [36, 38] has performed several assessments regarding the medium and heavy-duty sector in the US. In its 2010 study, the Academies suggest that a series of vehicle technologies—ranging from improvements in aerodynamics to the use of low rolling resistance tires—could reduce fuel consumption for US trucks by up to 15%. Improvements to diesel engines could reduce fuel consumption by up to 20%, and a shift to hybrid drive trains could halve it. The actual savings and the cost of achieving them would depend on the size and function of the vehicle. A recent report by the IEA [3] concludes that the energy intensity of trucks could be reduced by 34% by 2050, relative to a business-as-usual reference scenario.
Another strategy for decarbonizing road freight is by electrification using batteries, hydrogen fuel cells, or electrified roadways. However, due to the relatively low energy density of current battery technologies, electrification with batteries is only feasible for freight vehicles that have short ranges [3]. Indeed, Sripad and Viswanathan [39] find that the cost of a lithium-ion battery pack that gives a large truck (i.e. with a payload of up to 16 tons) a range of 300 miles on a single charge would cost more than US$160 000. By comparison, a diesel-powered semi-truck costs US$120 000. Guttenberg et al find that, if seven trucks—each one eight feet behind the other—were to travel in a platoon, the range would be extended to 800 miles on a single charge [40].
Electrified roadways include overhead catenary lines, tracks in the road, and inductive transfer of power, which can be combined with other electric powertrain technologies [3]. All systems require additional receiving technology in the vehicle. In partnership with Siemens and several automobile companies, Germany, Sweden and the US are currently testing this technology [41], and a number of other projects are underway in Germany and Sweden [42, 43]. This strategy would only likely be applicable in short corridors with high traffic density and requires considerable investments. The electrification of a one-mile stretch of a road near the Port of Los Angeles cost US$13 million and costs for electrifying a Swedish highway are estimated to around one million euro per kilometer [44].
In the United States and Europe, the transport work done by a truck falls substantially after four to six years [45]. However, old trucks remain in service, and may even enter heavy service in secondary markets if they are sold abroad. As such, in the absence of a policy intervention, new technology may diffuse across the fleet much more slowly than it is introduced.
There are also several important barriers to the adoption of efficient technologies, such as many users wanting a payback of less than two years, lack of access to high upfront capital, lack of information; and doubt regarding the reliability and safety of new technologies [3, 45, 46]. For example, the uncertainty in exploring new technology options has been a market barrier for small fleet shippers (fleet size <20) [46], which make up over 97% of all US trucking fleets [47].
2.3.2. Rail freight
Much of the world's rail system is already electrified [5] and thus its potential for decarbonization is closely tied to the decarbonization of the electricity sector. A big exception is the US, where diesel-electric locomotives are used on virtually all freight routes. Hoffrichter et al estimate that the well-to-wheel emissions from the diesel electric locomotives currently in use in the US are 1.02 kg CO2 per kWh of tractive energy delivered, while emissions from electrified locomotives powered by the US grid in 2008 would have been 0.9 kg per kWh [48]. The current US grid is around 20% cleaner than in 2008 [49], and the benefit of a shift to electric traction would be correspondingly greater. However, in countries like the US with very long haul routes, the economics of electrification are not attractive as long as there are no limits on GHG emissions [50].
The Norwegian research organization SINTEF has conducted an assessment of hydrogen and battery-operated alternatives to conventional electrification and concluded that hydrogen or hydrogen-hybrid propulsion would provide a factor of two lower cost solution than installing catenaries on the remaining un-electrified lines in Norway [51]. While somewhat more expensive, in this case, large battery storage units (with reroute replacement/recharge) also dominated electrification in that application.
2.3.3. Inland waterways and coastal shipping
While the average carbon intensity for water shipments is lower than that for road shipments, small vessels carrying less than 250 tons of non-bulk cargo have GHG intensities that are similar to, or higher than, that of trucks [52, 5]. Much of the developing world relies on small vessels for freight transportation [53, 54].
Some zero-cost operational measures may be able to reduce fuel use by up to 33% [55]. Geertsma et al have reviewed a number of mechanical-electric hybrid propulsion technologies, and conclude that they could reduce fuel use by 10%–35% [56]. Vessels that use electrochemical storage in the form of electric batteries have been used for operations with limited ranges [57, 58]. Belgium and the Netherlands plan to bring fully electric and autonomous container barges into operation in 2018 [59].
2.3.4. Air freight
Air freight only handles a small portion of the total freight activity in tonne-km, focusing on high-value and time-sensitive goods [12]. Strategies to reduce emissions from air freight overlap with those for passenger air transport, since a large part of air freight is transported by passenger aircraft [60, 61] and most freight aircraft are minor variants of passenger aircraft.
Schäfer et al [4] find that, for narrow body aircraft, cost-effective measures can reduce emissions by about 20%. Several of these measures such as winglets are already being deployed. Since the dawn of the jet age, aircraft engines have reduced specific fuel consumption by 70%. A recent NASEM study concluded that the overall efficiency of gas turbine engines could be increased by up to 30% relative to the best engines in service today [62]. However, further efficiency gains will likely require a significant change in aircraft configuration [62, 63]. Both US and European agencies aim to produce practical designs that reduce fuel burn by 70% compared to current aircraft by mid-century. Few of the designs developed in response to these goals are likely to achieve them, even after assuming significant breakthroughs in technology, regulatory posture, and customer preferences. Concepts include combinations of laminar flow, open rotors, unswept wings, wing-body hybrids, aeroelastic control surfaces, lower cruise speeds, and hybrid turbo-electric propulsion [64]. It is unlikely that industry will be able to produce motors and generators with sufficient power density (measured in kilowatts per kg) to propel large electric transport aircraft for at least the next two decades, nor is it likely that batteries with sufficient energy density (in kilowatt-hours per kg) will be available [62]. Given the extraordinarily high levels of safety demanded by the flying public, industry and regulators are cautious about introducing new technologies [65, 66].
2.4. Strategy 4: reducing the carbon content of fuel used to transport freight
Low-carbon liquid fuels could help achieve decarbonization of long-haul freight, shipping, and aviation. Drop-in fuels that have characteristics similar to the fuels they replace would avoid the need to rebuild fuel storage and distribution infrastructure, and the need to redesign engines. However, absent a breakthrough in electrofuels or artificial photosynthesis [67] (that is, devising a technology to use sunlight to reduce carbon dioxide to produce sugars and eventually hydrocarbons [68]), pathways to a low-carbon drop-in liquid fuel are constrained by cost [3, 69, 70] and materiality. In the case of biomass fuels, keeping lifecycle greenhouse gas emissions low requires minimal land use change, which in turn limits the volume of low-emissions fuel that can be produced [69, 71, 72]. Many alternative fuel pathways, including those that use captured CO2, require the conversion of carbohydrates to hydrocarbons by hydrogenation [62, 73]. The cost of producing hydrogen and the feasibility of doing so without releasing CO2 constrains the options. It is also technically difficult to build an infrastructure to safely store and transport molecular hydrogen [74].
Farrell et al [75] suggested that hydrogen could be introduced as a transport fuel to 'a small number of relatively large vehicles that are operated by professional crews along a limited number of point-to-point routes or within a small geographic area.' Indeed, trucks powered by hydrogen fuel cells are currently in use for drayage at the ports of Los Angeles and Long Beach [76]. Although hydrogen has low volumetric density, a recent study suggested that there would be sufficient space on trucks to store fuel for most medium and heavy-duty vehicles to perform their current daily range of operations [77]. Van Biert et al conclude that while fuel cells may be attractive for ships undertaking short trips, ships with missions of over 100 h are likely to require cryogenic hydrogen storage with a volumetric capacity that is 1.5 to 5 times larger than current vessels [57].
Methane, the primary constituent of natural gas, is a potent GHG. Due to the possibility of leakage, using natural gas as a fuel is unlikely to reduce the greenhouse gas emissions of heavy trucks [78]. Similarly, it would take 30 years—equal to or longer than the useful life of merchant vessels [79]—for the contribution to global warming of a natural gas-fired ship to fall below that of an otherwise identical diesel-fueled ship [80].
Characteristics such as economics, operational conditions, vehicles, and fuel-handling infrastructure are different for each mode, and determine what fuels are feasible. Price sensitivity limits the range of fuels that may serve as economically viable alternatives to fossil fuels in ocean shipping, while high energy density is more important for aviation. For example, even low sulfur (<1%) bunker fuel is much cheaper than jet fuel. While electrification combined with platooning or the use of hydrogen fuel cells could be used to decarbonize trucks in the next two or three decades, perhaps the only realistic way to substantially decarbonize air freight in that time frame is to directly capture and sequester a volume of CO2 equivalent to the emissions from the sector [81], or to develop a drop-in low carbon fuel [62].
2.5. Strategy 5: shifting freight to low carbon-intensity modes
There is a large difference in the carbon intensity of surface transportation modes, as summarized in figure 1. Shifting as much freight as possible from road transportation to rail and water is one of the most important means for decarbonizing the freight sector [82]. It is also one of the simplest approaches, as it does not require most companies to make large capital investments [14]. For example, the EU has chosen this as a primary strategy to reduce emissions from the freight sector [83, 84].
Often, it is only possible to shift some part of a shipment's journey to a low carbon mode, requiring shipments to be multimodal [85]. If a good is transferred in a single unit, e.g. container, during the course of its journey, without unpacking it, this multimodal transport is referred to as intermodal 3 [85, 87]. The carbon intensity of an intermodal shipment depends on the types and shares of the modes used, making it difficult to estimate the potential savings in carbon emissions with respect to road [88]. GHG emissions from intermodal shipments hence depend on origin, destination, and the proximity of intermodal terminals [88]. When quantifying the environmental benefits of a shift to intermodal transport, analysts typically explore many different routes to obtain a distribution of carbon intensities. For example, a report commissioned by the International Road Transport Union [89], and cited by the IEA in its 2009 report on transportation [35], found that intermodal shipments in Europe use on average 16% less energy than road shipments, and range from 45% less to over 10% more than road energy use. Craig et al [88] estimate that rail and truck intermodal shipments have an average carbon intensity of 67 g CO2/ton-mile compared to 125 g CO2/ton-mile for trucks, but the distribution has a large variance with a few intensities exceeding the one for trucks due to GHG emissions from terminal operations.
Modal shift focuses on long-haul road freight, as rail and water freight modes have limited use for last-mile delivery [5, 90]. However, decarbonizing the last mile of the shipment by means of technology is comparatively easier, for example through low-carbon vehicles such as rickshaws, tricycles, or electric vehicles [91]. While many are working to develop autonomous delivery robots and drones, at least some authors have expressed doubts that such vehicles can easily reduce freight GHG emissions from urban logistics [3, 92].
3. Global overview of freight activity and trends
In this section, we provide a brief overview of global freight activity and important trends using a dataset of road, rail, and domestic water freight activities that we have compiled for 157 countries for the years 2000 to 2017. Freight activity is measured in tonne-km (tkm) and refers to the transport of one metric ton of cargo for one kilometer4. The freight activities by mode and country are summarized in figure 2. While we focus on the three surface transportation modes (road, rail and water), due to the lack of data on water transportation, we often restrict the discussion to the land transportation modes (road and rail) and their modal split. Detailed data and sources are available as spreadsheets in the accompanying supplementary materials available at stacks.iop.org/ERL/13/083001/mmedia. All values of freight activity in this review are from this dataset, unless noted otherwise.
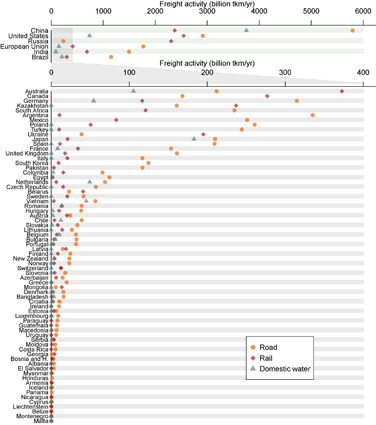
Figure 2. Road, rail and domestic water freight activity for all countries that provide information on road freight activity, as orange, red and green points, respectively. Countries are ordered by the total land freight activity. The lower figure shows the freight activity of smaller countries at a larger scale.
Download figure:
Standard image High-resolution image3.1. Modal structure and trends
Our data show that the global road and rail modal split is 61:39 based on data from 75 countries, which are equivalent to 83% of global GDP. Freight activity on inland waterways and coastal shipping is region-dependent and data are scarce.
With the exception of a few countries where rail dominates, such as Russia, Australia and Canada, most countries rely heavily on road freight transportation (figure 3). While countries with large surface areas tend to have high rail shares in freight activity, some South American countries and China are exceptions.
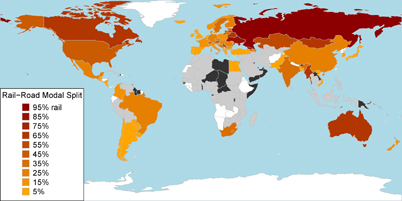
Figure 3. Data availability and modal shares of road and rail globally. The color gradient indicates the fraction of road transportation of total land freight activity, with median values of the ranges given in the legend. Orange corresponds to a larger share of road freight. For the grey-colored countries, only the rail freight activity is available. Black indicates countries that do not have a rail system and do not report road freight activity data. Countries with no data are in white.
Download figure:
Standard image High-resolution imageIn figures 4 and 5 we show how the share of rail freight activity has changed over time. To make the changes comparable with varying lengths of historical time series, we analyze compound annual growth rates (CAGR) over the available time frames. We find that the share of rail freight has decreased in many countries, particularly in China, India, and eastern Europe (figure 4). The shares of rail in Russia, and the US have remained relatively unchanged. The US has shown a recent increase in the share of rail largely due to an estimated decline in road freight activity (see section 5.2). Japan and Australia have increased their rail share. Figure 5, which plots the CAGR of road freight activity against the CAGR of rail freight activity, allows us to identify the mode that drives the change in modal shares. For example, Australia has experienced strong growth in rail, which has largely been driven by growth in iron ore mining activities [93], and some growth in road. This modal shift to rail therefore does not correspond to a decline in road freight. We find that only a few European countries and Japan have experienced an overall decline in land freight activity, while most countries have seen growth with a much higher CAGR for road than for rail. See section 5 and SI Appendix section D for details on regional modal share trends.
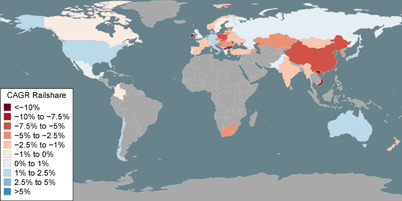
Figure 4. CAGR in percent for available years between 2000 and 2017. Any country reporting values for road and rail freight activity for more than one year is shown. Blue refers to an increase in the share of railfreight activity with respect to road, and red to a decrease.
Download figure:
Standard image High-resolution image
Figure 5. Compound annual growth rate (CAGR) of national road and rail freight activity. This figure includes all countries with data for more than one year for both road and rail freight. The colors of the points distinguish the freight regions. EU and EFTA countries are indicated in blue and are not labeled, please refer to figure 11. The majority of countries experience a large growth in road freight activity, which exceeds the growth in rail freight activity.
Download figure:
Standard image High-resolution image3.2. Freight infrastructure
While the world's road network grew significantly, with China almost tripling the length of its paved roads [94, 95], the global length of rail track declined between 2000 and 2009. Only China, India and some ASEAN countries added track kilometers. According to the OECD International Transport Forum (ITF) [96, 97], the largest needs for surface transport capacity expansions are in Asia and Africa followed by Europe [96]. The IEA analyzed world-wide transportation infrastructure needs [94, 95] and estimates that non-OECD countries will account for 85% of land transport infrastructure additions leading up to 2050. The World Bank suggests that to close the freight performance gap between low- and high-income countries, and for exports to be competitive, primarily better—not more—freight infrastructure is necessary [22].
3.3. Data availability and estimation methods
Globally there is a lack of data on freight-related key indicators [98, 99], one of which is freight activity. While the World Bank [11] maintains a database of rail freight activity and the OECD [10] reports both road and rail freight activity for many countries, their data are not in agreement and there are large gaps in coverage. We gathered information from governments and international organizations to expand those databases where possible.
The quality of the data is highly mode-dependent. For estimating the potential for decarbonization, data on road freight activity are particularly important, but these data are unavailable for many countries. Freight activity data are especially scarce for low- and middle-income countries. The fragmented nature of the sector hinders the collection of reliable and granular data, which are typically obtained through surveys. The World Bank suggests that a voluntary data-reporting program could be helpful [22]. Freight activity estimation methods are not well-documented. Inconsistencies between surveys might make it difficult to compare data from different countries, but might also be necessary given local specifics of freight systems. For example, the EU requires member states to comply with a standardized framework [100], which excludes trucks with a capacity of less than 3.5 tonnes [100]. In many regions a significant volume of freight is moved by vehicles of this size, such as in Japan [3]. Vietnam's statistics even account for freight on motorcycles [101]. If these countries were to adopt the same framework as the EU, they would underestimate the volume of road freight carried. Rail freight activity is typically better documented as there are usually few rail companies operating in a given country. The most difficult data to obtain are on inland waterways and coastal shipping5.
While some analysts adjust raw national or regional statistics, we have not done so. Our database includes only unadjusted figures, and our results reflect unadjusted data but mention where others believe that such corrections were warranted. Adjustments might for example be necessary for estimating GHG emission data, such as in a recent report by the IEA [3], in order to match top-down and bottom-up approaches. We find them less important for measuring the change in modal shares. See SI Appendix for the data description.
4. Strategies to promote modal shift
4.1. Mode choice
Shippers choose the mode of transportation based on shipment characteristics, commodity characteristics, costs, modal access, and environmental considerations [12]. For most shippers, service quality is of great importance [12, 102, 103]. Switching carriers is costly if contracts need to be broken, or new information-sharing arrangements need to be put in place [102]. Below, we describe some of the features that influence mode choices.
4.1.1. Shipment and commodity characteristics
Low-weight and high-value goods are frequently shipped by road or air, while heavy, low-value bulk goods, such as coal, grain and gravel, are often transported by rail or water [12, 102]. The decisions on shipment modes are influenced by the limit that a country and operators impose on truck and rail car weights. Shipment volume is constrained by vehicle or container size, and many shipments cube out before they weigh out [3, 12].
Rail dominates long-distance freight, which is for example defined as more than 500 miles in the US [12]. Shifting freight from short-haul trucking to rail is difficult because local rail lines are not in place and, with the exception of some heavy industries and particular bulk commodities such as coal, transfer centers or warehouses are mostly not designed for railcar-size deliveries [12].
Some commodity groups, such as live animals or chemicals, require specialized equipment. Shelf life, temperature and humidity requirements, sensitivity to acceleration forces and the risk of accidents can limit the modal choice [12, 104]. Protection of the shipment may lead to shippers only trusting a few carriers to transport high-value goods such as luxury cars [12, 102].
4.1.2. Modal characteristics
Transit time and reliability are critical components of mode choice [12, 103, 105]. Reliability determines whether requirements such as just-in-time, quick response, port deadlines, and hub-and-spoke operations can be met [103]. It is affected by congestion, maintenance, accidents, natural disasters, extreme weather, and mismanagement [12, 105]. Shippers consider trucks the most reliable mode, because of, for example the ability to avoid congestion by taking alternative routes [12]. For just-in-time operations, high-value or high-demand goods, the shipment frequency is also important, as it affects inventory costs [12], and shippers place similar importance on service frequency as on reliability [106, 107].
4.1.3. Shipping costs, handling costs and modal elasticity
Some studies argue that shipping costs are less important for mode choice than quality of service attributes [108], while others suggest that shipping costs, especially when including inventory cost or financial risks, are decisive [12, 107]. Clearly the factors discussed above are not independent: for example in-transit carrying costs vary by shipment time, or inventory costs are affected by frequency and reliability.
De Jong et al [26] review elasticities and cross-elasticities in the freight sector. They find that transport price changes are more likely to drive changes in modal shares than in absolute freight transport demand. Furthermore, they find considerable variability in the elasticities and cross-elasticities, which are highly depend on shipment characteristics described above and on the market condition of the modes. Similarly, Christidis and Leduc [109] have reviewed a number of studies and found cross elasticities of rail and road that range from 0.3 to 2. This means that a 10% increase in the cost of road freight will increase rail freight by 3%–20%. Other authors present cross-elasticity estimates as large as 3 [110]. For intermodal transport, Arencibia et al find cross-elasticities of greater than 2 with respect to costs, which are smaller than the ones they find with respect to transit time [107]. Elasticities often cannot be transferred from one country to another [26], and those values likely do not hold for low-income countries.
4.1.4. Environmental considerations
Although not a primary concern for most shippers [111], there is increasing pressure on firms to reduce the environmental footprint, including CO2 emissions, of their logistics supply chains. Programs such as SmartWay by the US Environmental Protection Agency and other international green freight programs [112] aim to make environmental performance more transparent and to ease the integration of environmental impacts into firms' decision-making [46].
4.2. Barriers to modal shift and increased use of intermodal transport
4.2.1. Time of delivery and reliability
Rail intermodal shipments have a significant disadvantage compared to trucks when speed and predictable time of delivery are priorities [104, 113, 114]. For example, freight train delays due to extreme weather can induce a shift back to trucks [115]. Winebrake et al [87] compared costs, transit time and GHG emissions of route options, and the lowest-emissions choice, predominantly rail, was sometimes cost competitive but always had a longer shipping time than other mode options. However, there are also cases where rail intermodal is faster than the conventional lowest cost-option, as for example the Europe-Asia road-rail link that is faster than ship [104]. To speed up intermodal, significant investments in freight capacity, modal connectivity, and efficiency of operation are required [35, 94, 95, 116]. Intermodal would also be more attractive if clients would adjust their strategic and operational decisions to move away from practices like just-in-time manufacturing [35, 117]. In just-in-time production, which originated in Japan, outside suppliers are required to deliver their parts in smaller batches in time for immediate use, thus reducing the need for warehousing [21]. It requires frequent, fast and reliable delivery times, that also resulted in a disadvantage for modes such as rail and inland water [35]. New regulation that incentivizes collaborative logistics, higher inventories and larger shipments could slow down supply chains and enable modal shift [113].
4.2.2. Distorted pricing of transport costs
The external costs of road freight transportation are not adequately represented in transportation costs, and a stronger price signal could promote modal shift. One problem is the lack of granular data, which prevents the accurate assessment of environmental performance and obstructs policy analysis and decision making. A fragmented and informal road freight industry, in particular in the developing world, is hard to regulate [118], and competition makes carriers reluctant to share proprietary information.
4.3. Policy, infrastructure investments, and technologies to promote modal shift
We distinguish two main strategies to promote a shift of freight transportation from road to modes with lower carbon intensity: improvements to the infrastructure and operational efficiency of the freight system and incentives. Such policies include infrastructure investments, promotion of new technologies, subsidies for low-carbon freight modes, regulation of the road freight sector and the internalization of external costs, as described below.
4.3.1. Infrastructure investment in rail, waterways and intermodal connectivity
Infrastructure investments in new or dual rail tracks, waterways, intermodal terminals, and inland ports can increase rail and water freight capacity, enhance modal connectivity, consolidate loads, improve quality of service and extend the rail network to new locations. However, such investments are often lacking. The ITF found that in 2014 the average public and private investment in inland transport infrastructure in OECD countries was 0.75% of GDP. The rail share of this investment was less than 30% [97]. As emerging economies and developing countries are experiencing rapid growth in transportation demand, there is a pronounced need for new transportation infrastructure. The IEA states that by investing in a low-carbon infrastructure and inducing modal shift, these countries could meet demand, boost their economies, and reduce costs [94]. In Africa, for example, the little existing railway infrastructure has been poorly maintained, resulting in a drastic reverse modal shift from rail to road [119, 120]. Operational, financial and contractual standards for intermodal terminals, such as those that exist for ports in the World Bank Port Reform Toolkit, are necessary [121].
In industrialized countries, there is a particular need to develop intermodal terminals and dry ports [122–124]. Dry ports are inland terminals, close to demand, which receive goods directly from the seaport, preferably by rail or inland waterways [123]. They allow containers to be handled close to demand centers (the concept of extended gateway) and increase the share of low carbon modes in the goods' journey [125, 126]. Large cargo-handling facilities may set themselves modal split goals that have an impact on port infrastructure designs [96, 127]. For example, the port of Rotterdam aims to ship 65% of incoming sea freight into the European hinterland by rail or inland waterways by 2035 [127]. Besides environmental considerations, those targets may also be in place to increase capacity or expand the port's reach by making longer-distance shipments available [127].
4.3.2. Intermodal operations research and planning
Operations research, which is essential for efficient infrastructure design, supply chain logistics and terminal operations, can reduce the carbon intensity of intermodal transport [128] and foster modal shift [129]. As intermodal transport research has emerged as an independent field, a number of studies have surveyed the state of the literature [130, 131, 132]. Although a number of freight transport models have been developed [133, 134], and tactical and operational issues have been studied, the lack of realistic physical topologies handicaps modeling freight flows. For example, SteadieSeifi et al [85] note that most analyses model hub-and-spoke freight networks, while many goods are in fact transported along dedicated corridors. In addition, most models optimize for lowest cost: there is a need for models that include other (e.g. environmental) objectives [85, 134].
4.3.3. Integration of services between modes
Besides the vertical integration of dry ports, Logistics Service Providers (LSP) can facilitate co-ordination between different shippers to reduce cost, travel time and GHG emissions horizontally [82, 135, 136]. The EU emphasizes efficiency gains through this cooperative approach and the provision and exchange of reliable information on sustainability metrics [137, 138]. LSPs may allow shippers to choose the desired cost, speed, and level of environmental impact of a shipment, and devise a combination of modes and carriers to meet the shipper's requirements [139, 140]. LSPs can also offer more frequent services to all customers.
One of the key notions regarding the integration of services between modes is synchromodality, which refers to a situation where modal combinations and operational schedules can be changed after the shipment is on the way, in response to new information [85, 136, 137, 141, 142]. This ensures reliability and prevents data lock-in with a carrier. Pfoser et al [140] note that successful synchromodal transportation needs close cooperation between all stakeholders of the logistics chain, a willingness to change existing practices, and harmonized transport regulations, including for data sharing. Contract structures must be developed, which provide legal security for all market participants for the liability for delay, loss or damage. They do not see the development of infrastructure and information technology as significant barriers, although more research and modeling work is needed [140, 142].
Consolidation of smaller shipments that do not fill out a container or truck is offered through the Less-Than-Truckload (LTL) market, which provides door-to-door services where customers can select the transit times and levels of reliability [128].
4.3.4. Enabling efficient intermodal transport through information technology
Information and communication technology (ICT) can be used to improve and automate terminal operations, track shipment locations, improve security and quality control, administer data and aid with routing decisions when optimizing and pricing intermodal shipments [143]. ICT can also be used to automatically assess or collect tolls or constrain heavy vehicles to certain corridors [3, 144]. All of these functions could contribute to decarbonizing the sector [143, 145].
Terminal and port ICTs can address everything from customs information to fully automated freight shuttles between ports and dry ports [143]. Tracking devises include Radio Frequency Identification systems, GPS systems, and fieldbus communications networks, the last of which allows the distributed control of widely dispersed sensors [146]. These technologies can track freight trains, railcars [147], or individual intermodal containers [148]. ICTs can also facilitate the use of intermodal for the market of perishable goods by allowing continuous temperature monitoring in refrigerated containers [148]. Limited GPS coverage, signal blockage, dependence on batteries, and maintenance are problems, but technology is evolving fast [148]. Furthermore, the lack of standards for technologies and for data exchange retard the adoption of these technologies [146].
Consolidation in logistics, as for example in the LTL sector, is a complex optimization problem, which benefits greatly from ICT [146, 149]. ICTs could also provide firms involved in logistics—some of whom might be mutual competitors—secure and anonymous platforms to coordinate activities. For example, an electronic logistics marketplace can permit different companies to anonymously pool their shipping requirements without sharing confidential information or entrusting it to a third party [143, 150]. Shipping companies and banks are beginning to explore the blockchain technology for transactions with customers and tracking ocean and road shipments [151–153].
ICT is also essential for improving the cross-border compatibility of rail systems. Since the 1990s, the EU has worked with the private sector to create a standardized rail communication and signaling system with investments of over €770 million [154]. The European Railway Traffic Management System (ERTMS) is one of the most advanced train control systems [147] and it is employed also in many countries outside Europe [155]. Similarly, the EU fostered the development of an ICT system for inland waterways, the River Information System [156]. In the future, these intelligent transport systems could be combined into an efficient multimodal digital freight system [156, 143]. Many Asian nations have also recently introduced ICT systems to make border crossings faster [157].
While the ICT strategies described above would yield some carbon reduction potential, we are not aware of a systematic assessment of what that potential could be. This could be an important contribution to the literature that could support policy decision making for climate mitigation in the freight sector.
4.3.5. Regulation and subsidies of low-carbon freight modes
Third-party rail track access can be publicly regulated. The EU requires infrastructure managers to give access to third-party railway operators, while this is done voluntarily in the US [158]. The lack of track access may make hinder growth in rail traffic by allowing incumbent railroad operators (who in the US also own the tracks) to block new entrants by charging high track access charges [159].
Governments may choose to directly subsidize modal shift because it supports the goal of decarbonization. The Marco Polo Programme of the EU [160] compensated projects with €1–2 per 500 tkm shifted (the equivalent of €25–50 per tCO2 emissions avoided). Although an early assessment has found that the program has underachieved targets for modal shift [161, 162], studies suggest that direct subsidies can be successful [129]. Belgium subsidizes the transfer of containers from sea ports to inland waterways [163].
4.3.6. GHG pricing and internalizing external costs
In transportation, external costs include air pollution, noise, accidents, congestion, infrastructure damage and climate change. While this paper focuses on climate change costs, policies often address multiple, region-specific externalities. If revenues from Pigouvian taxes on road transport are applied to improve other modes, policies can be more effective in promoting modal shift and might gain more public support [164].
Assuming a carbon price of €90 per tonne CO2 and a discount rate of 3%, the average marginal climate change costs for heavy freight vehicles are estimated at 2.5 to 10.4 euro cents per vehicle-km [165], which is around 0.3 to 0.4 euro cent per tonne-km but can also be much higher depending on load factors and emission standards. Diesel-powered rail is estimated to cost 0.26 euro cent per tonne-km for a load of 500t, and electrified rail is likely lower. These values are larger than the estimates of accident costs but substantially smaller than congestion costs. While a Belgian study showed that internalizing all those external costs can induce modal shift to lower-carbon freight modes [166], very high taxes might be needed induce modal shift [12]. This is also demonstrated by the anemic response to the Marco Polo program discussed above. Combining taxes with other decarbonization policies ('policy packaging') might be more effective [164].
External costs of rail freight and inland waterways are typically lower than for road transportation, but the case of intermodal transportation is less clear. Mostert and Limbourg (2016) [167] find that internalizing external costs can make intermodal shipments more cost-competitive but highlight that this effect diminishes for longer drayage distances. Similarly, Santos et al [129] show that internalizing external costs can also hurt intermodal transport competitiveness, depending on the length of the road haul.
Van Essen et al [164] find that fuel and vehicle taxes, vehicle charges and in some cases emission trading are the most common policies to internalize the external costs of transport. They recommend a strong differentiation for charges and taxes and a clearly labeled CO2 tax or emission trading for climate change costs. Emission trading schemes such as the EU Emissions Trading System still do not include the transportation sector, with the exception of aviation [168]. We focus on fuel taxes and vehicle charges the following sections.
4.3.7. Motor fuel taxes
Harding [169] finds that in almost all OECD countries, diesel fuel taxes are lower than gasoline taxes. She concludes that the externalities associated with the fuels do not justify this tax differential and advises its gradual removal. In particular countries with large distances between cities, or few alternatives to road freight transportation tend to have lower fuel taxes [3]. While some countries still have diesel fuel subsidies in place, a few recently moved to eliminate them [170].
While much scholarship evaluates the effect of fuel prices on the demand for transport and fuel, there is less empirical work on the effect of fuel taxes. An analysis that sought to delineate the consumer response to gasoline taxes from the response to gasoline prices [171] found that the tax-exclusive price elasticity of demand for gasoline was −0.03, only half as large as the tax elasticity of −0.069. This may be because taxes are publicly debated and are therefore more salient or because consumers see tax rises as more permanent than transient price rises. In fact, the tax elasticity is lower in states where the taxes change frequently [171]. We have not encountered studies that separate the effects of prices and taxes for the trucking sector, and an empirical study would be instructive. One could speculate that the contractual arrangements that allow carriers to pass on increases in fuel prices [24] were designed to protect carriers' slim margins from market volatility. That does not apply to predictable taxes. However, some studies suggest that tax increases are rapidly and fully reflected in shipping prices [172]. The majority of the studies focus on the United States, Canada, and Europe, and empirical evidence from large developing countries remains scarce.
4.3.8. Road user charge and corridor regulation
As of 2017, most EU countries have implemented tolls for heavy-duty vehicles [173], and this has proved to be effective in inducing a shift to rail or water in Switzerland, Germany and Austria [174]. The US Department of Energy concluded that direct user charges in the form of tolls for trucks could have the largest impact and it is the policy most likely to be implemented in the US [12]. Apart from aiding modal shift, road user charges may generate revenue for infrastructure maintenance, reduce congestion, increase logistics efficiency, and charge foreign-registered vehicles for the use of national infrastructure and the externalities they impose [144].
Technology can make road pricing more efficient and increase compliance rates. Germany has implemented, and other countries are studying, a satellite-based system to collect heavy-vehicle tolls [144]. This system also includes charges on secondary roads that have previously been used to avoid tolls. Australia's satellite-based Intelligent Access Program monitors where, when and how large and heavy vehicles are operated, and could be used to restrict those vehicles to corridors where more sustainable alternatives such as rail or water are unavailable [3].
4.3.9. Labor rules
As labor costs make up a significant portion of trucking costs, reducing the maximum hours of service can induce a shift of 2%–3% of the US tonnage from road to rail [12]. The entry barrier to the road freight industry is very low in most developing countries, resulting in high competition between numerous single-driver companies with low prices and low labor standards [22, 175]. National minimum wage rules also influence which countries bear the largest share of road freight traffic in a region, as for example in Europe [176]. While labor rules have in the past played a significant role in port and terminal operations, this is no longer as important [21]. However, strikes at container terminals and poor human resource management can impact reliability and productivity [177].
4.3.10. Truck size and weight regulations
Restrictions on truck sizes are in place in most countries, mainly to protect the road infrastructure and to address safety [3]. Road damage increases as the ∼2nd to ≥ 5th power of vehicle weight [178]. In some parts of the world, however, regulations are poorly enforced, resulting in high profit margins for truck operators due to overloading, speeding and lax vehicle requirements [179]. Tightening and enforcing regulations, by cracking down on corruption, would reduce the cost-competitiveness of the road freight sector and promote a shift to rail [22].
In many developed countries, the discussion instead focuses on allowing larger and heavier vehicles (LHVs), which are already permitted in Canada, Australia, Brazil and Scandinavia [3]. Increasing the maximum permissible truck size and weight to more than 70 tons can decrease the carbon intensity [110], but could make road freight cheaper and induce a shift away from rail and water [3, 12]. The effect on the relative share of road and rail freight of allowing LHVs varies by country, depending on the associated cost reductions and the fraction of rail freight that is containerized [110, 180]. Predictions of the modal shift potential of LHV policies are difficult, since modal cross-elasticity values are uncertain and many current studies were conducted by groups with an interest in promoting one or the other mode [109, 110].
A study in Sweden found that allowing longer vehicles capable of carrying two containers for intermodal drayage can reduce total intermodal transportation costs by 5%–10% [181]. There is a need for more research on role of LHVs for low-carbon intermodal freight transportation [180].
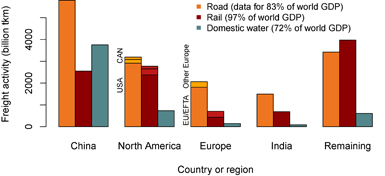
Figure 6. The four economies with the largest road freight activity in our dataset. The values for road and water freight activities in the remaining part of the world are most likely larger, since there are many countries for which there are no data available. The road and rail freight activities for Canada are split in domestic (bottom) and international shipments (top).
Download figure:
Standard image High-resolution image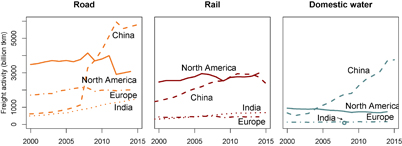
Figure 7. Recent development of freight activity of the four economies with the largest freight volume. Indian waterborne freight activity has only been estimated for one year.
Download figure:
Standard image High-resolution image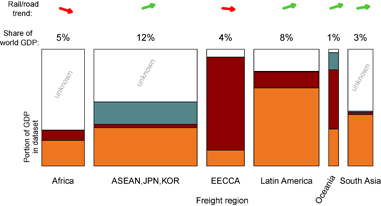
Figure 8. Summary of modal share, trends and missing data for each region. There are many countries that do not report road freight activity, and the white part of each bar corresponds to the fraction of regional GDP that such countries make up. The colored portion of the bar is split in the proportion of the total freight activity of road, rail, and water for the countries in the region that at least report road and rail data. We also indicate the proportion of world GDP of each region by the width of the bar. The arrows at the top of the graph show the approximate trend in the rail-road split: a downward arrow suggests that the share of rail is falling. For example, in the ASEAN-Japan-Korea region, both road and rail freight activity is given for four countries, which together make up 55% of regional GDP. In this region, road makes up 60% (orange) of total freight activity, rail 5% (red) and water 35% (blue). The remaining nine countries of the region do not provide road freight data.
Download figure:
Standard image High-resolution image5. Freight systems and modal shift by region
China, the United States, India and Europe together account for more than 78% of the reported road freight activity (figure 6). As data on road freight activity are not available for large parts of the world, the true percentage is likely lower. The road freight sector has grown faster in low- and middle-income countries than in high-income countries [22]. China has recently surpassed the US as the country with the largest road freight activity (figure 7). Figure 8 shows the modal shares, trends and missing data for the remaining regions. In this section, we summarize the modal shares and political, economic and geographic particularities that have an influence on modal shift in those regions. We devote the greatest attention to those regions with the largest road freight activity and refer the reader to section D of the SI Appendix for a discussion of all regions.
5.1. China
Much of the freight in China is transported long distances, which gives the railway system a competitive advantage. However, while rail used to have the largest share, most freight is transported by road now. Since 2000, China's road freight transport activity has increased more than eightfold, while domestic water shipping has more than quadrupoled, and rail freight activity has increased by a more modest 70%. There was a revision of the road freight activity reporting in China that resulted in a jump in reported values around 2008 [3]. A large fraction of the total freight activity is coastal and river shipping [182, 183], which was at 31% in 2015. Duan et al [184] estimate that in 2012, 88% of transport GHG emissions in China were from the freight sector, mostly from road vehicles. Electrification reduced the rail carbon intensity in the early 2000s [183], although Chinese trains still have relatively high emissions because most electricity is generated from coal [185]. Luo et al [183] find that, due to differences in economic development, transportation GHG emissions in China differ significantly between regions.
The road transportation sector is fragmented with an average fleet size of three [182] and harsh working conditions for drivers [175]. Trucks are often old and overloaded and there is intense competition, which creates very low prices. GPS tracking and telemetry are largely absent in the road freight sector [175]. Rail intermodal is underdeveloped [188] and it has a lower priority than rail for military, passenger, energy, and food transportation [182].
5.1.1. Select policy instruments in place
Since 1995, China has pursued the development of a high-capacity freight network with intermodal corridors and hubs, connecting economic and industrial centers [157]. The Chinese government is the main investor in infrastructure, particularly in the railway sector, and project developments are fast [182]. China invested 5.4% of its GDP in inland freight infrastructure in 2015, the highest investment rate reported by the ITF. However, more than three quarters of this investment was in road infrastructure [187]. With the Belt and Road Initiative, China is also rapidly expanding its transportation infrastructure outside of its own borders [188]. The inefficiency of the inland freight system is one of the main challenges for China's logistics system and is in stark contrast to some of the largest and most modern container ports in the world located in China [175]. One of the main barriers to modal shift is modal connectivity and ports are mainly serviced by trucks [182, 186]. For the line-haul movement of containers, on certain corridors the use of rail is prioritized and other modes are restricted [157].
5.1.2. Conclusion and policy recommendations
Blancas et al [186] propose reforming the regulatory environment to allow Chinese railways to take a more customer-focused approach, similar to the deregulation in the US. They believe that as new high-speed rail has freed up capacity, such developments become more likely.
Luo et al [183] suggest a regional approach where wealthier eastern regions could experiment with measures such as fuel taxes while western regions focus on infrastructure development. However, different fuel prices in different regions might encourage smuggling.
Jun and Bensman [175] recommend requiring the trucking industry to improve working conditions, reduce overloading, eliminate falsified paperwork, and retire overaged fleets. Well-designed incentives might induce investment in more efficient modern fleets. We expect that these efforts would both lower the carbon intensity and increase the costs of road transportation. The latter could induce a shift to rail- or waterways.
5.2. USA and Canada
The transportation systems of the US and Canada are similar and closely connected. North America's geography is ideal for rail freight, which has a high share of land transportation (63% in Canada and 48% in the US in 2014). Most freight activity in the US is on road, which grew strongly in the 1990s [102]. Both the US and Canada have seen a recent increase in the rail freight activity. In Canada, however, road freight activity has grown considerably faster than rail (figure 9). Domestic water freight activity has declined in North America6 and inland water transportation on rivers and the great lakes plays a modest role.

Figure 9. The percentage change of road, rail and water freight activity in the US and Canada since 2000. Canadian values are reported separately for shipments that have an international origin or destination ('international') and for those that are only domestic ('domestic'). Values for the US after 2011 are not based on the Commodity Flow Survey. Refer to the SI Appendix section B.1 for details.
Download figure:
Standard image High-resolution imageFreight dominates passenger railway operations in North America [191] and the rail freight system is considered safe, efficient and cost-effective [192, 193]. Intermodal transportation in North America is growing modestly [102, 189, 194] but it is now the largest single source of revenue for US freight railways, which before was coal transport [195]. The Association of American Railroads attributes this growth to factors including investments, improvements in service quality, and truck driver shortages among other factors [195]. In Canada, rail transit times are decreasing and intermodal travels faster on average than other commodities [189].
A report by the US DOE, based on 2007 data [12], suggests that there is an opportunity to move freight carried over distances of 250–750 miles from road to rail. It finds that a substantial share of the freight activity has distances between 250 and 1500 miles. In a 2017 report, Zhou et al from Argonne National Laboratory (ANL) [196] evaluate the modal shift potential based on commodity flows and rail level of service information. They estimated that 4.1% of truck freight activity could be shifted to rail, resulting in 4.4% reduction in total freight CO2 emissions by 2040. Canadian studies have also found that modal shift can contribute to decarbonizing the freight sector [197, 198].
5.2.1. Select policy instruments in place
Intermodal policies have been part of the North American transport strategy to improve the freight system since the 1990s [15]. For example, a detailed analysis of potential policy approaches was undertaken in 1998 [199]. Policies have mostly targeted corridor development and infrastructure financing [160, 189, 200], as well as the development and employment of intelligent transport systems [15, 160]. The US invested about 0.6% of its GDP in transport infrastructure in 2015. Less than 10% of it was in the rail sector [187], one of the lowest shares among OECD countries. For historical reasons, the US Federal Government favored investments in highways over railroads [201]. As a consequence, road freight, which travels over publicly-built and maintained roadways, enjoys an implicit subsidy relative to rail transport, which is privately owned and where freight rates must reflect the private cost of owning, building, paying tax on, and maintaining the infrastructure [202].
For the Canadian government, reducing the carbon emissions from the transportation sector is key to reaching GHG emission targets [189], in particular as some provinces have high shares of renewable energy generation [203], which limits the scope for reducing emissions from the electricity sector.
North American freight rail companies are privately owned and vertically integrated as they own both infrastructure and railway operations [189, 192]. In the US, federal deregulation occurred in the 1980s and 90s. This removed constraints on rail companies such as maximum rate regulations, and allowed them to enter into confidential rates and services contracts and to abandon lines [102]. The US and Canada have significantly reduced the extent of their rail track network [94]. There is no track access regulation, and track sharing is voluntary [158, 192].
The US and Canada are among the countries with the lowest motor fuel taxes in the world, equivalent to a carbon price for diesel of US$2.50 or less per tonne of CO2 [169]. In the US, diesel taxes are lower in states with a larger proportion of employment in the trucking industry [204]. Only four US states (Kentucky, New York, New Mexico and Oregon) have tolls specifically targeting heavy trucks. There are few reports of interest in extending tolls in the US [205] as well as Canada [206].
Canada allows long and heavy combination vehicles with two semi trailers [189]. In the US, heavy vehicles are largely restricted to areas near the US-Canada border to facilitate the smooth movement of goods between the two [102]. The US and Canada both have heavy-duty vehicle GHG emission standards [3, 189].
5.2.2. Conclusion and policy recommendations
Although the share of rail freight is high in North America, the competition from the road sector has induced a shift from rail to road. North American investments and policy-making lag Europe, China, and India in efforts to promote a modal shift from road to low-carbon modes. There is a clear opportunity to use motor fuel taxes and road charges to provide such incentives. Heavy-vehicle tolls have been identified by the DOE as an impactful policy for modal shift [12].
Due to the presence of regional rail monopolies in North America, connectivity between different rail segments of long-distance rail shipments is a barrier to modal shift. More terminals that facilitate efficient transfers between different rail lines could accommodate fragmented ownership and relieve congestion in North America [193]. Upgrading intermodal terminals to facilitate the transfer of more commodity groups may also help to reduce GHG emissions [207].
The decline of coal and the surge in oil and natural gas drilling activity in North America are currently changing the rail business. For example, a single new well pad can require up to 40 railcar loads of equipment and raw materials [208]. In regions, where a pipeline infrastructure is not in place, liquefied natural gas is also transported by rail, as for example in the state of Pennsylvania [208]. At the same time, the volume of coal shipped has declined sharply as demand in the electricity sector has fallen [209]. The transition from coal to intermodal freight as the largest source of revenue [195] is changing geographical patterns of rail freight activity, impacting investment needs, and posing a business challenge for railway companies. This challenge has already been recognized by the Canadian government [189].
5.3. Europe
For the EU, modal shift has long been one of its key strategies for decarbonizing the freight system [15, 84, 210]. Freight demand in Europe is relatively stable, after a period of growth in the 1990s and 2000s due to the expansion of the EU, and business and logistics changes that increased shipping distances [97]. In European countries, the road and rail freight modal split is 82:18 (80:20 in the EU). Taking the average over 36 European countries that provide data for rail, road, and water freight through 2000–2014, the share of rail has decreased by around 11% compared to 2000 and the water share has remained approximately constant. A study for the European Parliament [159] notes that modal shares and their trends differ greatly between countries in Europe. Some of the newest member states (EU-13) have seen large growth rates in road freight activity ([159] and figures 10 and 11). In figure 10, we compare how the modal split of registration-based and territorial freight activity has changed from 2005 to 2015. Companies from eastern Europe have taken a large share of road freight transportation in the EU, offering truck driver wages that are below the minimum wage in many western European countries [176]. This gives the appearance of a shift to road in eastern Europe, and a corresponding shift towards rail in western Europe.

Figure 10. The CAGR of the rail share of total surface transportation in Europe for 2005–2015. Countries with a decrease in rail share are colored in red, and with an increase in blue. Above: accounting for the country where the freight vehicle is registered. These data are used in our global database and in figure 4 (with a CAGR for 2000- 2015). Below: accounting for the country where the transport work is done. We see that much of the increases in road transport activity by eastern European companies is performed in Central European countries, in particular Austria, Germany the Netherlands and Belgium. The data source is Eurostat.
Download figure:
Standard image High-resolution image
Figure 11. The CAGR of land freight activity in Europe since 2000. This graph illustrates the large growth in road freight activity by vehicles registered in Eastern European countries. SomeWestern European countries have seen a sharp decline in rail freight activity.
Download figure:
Standard image High-resolution image
Studies estimate that the current modal shift potential from road to rail in the EU is between 1 and 14 percentage points, and a realistic target could be that rail transports 20% of all freight [159]. Other studies believe that European rail transport could grow by 10% to 30% under modal shift policies [113]. Barriers to increasing the share of rail freight include the need for investments to alleviate capacity bottlenecks, relatively poor reliability, and in some countries the higher cost of shipping by rail [159].
5.3.1. Select policy instruments in place
In a 2011 white paper on transportation [83], the EU set the goal of shifting 30% of long-distance road freight (over 300 km) to rail or water by 2030, and 50% by 2050. This is to be achieved by improving the rail network, modal connectivity, and the quality of service to make multimodal freight economically attractive. The white paper mentions several EU-funded information systems to improve logistics and traffic management. As discussed in section 4.3.4, EU-initiated projects are at the forefront of developing intelligent transport systems.
The EU Combined Transport Directive (Council Directive 92/106/EEC as of 1992) regulates intermodal transport of goods between EU member states and ensures for example that vehicle tax reductions for drayage vehicles are granted through member countries. The EU Commission recently proposed amendments to the Directive, reinforcing sustainability goals [84].
The Marco Polo Programme, which offered subsidies to modal shift projects, ran from 2003 to 2013 [162]. As of 2010, 30 billion tkm of freight have been shifted but the performance lagged behind expectations [211]. However, monitoring of the program's results has continued after 2010.
The EU is proactive in internalizing external costs of freight transportation [164, 165, 167]. European countries have higher diesel taxes than most other countries, equivalent to between 120 and 260 euros per tonne of CO2 [169]. As of 2017, most EU countries have implemented some form of road charges for heavy vehicles [144, 173], which are harmonized by the Directive 1999/62/EC or Eurovignette Directive [212]. The tolls are intended both to recover infrastructure costs and to provide a means to induce modal shift [164]. Germany applies a heavy-vehicle toll to any truck with a gross weight of at least 7.5 tonnes using a GPS-based system [213]. Since 2005, this toll has been collected on all major highways (Bundesautobahnen) and since 2015 also on a number of secondary roads (Bundesstraßen), which were previously used to avoid tolls. The charge depends on the length of travel, the size of the vehicle and its emissions class, and it is between 8.1 and 21.8 euro cents per km, as of 2015. Belgium, Denmark, Luxembourg, the Netherlands and Sweden have a common truck tolling system, the Eurovignette system, which is based on time of use instead of distance [173]. Austria and Switzerland have particularly high road charges of up to US$0.50 per km [214, 215].
In addition, the EU is integrating modal shift strategies into the development of the Trans-European Transport Network of core corridors [159, 211, 216]. EU-level and national efforts have led to a large number of new intermodal terminals [122]. The European railway system is primarily geared towards passenger service and rail infrastructure is mostly publicly owned [191]. The EU mandates non-discriminatory access to railway tracks [158]. To create a Single European Railway Area (SERA), the EU has created a standardized ERTMS, replacing existing national automatic train protection systems [217]. The EU's Horizon 2020 research and innovation program funds the joint undertaking Shift2Rail to promote the development of rail technology and modal shift strategies [218]. Through the COMCIS project, the EU is identifying and addressing problems of missing collaboration between modes by standardizing data systems and sharing. This includes adopting such concepts as synchromodality and the use of dry ports [219, 220].
Modal shift policies on the national level have been less successful than on the EU level, with the exception of policies targeting intermodal ports [159]. Many European ports only permit sustainable port development and include modal share targets, sometimes even mandated, into their infrastructure planning and terminal concessions [127].
5.3.2. Conclusions and policy recommendations
The EU has extensively promoted modal shift to decarbonize freight, but as the average share of road freight activity has increased, it is not apparent that these policies have been successful [82]. It is unclear whether the modal shift initiatives have been without effect or have potentially prevented a larger shift to road transportation. More research is needed in this area. The EU recently proposed further measures expanding information transparency and new investments in terminals [84].
5.4. India
In 2015, the Indian road to rail modal split was 69% to 31%. Road and rail freight activities have grown with a CAGR of 7.7% and 5.4% respectively between 2000 and 2015. This has led to a three-fold increase of road and a doubling of rail freight activity in that period. The Government of India (GoI) expects the total freight activity to grow at 9.7% per year until 2032 [221]. Given the current and forecast GDP growth rates of around 7% [222], GoI's forecast assumes a high elasticity of transport demand, as mentioned in [223], and may overstate the actually likely growth.
India's freight system suffers from congestion [157, 223]. The road freight industry operates at low costs, because entry barriers are low and competition is high, and because overloading is allowed to continue unchecked [22, 221]. It has benefited from recent improvements in the road network [22]. The Indian railway system is publicly owned and operated [224]. The volume of containerized transport on rail has grown considerably [225]. Rail freight tariffs are high as the government uses the revenue from freight movement to subsidize passenger tariffs [226, 227]. The condition of the rail lines and terminals is poor, which together with congestion causes uncertainties in the transit time [223, 226]. In 2012–13, more than 65% of India's rail freight activity was hauled by electric traction [228], but 58% of electricity is generated by coal [229]. Nonetheless, the carbon intensity of rail has fallen significantly since 2000 [230].
Indian inland waterways are underdeveloped [221]. Data on domestic water freight activity are scarce, but it is estimated as significantly less than rail freight activity, e.g. 6% in 2007–08. The vast majority of it is coastal shipping [157, 223, 230].
Contrary to current growth trends, the GoI aims to achieve equal shares for road and rail by 2032 [221]. As early as 1980, the GoI set an ambitious target of transporting 70% of freight by rail and 30% by road by 2000. It has fallen far short of these goals [227]. Infrastructure capacity shortfalls and poor integration of transport modes are identified as the main barriers [157].
5.4.1. Select policy instruments in place
To achieve its stated target of a rail share of 50% by 2031–32, the GoI aims to modernize the freight system and expand capacity [157, 221]. As much of the infrastructure is yet to be built, long-term planning that accounts for the need to minimize GHG emissions could avoid the construction of an inefficient and carbon-intensive system. The GoI currently invests around 4% of GDP in infrastructure but only a tenth of that in the rail sector [221]. The GoI has initiated large multimodal infrastructure projects [221] and is building Dedicated Freight Corridors (DFC) [221, 223, 231, 232] in an attempt to expand rail capacity. Some of these projects are built with international financial assistance [223, 225, 231, 232] and the use of public-private partnerships (PPPs) [233]. India has more than 50 dry ports for containerized transport [225]. Containerized freight is handled by Container Corporation of India, which is part of Indian Railways and has invested in modernizing its operations with ICT; for example to track containers [225].
In addition to the initiatives for improving rail and road networks, the GoI plans to subsidize water shipments [157] and to develop India's first modern inland waterway on the Ganges river, which flows through the densely populated Indo-Gangetic plain [234]. Approximately 40% of India's traded goods make their way through this region at some point in their journey [234], many of which are trucked to ports on the country's west coast. The World Bank has financed the project with a loan of $375 million [235].
Fuel taxes are collected by central and state governments with considerable variation between states [236]. Efforts to reduce air pollution and congestion by heavy-vehicle driving restrictions (e.g. a nationwide ban on trucks older than 15 years), fuel emission standards, and green taxes on vehicles that enter urban areas have been adopted in parts of India [236]. These may promote modal shift as well as help to decarbonize the last mile.
5.4.2. Conclusion and policy recommendations
As level of service factors [227] and capacity bottlenecks [157] are the most important barriers to modal shift, the share of infrastructure investments in rail needs to be increased [221]. The United Nations Environment Programme estimates that the planned DFCs can avoid large amounts of GHG emissions, mainly by preventing a shift from rail to road in the growing freight sector. These effects could be increased by a carbon pricing strategy [223]. We found little evidence of the use of cost incentives to promote modal shift and adjusted price signals that are important for optimal infrastructure planning [237]. The GoI acknowledges that Indian subsidies, tariffs and taxation policies send distorted price signals [221]. Heavy vehicle tolls have been recommended as a policy to promote modal shift and could be collected electronically [221, 227].
The goods and services tax (GST), a national value-added tax introduced in 2017, eliminates state taxes in some sectors. The new regime is expected to lower the cost of freight, although it is unclear whether it will benefit one mode more than others [238]. Early reports suggest that by eliminating the need to stop at tax checkpoints every time a truck crossed state boundaries, GST has cut the travel time on road by about 25% [239], potentially making road more attractive. A retrospective analysis of the impact of GST on modal choices would be interesting once the tax regime has stabilized and taken root.
Coal is the commodity with the largest freight activity in India, and almost 80% of it is transported by rail [240], which is already contributing to congestion of the rail network. As demand for coal and for the transport of it increases, it may crowd out other goods if infrastructure does not expand rapidly enough [241], and may be increasingly transported by road [242].
5.5. EECCA countries and the Trans-Asian Rail Network
Rail is the dominant mode for eastern Europe, Caucasus and Central Asia (EECCA) and Mongolia, while inland water transport is negligible (figure 8). Russia has 90% rail freight activity. Except for in Russia, the road freight sector has grown faster than the rail sector in the region. A number of EECCA countries are landlocked nations, where high transport costs hinder trade and economic development. Upgrading the transport infrastructure and facilitating regional cooperation between transit neighboring countries deserve high priority in this region [243–245]. To automate and accelerate clearing processes at border crossings, ICT is increasingly used [157]. In addition, the development of new transit corridors is important to prevent bottlenecks [243, 245]. For example in Kazakhstan, there is hope that new corridor developments on the Eurasian land bridge will stimulate the logistics system [246]. In the past five years, Kazakhstan has invested several billion dollars to upgrade its railway infrastructure [247].
While the vast majority of intercontinental freight is transported by ship, the land route between China and Europe is only about half as long as the sea route [247] and can be traveled by rail in much shorter time [104, 247]. First the Silk Road and then the Trans-Siberian Railway were important trade routes in the region, but after the fall of the Soviet Union this corridor has only carried small shares of the freight [247]. However, with the recent increase in trade between China and Europe and the Chinese Belt and Road Initiative, the rail connections between Asia and Europe promise to gain importance. In 2016, the rail freight volume between China and Europe was already at 500 thousand tonnes, equivalent to one third of airfreight tonnage traveling to Europe [247]. After raw material and machinery parts, the most important commodities transported along these routes are automotive, high-tech and consumer goods [247].
In the 1960s, the international community expressed interest in a joint railway network for Asia [248] and since 1992 the United Nations Economic and Social Commission for Asia and the Pacific (UNESCAP) has worked towards creating the Trans-Asian Railway Network. Member states negotiated an Intergovernmental Agreement in 2009 that has resulted in new railway links but development has been slow. Cross-border rail links are fragmented, especially in South and South-West Asia, causing shippers to prefer maritime freight transport [157]. To promote intermodal transportation in the region, UNESCAP adopted the Intergovernmental Agreement on Dry Ports in 2013 [249].
There are many gauge breaks in the Trans-Asian Rail Network that require additional handling [104], further complicating the multipleborder crossings and slowing transportation down. Additional challenges for the routes are the extreme temperatures in those regions of continental climate, damage to goods and trains due to poor rail tracks, and theft [104, 250]. Temperature sensitive products are mostly only shippable in spring and fall. A test shipment bringing wine from Europe to China in May 2017 revealed large temperature fluctuations inside the container, which could be mitigated by a special container foil liner [251]. Another difficulty could be the trade imbalance between the two regions. Already in 2016, the amount of freight from China to Europe on this route was 1.5 times the reverse [247].
Table 1. Estimates of modal shift potential and political targets.
| Source | Nature of estimate | Regions | Estimate |
|---|---|---|---|
| ICCT (2012) [174] | Assumption | United States, China, Japan, Canada, South Korea, Australia | 20% increase in rail freight activity by 2030 compared to a 2010 baseline |
| ICCT (2012) [174] | Assumption | EU, India, Brazil, Mexico | 40% increase in rail freight activity by 2030 compared to a 2010 baseline |
| ICCT (2012) [174] | Assumption | North America, Australia, Brazil, Japan, South Korea | Share of rail freight will remain unchanged between 2010 and 2030 given currently planned policies; large potential increase with incentives |
| ICCT (2012) [174] | Assumption | European Union | Share of rail freight will decrease between 2010 and 2030 given currently planned policies; small potential increase with incentives |
| ICCT (2012) [174] | Assumption | China, India | Share of rail freight will fall by more than ten percentage points between 2010 and 2030, decrease could be substantially reduced by infrastructure investments |
| IEA (2009) [35] | Scenario | Global | 'BLUE' Scenario: all measures including modal shift result in 15% lower carbon emissions than in the baseline scenario for 2050 |
| IEA ETP (2015) [116] | Scenario | Global | Avoid and Shift policies in the '2DS' scenario reduce transport GHG emissions by 15% or more by 2050 |
| UIC [230] | Target | Global | Rail same share as road by 2030 and 50% greater than road by 2050 |
| Zhou et al. [196] | Estimate | United States | 4.1% of road freight activity can be shifted to rail, with 4.4% reduction in GHG emissions compared to base case scenario |
| European Commission [83] | Target | European Union | Shift 30% of road traffic of > 300km to rail or water by 2030 and 50% by 2050 |
| Studies in Tavasszy et al. [113] | Estimate | European Union | Rail transport could grow 10% to 30%; modal shift potential from road to rail of 1 to 14 percentage points under modal shift policies |
| Dionori et al. [159] | Estimate | European Union | Rail could realistically transport 20% of all freight activity |
| Government of India [221] | Target | India | 50:50 share of road and rail by 2031-32 |
| Havenga and Simpson [252] | Estimate | South Africa | 21% of the transport activity (15% of the tonnage) could be shifted to rail if externalities were considered |
| Government of Japan [160] | Target | Japan | 50% share of rail and water by 2010 (acheived 2014) |
| Subsecretaría de Transportes Chile [253] | Target | Chile | Double rail freight activity by 2020 based on 2012 |
6. Estimating the modal shift potential
There is a clear need for a systematic assessment of the global modal shift potential and its associated GHG emission reductions and costs. While such a comprehensive assessment does not exist, regional estimates provide a starting point on how to think about this issue. Brogan et al [12] identify three approaches to estimate the modal shift potential: market-segmentation methods, modal cross-elasticities, and mode choice models.
Market-segmentation methods are frequently used given their simplicity. They analyze origin-destination pairs of freight shipments to identify the fraction of shipments that could potentially be transported by each mode. These methods are capable of estimating a maximum feasible modal split under ideal conditions, but do not take into account capacity constraints and modal shift policies. For example, Zhou et al [196] have used the US Commodity Flow Survey to estimate how many shipments could be shifted based on average freight tonnage, transport distance, and time sensitivity, and made assumptions about shipper preferences for shifting to rail. Models that use commodity flows and pricing information to estimate modal elasticities and cross-elasticities are often proprietary [12]. Modal elasticities can be used for policy analysis or as model parameters to predict future modal shares. The range of cross-elasticities found in the literature is wide and values are location-specific [26, 109, 110] (section 4.1.3), thus making it difficult to use the values for reliable predictions. Mode choice models survey the preferences of individual shippers, which can be used to estimate modal elasticities and also to predict modal shift. Often those studies use discrete choice models, e.g. [107], and data collection might be costly [12].
There are a few estimates of regional modal shift potentials and targets for modal shift in the literature, which we reproduced in table 1. These are expressed for example as target modal shares, or as changes in the share of one mode or the other with respect to an explicit or implicit baseline. We find that some estimates and targets are poorly defined: for example, they do not say if the share is expressed as a percentage of total land transportation or of total surface transportation including water modes. A number of the targets in table 1 are expressed relative to counterfactual, business-as-usual baselines. Unless the current and projected baselines are explicitly stated, it is difficult to interpret such targets, and to quantify their consequences for greenhouse gas emissions reductions. In some cases, even if the current baseline is clearly stated, we find that it disagrees with independent estimates of the current level of activity and modal shares. For example, data by the International Council on Clean Transportation (ICCT) suggest that in 2010 the share of rail in Chinese freight activity was >60% [174], whereas OECD data suggest that it was <40% [10].
7. Conclusion
Cost-effective GHG emissions reductions for the transportation sector may be available but in today's markets will likely not lead to the levels of decarbonization that are needed to slow climate change. Thus, additional policies that include either incentives for reductions or penalties for GHG emissions will be needed. We find that modal shift may have the potential to reduce GHG emissions, but that a systematic analysis of the possible emissions reductions and costs is yet to be found in the literature.
To promote modal shift, governments could use two types of policy approaches: infrastructure investments and incentives. However, policy approaches have been largely underused. For example, the share of infrastructure investments in the rail sector is small andshould be increased, especially in developing countries. Investments should focus on constructing efficient rail and intermodal terminals and facilitating the use of ICTs for example to track shipments and expedite routing. In low-income countries, a freight system with multimodal and low-carbon infrastructure can be a cost-competitive way to promote economic growth. Incentives should discourage the use of road freight by pricing mechanisms such as tolls, fuel or vehicle taxes, or through tighter regulation. At a minimum, diesel taxes should be as high as gasoline taxes. Some countries might also consider subsidies and R&D programs to promote intermodal freight.
Infrastructure investments are effective approaches to encourage modal shift in less developed freight markets but policies targeting the internalization of external cost should be preferred in well-developed markets in order to maximize welfare [122]. Combining multiple policies (policy packaging) has been emphasized as a valuable approach [164, 254], in particular the combination of cost increases for road transport with decreases in lead time of intermodal transport [210].
The lack of standardized, high-quality data in the freight sector limits informed policy analysis, formulation and validation. Standardized data could be collected using the Common Questionnaire for Inland Transport Statistics by the United Nations Economic Commission for Europe, the ITF and Eurostat, which is currently used by around 60 countries [100, 255]. The global potential for reducing GHG emissions through modal shift remains unknown, although there are a wide variety of national and regional estimates, targets and assumptions. A rigorously produced, and economically and politically realistic estimate would be valuable. Also missing from the literature is a marginal GHG abatement cost curve for freight that captures mode shifting and intermodal potentials, and that also accounts for ICT strategies. In addition, there are potentially adverse interactions of other decarbonization strategies with modal shift that need to be studied, such as the effect of more efficient and therefore cheaper trucking. It would also be instructive to examine potential disruptive changes in commodity demands that can result in stranded infrastructure assets, change freight market conditions but also free up rail or water freight capacity. This is particularly relevant as many countries shift away from coal for electricity generation.
Acknowledgments
This work was supported by the Center for Climate and Energy Decision Making through a cooperative agreement between the National Science Foundation and Carnegie Mellon University (SES-0949710). We thank participants in a workshop we organized at CMU in February 2017. We also thank W. Michael Griffin, Pierpaolo Cazzola, Jacob Teter, Alan McKinnon, Mike Roeth, and Scott Daniels.
Footnotes
- 3
Another term is co-modality, which is often used in Europe and refers to the efficient use of single or multiple modes in the same transport chain in order to reduce environmental impacts [86, 85]. We will refer to the shipment of goods on multiple modes as intermodal freight transportation in this paper.
- 4
There are limitations to using the weight-based metric of freight activity in tonne-km as the primary functional unit, as opposed to a volume- or value-based metric. Often, freight vehicles are full before they reach their weight limit [18]. However, because most public data are available in this unit, using this metric ensures broad comparability.
- 5
In those cases where coastal shipping cannot be distinguished from general maritime shipping, we have not included it. This might cause a general underestimation of water shipments in our analysis. See the supplementary information for details.
- 6