


Abstract
In the US, over 400 state and local incentives have been issued to increase the adoption of plug-in electric vehicles (PEVs) since 2008. This article quantifies the influence of key incentives and enabling factors like charging infrastructure and receptive demographics on PEV adoption. The study focuses on three central questions. First, do consumers respond to certain types of state level vehicle purchase incentives? Second, does the density of public charging infrastructure increase PEV purchases? Finally, does the impact of various factors differ for plug-in hybrid electric vehicles (PHEV), battery electric vehicles (BEV) and vehicle attributes within each category? Based on a regression of vehicle purchase data from 2008–2016, we found that tax incentives and charging infrastructure significantly influence per capita PEV purchases. Within tax incentives, rebates are generally more effective than tax credits. BEV purchases are more affected by tax incentives than PHEVs. The correlation of public charging and vehicle purchases increases with the battery-only driving range of a PHEV, while decreasing with increasing driving range of BEVs. Results indicate that early investments in charging infrastructure, particularly along highways; tax incentives targeting affordable BEVs and PHEVs with higher battery only range, and better reflection of the environmental cost of owning gasoline vehicles are likely to increase PEV adoption in the US.
Export citation and abstract BibTeX RIS
1. Introduction
The transport sector is responsible for 23% of global energy-related greenhouse gas (GHG) emissions and is expected to more than double by 2050 in the business-as-usual scenario (International Energy Agency (IEA) 2013); faster than other energy end use sectors (Sims et al 2014). In addition to the global climate implications, the sector is also the leading cause of local air pollution, with near-term damage from non-GHG air pollutants more severe than those from climate change (Tessum et al 2014, Delucchi 2000, Hill et al 2009, Michalek et al 2011). In the US, transport sector is responsible for 28% of GHG emissions; with 60% coming from light duty vehicles (LDVs) (ORNL 2013). Fulton et al (2013) estimates that if strong efficiency improvements and fuel switch measures could be achieved with LDVs, it is possible to meet GHG reduction targets without major changes in travel demand (Fulton et al 2013). With urban mobility highly dependent on personal transportation modes in the US, emissions reductions in LDVs are key to achieving significant GHG reductions in the transport sector.
Transitioning from conventional gasoline vehicles to electric drivetrains is one solution to reduce GHG emissions and improve urban air quality while providing greater economic security (Graver et al 2011). The IEA recommends that plug-in electric vehicles (PEV) make up at least 40% of new vehicle sales globally by 2040 to stabilize GHG concentrations at 450 ppm (IEA 2015). PEVs can not only produce near-zero tailpipe emissions but also lower GHG emissions, depending on the electricity generation mix (Orsi et al 2016, Wood et al 2017). As the US transitions to a cleaner electricity mix, PEVs should provide ample GHG and air quality benefits (Onat et al 2015). Actualizing these benefits require significant market penetration, which depends on solving challenges related to economics, consumer behavior, and a technology that deviates significantly from existing dominant design in terms of vehicle range, maintenance, and refueling (Anderson and Tushman 1990, Hickman and Banister 2012, Bjerkan et al 2016). Throughout the rollout of PEV models in the US, more than 400 supply- and demand-side incentives and regulations related to PEVs have been implemented at the state/local level by governments and electric utilities (AFDC 2016). In addition, there have been several initiatives by the federal government to promote PEV adoption (see appendix 1 of supplementary information (SI)) available at stacks.iop.org/ERL/13/074032/mmedia. PEV sales in the US increased by 40% in 2016, reaching a total stock of over 500 000 vehicles—driven in part by advances in PEV technologies, policy support, and infrastructure development (Wood et al 2017, IHS Markit 2017). However, PEVs (plug-in hybrid electric vehicles (PHEVs) and battery electric vehicles (BEVs) combined) still comprise less than 0.9% of all LDVs sold in the US (IEA 2017). Therefore, analysis of the efficacy of various PEV-promotional policies and other contextual factors is needed to guide future action.
1.1. What influences PEV adoption?
Several studies that examined hybrid electric vehicle (HEV) adoption in the 2000's found that incentives such as High Occupancy Vehicle (HOV) lane access and environmentalism (Diamond 2008, Diamond 2009), federal tax credits (Jenn et al 2013), state level sales tax waivers, gasoline price, income and age (Gallagher and Muehlegger 2011) were all significant predictors of HEV sales in US. In addition to these factors, for PEVs, the availability of public charging is identified as necessary to increase adoption (Zhou et al 2016).
PEV studies using ex-ante survey information show that lack of awareness about policy incentives (Krause et al 2013), high upfront cost, long recharging time and range anxiety of owning BEVs (Carley et al 2013), particularly in the US (Helveston et al 2015), are all factors that hinder adoption. Policy incentives that reduce fixed costs (Eppstein et al 2011) at the point of sale, such as the value added tax (VAT) exemptions in Norway (Bjerkan et al 2016), and the sale of PHEVs with small and less expensive batteries (Axsen and Kurani 2013) are identified as possible solutions to keep the cost of owning PEVs reasonable until battery costs fall.
A few studies using actual sales data indicate that technological and contextual factors such as charging infrastructure remain a key barrier to PEV adoption (Sierzchula et al 2014, Lutsey et al 2016) and incentivizing infrastructure buildup along with tax incentives and other non-monetary incentives may significantly increase adoption in the US (Jin et al 2014). Studies from Norway show that the density of public charging stations has the most impact on vehicle adoption, particularly BEVs, at the regional (Mersky et al 2016) and municipal level (Zhang et al 2016) while proximity to a big city with non-monetary incentives such as toll exemptions or parking exemptions increase BEV sales more than infrastructure itself.
Public charging infrastructure responds to demand from PEV owners while also alleviating range anxiety concerns of future PEV buyers. Existing methodologies have not clearly addressed this inherent endogeneity between charging infrastructure and PEV adoption, making it difficult to assess the importance of investments in charging infrastructure alongside consumer tax incentives. In addition, existing literature using actual vehicle sales data either compares countries that offer national-level tax incentives or compares regional sales within countries like Norway where tax incentives, such as VAT exemption, do not vary between regions. In this study, we exploit state level variation in incentives for different vehicle models, variation in gasoline price and other socio-economic factors. We also account for the natural diffusion of a vehicle technology and the endogenous impact of vehicle charging infrastructure on PEV adoption.
This study focuses on three central questions. First, do consumers respond to state-level vehicle purchase incentives? If so, do they respond better to a particular type of incentive, say a tax credit versus a rebate? Second, does the density of public charging infrastructure influence consumer decision to purchase PEVs? Finally, does the impact of various factors differ between PHEV and BEV or vehicle models within each vehicle category?
2. Description of key variables used in the analysis
2.1. Dependent variable—PEV, PHEV or BEV purchases
We used the natural log of PEV (PHEV and BEV combined); PHEV or BEV purchases per capita drivers (i.e. population above 16 years of age) as the outcome variable. We refer to per capita vehicle purchases simply as 'vehicle purchases' for convenience. The dependent variable is derived from IHS Automotive vehicle registration data. The data covers new vehicle registrations of 39 vehicle models from 2008–2016, out of which 19 are BEVs and 20 are PHEVs. The cumulative new PEV registrations since 2008, derived from IHS database, are approximately 523 000 vehicles. This is slightly lower than the 546 000 vehicles sold in this period as per the alternative fuels data center (AFDC) (see figures I and II in appendix 2 of SI). The figures also show that individual vehicle model registrations and sales numbers are similar. In using new vehicle registrations as the proxy for vehicle sales, we made the assumption that the percentage of PEVs not registered after being bought or becoming defunct from accidents were negligible. We also made the assumption that used PEVs were resold in the same state.
2.2. State level incentives
Since 2008, the US federal government and numerous states have offered a variety of PEV purchase incentives (see appendix 1 of SI for details). These include non-monetary incentives such as HOV lane access, electric vehicle supply equipment (EVSE) installation credits, home charging rate discounts offered by local utilities, and many other (see table 1). They also include monetary tax incentives such as income tax credits, rebate, and sales tax waiver that vary between states and in some states vary from one vehicle model to another based on the vehicle's battery capacity, driving range, or manufacturer's suggested retail price (MSRP) (see table 2).
Table 1. Types of Incentives offered for PEVs in the US, 2008–2016.
| Incentive type | State |
|---|---|
| Income tax credit | Colorado⁎, Louisiana, Maryland, South Carolina, Utah; Georgia⁎+, West Virginia+, Oregon+ |
| Rebate | California, California#, Connecticut, Massachusetts, Pennsylvania; Hawaii+, Illinois+, Texas+ |
| Sales tax waiver | New Jersey⁎, Washington |
| HOV lane access | Arizona⁎, California, Florida, Georgia, Hawaii, Maryland, Nevada, New Jersey#, New York#, North Carolina, Tennessee, Utah, Virginia |
| Home charger installation discount | California, California#, Delaware, Texas, Maryland, Oregon, Washington#, Colorado, Georgia, Louisiana, Maryland; Oregon#+, Pennsylvania#+, South Carolina#+, Tennessee#+, Texas#+, Virginia#+, Illinois+, Indiana#+, Michigan#+, Massachusetts#+, New Jersey#+, North Carolina#+, Arizona#+ |
| Home charging rate discount | Arizona#, California#, Hawaii#, Illinois#, Indiana#, Michigan#, Nevada#, New York#, Pennsylvania#, Maryland#; Colorado#+, Virginia#+, Kentucky#+, Minnesota#+ |
| Parking fee exemption | Arizona⁎, California, Hawaii, Nebraska, |
| Excise tax waiver | Arizona⁎, Nevada, DC, Virginia |
| Emission test waiver | Colorado, Idaho, Illinois, Massachusetts, Michigan, Missouri, New York, North Carolina, Ohio, Rhode Island, Virginia, Washington, Nebraska+ |
| Registration fee waiver/reduction | Arizona⁎, DC, Illinois⁎, Nebraska, Iowa+ |
| PEV road use tax exemption | Arizona⁎ |
| PEV road use fee/registration fee | Registration fee—Michigan, Washington; Road use fee—Colorado, Georgia⁎, Idaho, North Carolina, Oregon, Virginia |
⁎For BEV only. +Expired. #Local incentive. Updated from afdc.energy.gov as of December 2016.
Table 2. Details of tax incentives for PEVs in the US, 2008–2016. Source: self-generated from AFDC laws and incentives data base.
| Tax incentives | Vehicle type | Timeline | Incentive range |
|---|---|---|---|
| Income tax credit | |||
| Colorado | BEV and PHEV | Q1 2012—current | Up to $6000, credit = (net purchase price after federal and local credits⁎battery capacity)/100 |
| Louisiana | BEV and PHEV | Q3 2009—current | Up to $3000 until August 2015; after August 2015, 7.2% of the incremental cost up to $1500 |
| Maryland | BEV and PHEV | Q2 2014—current | Oct 2010—July 2014—$600 for < 10 Kilowatt Hour (kWh); $700 for 10–15 kWh; $1000 for >15 kWh; starting July 2014—$125⁎battery power, up to $3000 |
| South Carolina | PHEV only | Q3 2012—current | $667 + $111 for every additional kWh battery beyond 5 kWh; max $2000 |
| Utah | BEV and PHEV | Q1 2009—current | $605 until December 2014; from January 2015, 35% of MSRP minus any credits received up to $1500 for BEV; $1000 for PEV |
| Georgia | BEV only | Q1 2008—Q2 2015 | $5000 |
| West Virginia | BEV and PHEV | Q1 2008—Q2 2013 | 35% of MSRP minus any credits up to $7500 |
| Oregon | BEV and PHEV | Q1 2008—Q4 2011 | 25% of incremental cost up to $1000 |
| Rebate | |||
| California | BEV and PHEV | Q2 2010—current | $2500 for BEV; $1500 for PHEV; San Joaquin valley rebate—$3000 for BEV and $2000 for PHEV |
| Connecticut | BEV and PHEV | Q2 2015—current | $750 for battery < 7 kWh; $1500 for 7–18 kWh; $3000 for 18 kWh above; vehicle MSRP should be < $60 000 |
| Delaware | BEV and PHEV | Q2 2015—current | $2200 for battery > 4 kWh until October 31, 2016. From November 1, 2016, $3500 for BEVs < $60 000 MSRP, $1000 for BEVs > $60 000 MSRP, $1500 for PHEVs including range extenders. |
| Massachusetts | BEV and PHEV | Q2 2014—current | $2500 if > 10 kWh and $1500 if < 10 kWh |
| Pennsylvania | BEV and PHEV | Q2 2008—current | September 2011 to March 2013—$3500 if >= 10 kWh and $1000 if < 10 kWh; April 2013 to February 2014—$3000 if >= 10 kWh and $1000 if < 10 kWh; March 2014—$2000 if >= 10 kWh and $1000 if < 10 kWh |
| Hawaii | BEV and PHEV | Q3 2010—Q2 2012 | $4500 flat rebate |
| Illinois | BEV and PHEV | Q1 2008—Q2 2015 | 80% of incremental cost up to $4000 for limited number of vehicle models. Rebates for 2014 were retroactively withdrawn. |
| Texas | BEV and PHEV | Q2 2013—Q2 2015 | $2500 for BEVs except TESLA, $1500 for PHEV |
| Sales tax waiver | |||
| New Jersey | BEV only | Q1 2008—current | 7% sales tax waived on BEVs |
| Washington | BEV and PHEV | Q1 2009—current | 6.5% sales tax waived for BEV; 0.35% waived for PHEV; from July 2015, sales tax waived only if MSRP < $35 000 and electric driving range > 30 miles |
In the analysis, we included income tax credit, rebate, and sales tax waiver as a percentage of a vehicle model's MSRP. Doing so allows us to account for the marginal diminishing value to tax incentives on vehicles with higher MSRP. Based on a review of existing PEV literature synthesized in Hardman et al (2017), we also included HOV lane access as a factor likely to influence PEV adoption. Since nearly 80% of PEV owners charge at home (INL 2015, Plug Insights 2013), the availability of discounts at the state and local level for home EVSE installation and reduced utility charges for nightly charging are also included as factors that may influence PEV adoption.
2.3. PEV charging infrastructure
Public charging networks expand in response to charging demand from existing PEV owners while simultaneously promoting further consumer acceptance by alleviating range anxiety (Wood et al 2017). Public charging stations (hereinafter referred to as EVSEs) in recent years have installed level 2 (L2 AC) or DC-Fast charging (DCFC) EVSEs that charge up to 48 times faster than the 120 V level-1 (L1 AC) chargers (AFDC 2018). There has been a substantial increase in L2 installations around city centers and DCFCs along highways since 2015 (see figure 1) (Francfort et al 2017).
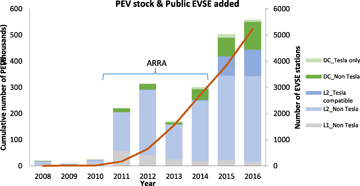
Figure 1. PEV stock and public EVSE added (data source: afdc.energy.gov).
Download figure:
Standard image High-resolution imageIn the analysis, we represent PEV charging infrastructure by the number of public EVSE stations (not individual outlets) per capita drivers in each state in every quarter. We measured EVSE density as a ratio of per capita drivers and not per square mile because per capita EVSEs are a better proxy for EVSEs being in the vicinity of the users regardless of a state's population density. Figure 2 shows that the number of public EVSEs and gasoline price to a lesser degree appears to be related to vehicle purchases at the national level, inviting our in-depth analysis at the state level.

Figure 2. Vehicle purchases, public EVSE stations, and gasoline price. (Data source: IHS vehicle registration database, afdc.energy.gov and eia.gov).
Download figure:
Standard image High-resolution image3. Methodology
Variables used in the analysis and the summary statistics are outlined in tables I and II of appendix 2 in SI. We first estimated the number of vehicles sold in a state s, for vehicle model v, in quarter t (2008–2016) using a panel data fixed effects model, with tax incentives, non-monetary incentives, charging infrastructure, and state demographics as key vectors influencing PEV adoption.
Model 1:

The fixed effects model, however, does not control for the natural evolution of the technology, the influence of existing PEV owners on future owners (i.e. threshold effect) (Eppstein et al 2011, Sierzchula et al 2014), and the endogenous relationship between charging infrastructure and vehicle sales. Hence, we modified the base model with a lagged dependent variable as an explanatory variable to control for technology diffusion and the threshold effect, and lagged EVSE infrastructure variable to account for the endogeneity between charging infrastructure and PEV sales.
Model 2:

where F is the sales function with a lagged dependent variable and lagged infrastructure variable. Ψ represents the vectors of parameters and X represents the explanatory variables. Equation (1) transforms into the following:
Including the lagged dependent variable in a fixed effects model, however, violates strict exogeneity of explanatory variables with the error term. Therefore, we followed a generalized method of moments (GMM) approach (Arellano and Bond 1991) to instrument the lagged PEV sales and public EVSE infrastructure with their respective deeper lags.
Under the American Recovery and Reinvestment Act (ARRA), the federal government earmarked $37 million for installing about 4600 charging points across the nation (Peterson and Michalek 2013). Federal ARRA support to install EVSEs in early adopter states such as Illinois, New York, and Washington led to a significant buildup of EVSE infrastructure between 2011 and 2014 when PEV adoption had yet to scale (see figure 1). Instrumenting public EVSE variable with its own deeper lags, however, does not allow us to understand the influence of early adopters (i.e. ARRA recipients) and demand from existing PEV owners on public EVSE infrastructure. To account for this, we used a system of two equations; with the first stage of the model instrumenting public EVSE infrastructure with the timeline of ARRA funded EVSEs in different states and the cumulative stock of PEVs in each state. These two factors effectively account for early adopters and demand from existing PEV owners for additional public charging infrastructure. Lagged by one quarter, public EVSE estimates from the first stage are used in the main sales equation. We report results from Model 3 separately in section 4.3.
>Model 3: Infrast = G (ϕ,Zsvt, Qst−1)
Log (Ysvt) = F(ψ,Log(Ysvt−1), Xsvt, Infrast−1)—Second stage is same as Model 2.
The empirical models allow for national trends that apply to vehicle models in all states and for temporal variations of a vehicle model irrespective of the state in which they are sold. To control for unobserved heterogeneities, we include (state) × (vehicle model) fixed effects, ∝sv and (vehicle model) × (time) fixed effects, θvt. We accounted for potential heteroscedasticity by using (state) × (vehicle model) clustered robust standard errors on the remaining error term, εsvt. While (state) × (vehicle model) fixed effects controls for time invariant preferences for a vehicle in a state, (time) × (vehicle model) fixed effects controls for state invariant trends in sales and countrywide production shocks for a vehicle model. We did not add federal incentives to the state incentive variables, as federal incentives apply to vehicles bought in all states. We controlled for state-level demographics that may explain a state's preference toward PEVs.
Finally, in addition to PEV specifications, we ran model specifications separately for PHEVs and BEVs as heterogeneity in purchase decisions are likely to be substantial between the two vehicle segments (Axsen et al 2015) and policies promoting PEVs overall may not affect PHEVs and BEVs equally (Vergis and Chen 2015). Additionally, households who prefer BEVs tend to have different income; education, recharge access, environmental concern, and technological awareness characteristics when compared to those who prefer PHEVs (Axsen et al 2016).
3.1. Model limitations
We caution that our estimates may suffer from bias due to the following reasons. First, additional vehicle registrations data may not always serve as the best proxy for vehicle purchases as our assumptions on the percentage of PEVs not registered after being bought, moved to another state, or becoming defunct from accidents may underestimate the effect of incentives on vehicle purchases. Second, our average estimates at the state level might miss many of the relationships that would be apparent at the city/county level. Third, implementation of incentives may have caused delay for consumers in some states and would not have had any impact on vehicle purchases in that time frame. In addition to statistical limitations, the model is agnostic to intra PEV pollution differences as collecting temporally and spatially varying data on driving patterns, individual driving behavior, and temperature is beyond the scope of this article.
4. Results
4.1. PEV adoption
The estimates for tax incentives and public EVSEs for the fixed and GMM models (i.e. PEV_model1 and PEV_model2 specifications) in figure 3 (table III in appendix 3 of SI for details) show that the traditional fixed effects model significantly overestimates the relationship between the key explanatory factors and PEV purchases. Controlling for the natural diffusion of a vehicle technology using lagged PEV purchases in the GMM model, a 1% increase in tax incentives relative to a vehicle's MSRP is associated with only a 1.15% increase in per capita PEV purchases versus the 2.9% increase in purchases estimated by the fixed effects model. Also accounting for the inherent endogeneity between public EVSEs and vehicle adoption using the variable's deeper lags, the GMM model shows that one additional EVSE per capita is associated with a 3% increase in per capita PEV purchases compared to the 6.2% estimated by the fixed effects model.
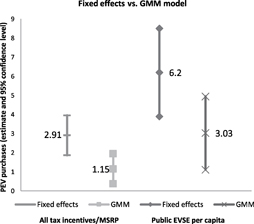
Figure 3. Fixed effect vs. GMM model (note: table III in appendix 3 of SI provides estimates for all explanatory variables and statistics). (Data source: IHS vehicle registration database, afdc.energy.gov and eia.gov)
Download figure:
Standard image High-resolution image4.2. Vehicle category and adoption
PEV_main estimates in the sub-plots of figure 4 (table IV in appendix 3 of the SI) shows that within tax incentives, rebates influence PEV adoption more than tax credits or sales tax waivers. Isolating the effects for PHEVs and BEVs separately, we find that both tax credits and rebates are significant for BEVs when compared to PHEVs (highlighted green in the first two sub-plots). BEV_main in sub-plots 1 and 2 show that a 1% increase relative to the vehicle's purchase price is associated with a 1.8% increase in BEV purchases with a tax-credit and 2.16% with a rebate. For instance, if the proposed increase in California's existing $2500 rebate to $10 000 (i.e. 25% increase for a $30 000 vehicle) materialized, it may have led to 50% higher adoption. Within BEVs, Nissan Leaf purchases are equally explained by both state tax credits and rebates, while Tesla purchases are equally explained by rebates and sales tax waivers. Comparing PHEV_main and BEV_main in subplot no. 4 of figure 4, we see that one additional EVSE per capita is associated with a 7.2% increase in BEV purchases yet only a 2.56% increase in PHEV purchases. Within BEVs, Nissan Leaf purchases are highly correlated to public EVSEs while Tesla Model S purchases are not influenced by the presence of Tesla-compatible public EVSEs. Within PHEVs, the purchases of Volt are strongly correlated with public EVSE stations while the Prius purchases are not.

Figure 4. Vehicle type, attributes and adoption (note: statistically significant estimates are highlighted in green and mean value provided); Table IV in appendix 3 of SI provides estimates of all explanatory variables and statistics.
Download figure:
Standard image High-resolution image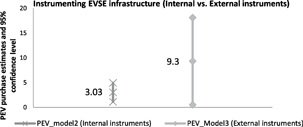
Figure 5. Internal vs. external instrumenting for EVSE infrastructure (note: table V in appendix 3 of SI provides estimates of all explanatory variables and statistics).
Download figure:
Standard image High-resolution imageStates with HOV lane access incentive for PEVs registered higher purchases when compared to states without the incentive. The correlations are relatively smaller but significant after we control for California (see table VII of SI). Presence of HOV lane access is associated with stronger purchases of Prius plug-in and BEVs in particular (subplot no. 5). Gasoline price levels in a state are strongly correlated with the purchases of the Prius plug-in when compared to other top selling PHEV and BEVs (subplot no. 6). BEV purchases are more correlated to median household incomes when compared to PHEVs. However, the associations become less clear when we estimate the impacts for the top-selling vehicle models in the two vehicle categories (subplot no. 7). Finally, environmental awareness, proxied by the league of conservation voters (LCV) score of house representatives from different states are significantly correlated with the purchases of PHEV vehicles such as Volt and Prius Plug-in (subplot no. 8).
4.3. Influence of early adopters
PEV_model3 specification (see figure 5, table V of SI) shows results from instrumenting public EVSEs with proxies for early adopters and consumer demand for public charging. We used the data on public EVSE stations built with funding from ARRA program as the proxy for early adopters in a state. We used a one quarter lagged cumulative stock of PEVs as the proxy for consumer demand. Figure 5 shows that the correlation of public EVSE per capita on PEV purchases is thrice as strong when compared to instrumenting the variable with its own deeper lags. This indicates that incentivizing early adopters through programs like ARRA to build infrastructure may lead to higher PEV adoption than one would expect by observing the increase in EVSE alone. The estimates of tax incentives and other factors remain consistent between PEV_model 2 and PEV_model 3 specifications.
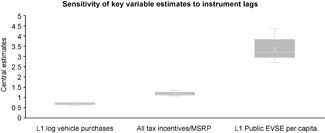
4.4. Sensitivity analysis
One of the shortcomings of the Arellano-Bond generalized method of moments model is that it is sensitive to the number of instruments generated in the estimation process (Roodman 2009). Hence, we vary the instrument lags from two quarterly time periods until twelve time periods to test the robustness of our results to the number of instruments used. Results are shown in figure 6 for the incentive and infrastructure variables (see table VI in appendix 3 of the SI for details). Figure 6 shows that the estimates of incentives and public EVSEs are relatively robust to specifications.
5. Discussion and conclusions
To render our findings more usable to policymakers (appendix 4 of SI), we discuss possible mechanisms causing the correlations that are novel, counter intuitive or conforming to existing studies. Overall, tax incentives of any type and public charging infrastructure are dominant factors in driving PEV adoption. Rebates are more effective than tax credits. This finding is in line with studies that have pointed out that incentives closer to the point of sale are more effective, likely due to hyperbolic discounting by consumers of rewards that arrive later (Hardman et al 2017, Yang et al 2016, IEA 2017). In countries such as Norway and Netherlands, where a point of sale VAT exemption for PEVs is combined with high VAT for conventional gasoline vehicles, PEV market shares are significantly higher (Hardman et al 2017, Aasness and Odeck 2015, Bjerkan et al 2016). Estimating tax incentives as a percentage of a vehicle's MSRP demonstrates a diminishing marginal return to every dollar incentive offered for higher MSRP vehicles (i.e. $300 incentive on a $30 000 vehicle has the same effect as a $700 incentive for a $70 000 vehicle). This would imply that incentives are more effective in increasing adoption when targeting less expensive PEVs.
Figure 6. Sensitivity analysis (note: table VI in appendix 3 of SI provides estimates of all explanatory variables and statistics).
Download figure:
Standard image High-resolution image
Tax credits and rebates may be less effective on PHEVs than BEVs because their incremental cost (over a traditional gasoline vehicle) is lower. States such as Washington and Oregon registered a higher number of PHEV purchases with nearly insignificant amount of sales tax incentive or no tax incentive. These findings do not conform to existing literature with the exception of a modeling study in California (DeShazo et al 2017), which estimates that customers are more likely to purchase PHEVs over BEVs in the absence of incentives or with the existing incentives. Among BEVs, equal correlation of tax credits and rebates on Nissan Leaf purchases may be because of high lease rates where Nissan captures the incentive and passes it on to the driver. Similarly, equal correlation of rebates and sales tax waivers for Tesla Model S purchases may indicate that Tesla buyers with higher incomes do not discount money received later. The lack of impact of tax credit on Tesla purchases may indicate the fact that high income earners may not be eligible to apply for a tax credit. The significant correlation of Tesla sales in states that offer rebates or sales tax waivers contrast findings from modeling and post purchase surveys (Tal and Nicholas 2016, Hardman and Tal 2016) that Tesla buyers would have bought their vehicle even in the absence of tax incentives.
The presence of public charging infrastructure has a strong influence on vehicle purchases decisions. The result conforms to findings from studies that analyzed adoption trends in other countries like Norway (Zhang et al 2016, Mersky et al 2016). Early investments in infrastructure, even if they would be underutilized for some time, is likely to incentivize early adopters and result in a multiplying effect on PEV adoption (figure 5). The correlation of infrastructure with vehicle purchases strengthens with the battery-only driving range of a PHEV, while weakening with increasing driving range of BEVs. Neither the sales of Tesla Model S nor the Prius (the two poles of battery range) are affected by the availability of charging infrastructure. This may be due to the following factors. First, unlike long-range BEV owners, short-range BEV owners may be more range anxious and consider public charging availability seriously when making purchase decisions. Second, PHEV drivers with a significant electric driving range may base their purchase decision more on total cost of ownership, which would include utilizing low-cost/free electric power from public EVSEs whenever possible.
Environmental awareness seems to drive PHEV adoption more than the availability of tax incentives, as embodied by the higher sales of PHEVs across environmentally friendly states with decreasing price differentials against gasoline vehicles. Higher gasoline prices and higher median household incomes significantly correlate with vehicle adoption, more consistently with PHEVs. Finally, HOV lane access correlates to higher PHEV and BEV adoption, with correlation surprisingly stronger for BEVs. If HOV lane access is the only reason to purchase an alternative vehicle, it is likely that a customer would choose a less expensive PHEV model.
The empirical results discussed in this article are important for policymakers who need to make informed decisions to maximize the adoption of emissions reducing transport technologies. In summary, our results indicate that to further increase PEV adoption, policy makers may want to incentivize public charging infrastructure along highways to cater to future vehicle models that are likely to have longer driving range, tailor tax incentives closer to the point of sale for BEVs at the lower end of the price spectrum and PHEVs with longer battery range, and better internalize the environmental cost of owning conventional gasoline vehicles. With the widespread introduction of PEVs, the data is only getting more robust. This should allow future researchers to confirm and refine the relationships described in this article as well as assesses the short and long-term emissions benefit derived from incentivizing electric vehicles.
Acknowledgments
The authors would like to thank Margo Melendez, Wendy Dafoe, Aaron Brooker, Eric Wood, and Marc Melaina of the National Renewable Energy Lab for their invaluable help throughout this project. Authors are also grateful to Kelly Sims Gallagher of Tufts University and David Greene of the University of Tennessee for their advice and the 2017 ETH Zurich SusTec Academy for their valuable inputs and suggestions. This work was authored in part by Alliance for Sustainable Energy, LLC, the manager and operator of NREL for the US. DOE under Contract No. DE-AC36-08GO28308. Funding was provided by US. DOE's Office of Energy Efficiency and Renewable Energy—Vehicle Technologies Office. The views expressed in the article do not necessarily represent the views of the DOE or the US Government. The US Government retains and the publisher, by accepting the article for publication, acknowledges that the US Government retains a nonexclusive, paid-up, irrevocable, worldwide license to publish or reproduce the published form of this work, or allow others to do so, for US Government purposes.