

Abstract
Variations in land surface albedo and snow-cover strongly impact the global biosphere, particularly through the snow-albedo feedback on climate. The seasonal freeze-thaw (FT) transition is coupled with snowpack melt dynamics and strongly impacts surface water mobility and the energy budget in the northern (≥45°N) arctic and boreal region (ABR). However, understanding of the regional variation in snowmelt and its effect on the surface energy budget are limited due to sparse in situ measurements of these processes and environmental constraints on effective monitoring within the ABR. In this study, we combined synergistic observations from overlapping satellite optical-infrared and microwave sensor records to quantify the regional patterns and seasonal progression in wet snow conditions during the spring snowmelt and autumn snow accumulation periods across Alaska and western Canada. The integrated satellite record included daily landscape FT status from AMSR microwave brightness temperature retrievals; and snow-cover extent, black sky albedo and net shortwave solar radiation (Rsnet) derived from MODIS and AVHRR observations. The integrated satellite records were analyzed with in situ surface air temperature and humidity observations from regional weather stations over a two-year study period (2015–2016) overlapping with the NASA ABoVE (Arctic Boreal Vulnerability Experiment). Our results show a large (79%) mean decline in land surface albedo between dry snow and snow-free conditions during the spring (March–June) and autumn (August–November) transition periods. Onset of diurnal thawing and refreezing of the surface snow layer and associated wet snow conditions in spring contributed to an approximate 25% decrease in snow cover albedo that extended over a seven to 21 week snowpack depletion period. The lower wet snow albedo enhances Rsnet by approximately 74% (9–10 MJ m−2 d−1) relative to dry snow conditions, reinforcing snowmelt and surface warming, and contributing to growing season onset and activation of biological and hydrological processes in the ABR. These results contribute to better understanding of snow albedo feedbacks to Arctic amplification, and the representation of these processes in global Earth system models.
Export citation and abstract BibTeX RIS

Original content from this work may be used under the terms of the Creative Commons Attribution 3.0 licence.
Any further distribution of this work must maintain attribution to the author(s) and the title of the work, journal citation and DOI.
1. Introduction
Variations in seasonal snow-cover and land surface albedo strongly influence the energy budget and regional climate (i.e. termed the snow-albedo feedback), particularly at higher latitudes and elevations where there is a significant snow season (Fletcher et al 2009, Kattsov et al 2007). The snow albedo significantly decreases between dry and wet snow conditions due to increasing snow liquid water and grain size (Colbeck et al 1982, Wiscombe and Warren 1980). The seasonal onset of snowpack melt, and the associated decline in land surface albedo in the spring, accelerates runoff and the new release of fresh water in the landscape, and the enhancement of land-atmosphere trace gas exchanges (NASEM 2018, Cassidy et al 2016, Gazovic et al 2010). Snow cover conditions also influence surface sensible and latent energy partitioning, with general dominance of sensible energy under frozen conditions and a shift to latent energy dominance under wet snow conditions (Euskirchen et al 2007, Fletcher et al 2009). This transition can result in abrupt changes in lower tropospheric air temperature and humidity, seasonal climate (Betts et al 1998, Stiegler et al 2017), and the partitioning of surface net radiation between air, soil, snow and vegetation (Marsh et al 2010). In addition, the change in surface energy flux during snowpack melt can modulate increases in vegetation growth and evapotranspiration in boreal, tundra, and mountain ecosystems (Semenchuk et al 2016, Shuai et al 2013).
Several studies have reported an increase in snowmelt duration and diurnal temperature variability in recent decades (Garcia and Townsend 2016, Henry 2008). However, previous studies have mainly focused on variations in the surface energy flux between snow-covered and snow-free conditions (Betts et al 2014, Euskirchen et al 2007), and the impact of spring snowmelt timing on regional weather patterns and ecosystem processes (Peng et al 2013, Pulliainen et al 2017). The reported contribution of net radiation to snowpack melt varies widely (28%–75%), while variations in snow albedo and surface energy partitioning during the snow-cover transition are still uncertain (Baker et al 1999, Cline 1997, Leroyer et al 2010, Stiegler et al 2016). These uncertainties in energy partitioning have contributed to inaccuracies in snow albedo radiative forcing (Xiao et al 2017), and errors in weather and hydrological forecasts (Betts et al 1998, Kustas et al 1994).
Surface albedo, snow, and temperature measurements from in situ monitoring sites have been used to study snowpack melt, albedo change, and surface energy partitioning, but opportunities for global monitoring are severely limited by sparse measurements of these processes at high latitudes and elevations (Shati et al 2018, McColl et al 2016). Alternatively, current satellite remote sensing records provide complimentary observations, with enhanced spatial and temporal coverage, that are well suited for characterizing seasonal variations in landscape freeze-thaw (FT) dynamics, land surface albedo, snow-cover extent (SCE) and surface radiation; these observations provide the means for addressing questions on how seasonal changes in these land components affect surface energy partitioning at regional to global scales.
Satellite optical-infrared (IR) remote sensing in the ABR is constrained by low solar illumination and persistent cloud-atmosphere contamination effects. Alternatively, satellite microwave radiometers can detect FT and snow-cover properties with limited impact from these effects, while still providing consistent daily land surface observations, albeit at relatively coarse spatial resolution as compared with optical-IR sensors. Recent studies have utilized satellite multi-sensor data fusion techniques to provide enhanced information on snow-cover properties with reduced constraints relative to single sensor retrievals (Kim et al 2015, Pan et al 2018, Zhu et al 2017).
In this study, satellite optical-IR and passive microwave remote sensing data records were analyzed together to quantify the effects of seasonal FT transitions on snowpack melt, land surface albedo and energy exchange over Alaska and Western Canada. The regional study area is defined by the national aeronautics and space administration (NASA) arctic boreal vulnerability experiment (ABoVE), a multi-year field campaign designed to assess the interactions among vegetation, soil and permafrost characteristics, hydrology, and disturbances in the ABR (Goetz et al 2011). The ABoVE domain encompasses approximately 22% (~6.4 million km2) of the northern (≥45°N) ABR. The ABR is warming at roughly twice the mean global rate due to the snow/ice-albedo feedback, which is contributing to widespread changes in regional ecosystems (Rawlins et al 2010, Loranty et al 2016). Satellite microwave remote sensing observations of landscape FT status show recent trends toward earlier and longer non-frozen seasons over the ABR coinciding with regional warming, which have been linked to longer potential growing seasons (Kim et al 2014), permafrost thawing and active layer deepening (Park et al 2016a), and changes in snow cover conditions and hydrological budgets (Zhang et al 2011, Watts et al 2012).
Despite the importance of seasonal FT transitions on eco-hydrological processes over the ABR, few studies have investigated relations between FT status and seasonal snow-cover properties, and their influence on the surface energy budget. The objective of this paper is to (i) identify the seasonal transitions between cold, dry and warmer, wet snow conditions during the shoulder seasons in boreal forest and arctic tundra, and (ii) characterize their influence on land surface albedo and the energy budget. To achieve these objectives, we used complimentary satellite observations from passive microwave and optical-IR sensors, with concurrent in situ meteorological measurements from surface weather stations. These datasets were used to analyze the characteristics and regional impacts of wet snow conditions during seasonal snow-cover depletion and accumulation periods for the two major ABR biomes (arctic tundra and boreal forest) represented within the ABoVE domain, whereby these biomes have also shown divergent vegetation growth responses to recent ABR warming trends (Kim et al 2014).
2. Data selection
In this study, global satellite observations were used with in situ ground measurements within the ABoVE domain to investigate spatial and temporal variations in snowpack melt, and associated linkages with surface energy partitioning and seasonal weather. The satellite records were used to evaluate spatial and seasonal variations in SCE, FT status of the surface snow layer, land surface albedo and net solar radiation. The satellite data were derived from overlapping optical-IR and passive microwave sensor retrievals with variable spatial gridding ranging from 0.5–25 km resolution and daily temporal repeat. The satellite observations were spatially aggregated within arctic tundra and boreal forest biomes using a 1 km resolution regional land cover map (figure S1; SNAP 2012). Spatial aggregation was used to elucidate the seasonal behavior of these major biomes and mitigate the effects of increased data loss in the optical-IR retrievals during the shoulder seasons. Daily surface air temperature and humidity observations from in situ weather stations were also used to evaluate the satellite observed transitions between relative wet and dry snow-cover conditions during spring (March–June) and autumn (August–November) periods.
Daily surface air temperature measurements were obtained from 315 WMO weather stations located within the ABoVE domain (NWS 1988). Relative humidity (RH) was derived from the ratio of actual and saturation vapor pressures estimated from station daily average surface air and dew point temperature (Tavg, Tdew) measurements (Alduchov and Eskridge 1996). Here, the air temperature and RH (percent) records were used as a proxy of the driving forces for snowmelt (Bothale et al 2015, Kustas et al 1994).
A daily FT data record was developed over the ABR domain using similar calibrated 36.5 GHz, vertical-polarization (V-pol) Tb records from the NASA Advanced Microwave Scanning Radiometer for EOS (AMSR-E) and advanced microwave scanning radiometer 2 (AMSR2) (Du et al 2014) sensors. The AMSR-E and AMSR2 Tb integration is summarized in the supplement (text S1 available at stacks.iop.org/ERL/13/075009/mmedia). The integrated AMSR-E and AMSR2 (hereafter denoted as AMSR) Tb time series was processed separately for ascending and descending orbital crossings to produce information on morning (AM), afternoon (PM) and composite daily FT conditions using a modified seasonal threshold algorithm (MSTA; Kim et al 2017a, Kim et al 2018). A detailed summary of the MSTA approach, and the resulting FT product accuracy and performance is provided in the supplement (text S2). Four categorical daily FT classification levels are provided, including frozen (AM and PM frozen), non-frozen (AM and PM thawed), transitional (AM frozen and PM thawed) and inverse transitional (AM thawed and PM frozen) status. The FT record represented by the 36.5 GHz Tb retrievals characterizes the predominant frozen and non-frozen status of the land surface within the sensor footprint without distinguishing among vegetation, snow cover and surface soil conditions (Kim et al 2017a).
The moderate resolution imaging spectroradiometer (MODIS) sensors are operational aboard the NASA EOS Terra and Aqua satellites. The respective MODIS descending and ascending orbital nodes for the Terra and Aqua satellites cross the equator at ~10:30 AM and 1:30 PM local time. Here, we used the SCE product from the MODIS Terra and Aqua daily fractional snow cover data record produced at 500 m resolution (collection 6; Hall and Riggs 2016a, 2016b). The MODIS SCE product masks out areas affected by excessive cloud cover, ocean and polar darkness, while the remaining valid SCE retrievals were used to classify and analyze the regional and seasonal distribution of snow-cover conditions.
Daily land surface albedo retrievals from MODIS were used to capture the rapidly changing surface conditions during the spring snowpack melt and autumn snow accumulation periods. The black-sky albedo (BSA), defined as the directional hemispherical reflectance over the shortwave (0.3–5µm) spectral range, was obtained from the MODIS Terra and Aqua albedo daily L3 global 500 m SIN Grid product (MCD43A3 version 6; Wang et al 2018) for local solar noon conditions (Schaaf et al 2011). The MODIS BSA record was used as a proxy for the total solar shortwave albedo (Peng et al 2013).
The national oceanic and atmospheric administration (NOAA) climate data record (CDR) for the Extended Advanced Very High Resolution Radiometer (AVHRR) Polar Pathfinder (APP-x) includes observations at 4 AM and 2 PM local solar times in a 25 km polar EASE-grid format (Key et al 2014). The NOAA CDR Pathfinder record includes daily surface solar shortwave and longwave radiation estimates extending from 1982 present. The daily surface downwelling solar shortwave radiation (Rsdn) at 2 PM from the NOAA record was used as a proxy for incoming solar radiation in this study. The Rsdn data was also used with estimated outgoing shortwave radiation (OSR) to define surface net solar shortwave radiation (Rsnet):

For consistency, all data records in this investigation were resampled to the same 6 km polar EASE-Grid 2 projection format. A detailed description of the data processing and biome classification method is provided in the supplement (text S3, S4). The satellite data records were spatially aggregated and analyzed with in situ Tavg and RH records from regional weather stations within each biome to evaluate seasonal variations in snowpack conditions.
3. Methods
3.1. Satellite dry/wet/no snow flags and annual wet snow duration
Daily snow cover presence/absence was determined for each 6 km grid cell using the MODIS SCE record, where a grid cell with more than 50% SCE was assumed to be snow covered (Kim et al 2015). The MODIS SCE data was used with the AMSR FT record to define grid cells classified as being snow covered and under transitional FT status (i.e. AM frozen and PM non-frozen conditions; Kim et al 2017a); a wet snow flag was assigned to these grid cells on a daily basis during the spring (March–June) and autumn (August–November) transition periods. The MODIS SCE data was also used with the AMSR FT record to define snow covered grid cells under AMSR classified frozen conditions (AM and PM); these grid cells were assigned a dry snow flag on a daily basis. No snow (i.e. snow-free) conditions were determined where the AMSR FT record indicated non-frozen (AM and PM) conditions and the MODIS SCE record indicated snow absence. The MODIS SCE and BSA observations were used with spatially collocated daily Tavg and RH observations from regional weather stations to evaluate variations in seasonal weather patterns and the surface energy budget for three general snow-cover characteristics, including relatively dry-, wet-, and no-snow conditions within the classified tundra and boreal forest biomes.
The duration of wet snow conditions (days) was derived from the combined satellite record on a calendar year basis for each grid cell as the number of days with a wet snow flag. The annual wet snow duration for each grid cell was expressed as a proportion (%) of the annual snow cover season defined by the MODIS SCE record. Missing data were gap-filled using temporally adjacent observations for each grid cell (Zhao et al 2011) and an assumption of no significant change in MODIS SCE conditions between successive days.
3.2. Primary spring onset
The spring onset is a sensitive climate indicator that is closely linked with the timing of seasonal thawing and snowpack melt, initiation of the vegetation growing season and the spring flood pulse (Jönsson et al 2010, Park et al 2016b). Primary spring onset refers to hydrological spring in this study and was determined from temporal classification of the timing (DOY) of the most rapid MODIS BSA spring decrease rate for each grid cell and year of record (Julien and Sobrino 2009, Zhang et al 2006). Temporal gap-filling of the MODIS BSA record was applied using temporally adjacent observations for each grid cell. The date (DOY) of BSA decrease was determined for each grid cell using an optimal edge detection and Gaussian kernel convolution approach suitable for identifying large seasonal changes relative to background noise (Joshi et al 2001, McDonald and Kimball 2005). The primary spring thaw date was determined from the AMSR daily FT record as the first date for which 12 out of 15 consecutive days from January–July was classified as non-frozen (Park et al 2016b, Zhang et al 2011). The resulting BSA and FT metrics were then used as proxies to evaluate variations in hydrological spring over the study domain.
4. Results
4.1. Percent of annual wet snow duration
The percent of annual wet snow duration derived from the integrated AMSR FT and MODIS SCE records is shown in figure 1. The estimated mean wet snow duration was approximately 17.9 ± 10.4 (spatial-SD) days yr−1 and represented approximately 11.9 ± 6.5 (spatial-SD) percent of the annual snow-cover season, where the spatial-SD (standard deviation) provides a measure of heterogeneity in snow cover conditions over the entire study domain. The mean wet snow duration represented 7.9 ± 3.7 percent (17.7 ± 8.1 days) and 13.6 ± 6.4 percent (19.5 ± 10.5 days) of the annual snow covered season over the respective tundra and boreal forest biomes. Areas with a shorter wet snow period are mainly distributed at higher latitudes characterized by colder climate conditions and persistent snow-cover. Cold and dry winter conditions are more predominant in subarctic and arctic climate zones characterized by a relatively shallow snowpack and much shorter wet snow duration, which accounts for the observed differences between arctic tundra and boreal biomes. The longest wet snow period occurs in the southern portion of the domain where transient snow-cover with frequent thawing and freezing is common.

Figure 1. Percent of annual wet snow duration derived from the combined MODIS SCE and AMSR FT records over the ABoVE domain for 2016. Inset map (right) denotes Arctic tundra (black) and boreal forest (grey) biomes. The adjacent bar graph shows the annual mean ± SD wet snow duration for tundra and boreal forest areas.
Download figure:
Standard image High-resolution imageThe mean wet snow duration during the spring transition ranged from 11.2 ± 5.8 days in tundra to 12.3 ± 8.4 days in boreal regions (figure S2). The wet snow period was shorter during the autumn transition, and ranged from 6.4 ± 5.4 days (tundra) to 4.8 ± 4.9 days (boreal). In the spring, the solar zenith angle is greater, surface temperatures are generally warmer and the snowpack is deeper, which promotes a longer wet snow duration. In contrast, seasonal temperature trends are cooling and the snowpack is relatively shallow, which results in a shorter wet snow period in the autumn.
The FT record derived from 36.5 GHz Tb retrievals is sensitive to variations in the amount of liquid water within the surface snow layer (Tedesco 2007, Kim et al 2017b). The FT derived frozen and associated dry snow conditions indicate a relatively low portion of liquid water within the surface snowpack, whereas transitional FT and wet snow conditions indicate much greater presence of liquid water within the snow layer. The transitional FT condition also indicates wet snow conditions under daytime solar radiation loading, with a return to predominantly frozen conditions at night consistent with radiative cooling and colder air temperatures that result in re-freezing of liquid water within the surface snow layer.
4.2. In-situ measurements
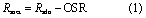
Daily Tavg and RH observations from in-situ weather stations within the ABR were used as an indicator of seasonal snowmelt. The Tavg observations were generally below 0.0 °C under satellite derived dry snow conditions in the spring (figure 2) and autumn (figure 3). The satellite observed wet snow conditions coincided with warmer Tavg levels closer to the 0.0 °C FT threshold for both tundra and boreal biomes (figure 2(a)), indicating suitable conditions for snowmelt in the spring. These results are consistent with the thermal buffering and heat sink characteristics of the snowpack, which constrain surface temperatures near 0.0 °C under melting conditions (Euskirchen et al 2006, Stiegler et al 2016). However, the Tavg observations were generally cooler than 0.0 °C under autumn wet snow conditions even though the WMO station daily maximum air temperatures were at the 0.0 °C FT threshold, while minimum daily temperatures were much colder; these results suggest that the transfer of latent energy and a positive ground heat flux to the snowpack from relatively warm and moist soils may contribute to wet snow conditions in the autumn (Zhang 2005).
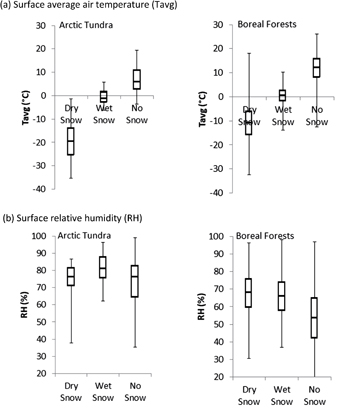
Figure 2. The distribution of concurrent in-situ average surface air temperature (Tavg) and RH observations from regional weather stations during satellite derived dry snow, wet snow and snow-free conditions over the spring transition (March–June) for arctic tundra and boreal forest biomes within the ABoVE domain for 2015–2016. The box plot represents the upper (75th percentile), median (middle line) and lower (25th percentile) quartiles. The vertical lines denote minimum and maximum values.
Download figure:
Standard image High-resolution image
Figure 3. The distribution of concurrent in-situ Tavg and RH observations from regional weather stations for satellite derived dry snow, wet snow and snow-free conditions during the autumn transition (August–November) for arctic tundra and boreal forest biomes within the ABoVE domain for 2015–2016. The box plot represents the upper (75th percentile), median (middle line) and lower (25th percentile) quartiles, while the vertical lines denote minimum and maximum values.
Download figure:
Standard image High-resolution imageThe surface humidity observations showed different seasonal patterns between the arctic and boreal biomes in relation to surface snow-cover conditions. RH ranged between maximum and minimum levels in the spring and autumn transition periods for tundra under respective wet and dry snow conditions indicated from the satellite record. The RH over wet snow was approximately 6% greater than humidity levels during colder dry snow conditions due to higher solar radiation and evaporation rates during spring thawing, and 11% lower for warmer snow-free conditions during the spring transition over tundra (figure 2(b)). In contrast, the spring RH variability over boreal forests decreased from dry snow (67.3%) to wet snow (65.3%) and snow-free (52.4%) conditions. The RH decline during snowpack depletion is consistent with warming temperatures and increased sensible energy loading over boreal forests characterized by a low surface albedo and strong vegetation canopy constraints on evapotranspiration, which results in a deepening planetary boundary layer and increasing volume of dry air (Barr and Betts 1997). During the autumn transition, the RH over boreal forests increased from snow-free to wet and dry snow conditions coincident with cooling temperatures; the autumn RH transition was more stable over the tundra biome (figure 3(b)), which was attributed to characteristically cooler and wetter autumn conditions in tundra relative to boreal forest (Du et al 2016).
4.2. Seasonal pattern of satellite observations
The AMSR record shows two seasonal peaks in the extent of transitional FT conditions, coinciding with the spring depletion and autumn onset of seasonal snow cover indicated from the MODIS SCE record (figure 4). Transitional FT conditions affected up to approximately 63.3 and 59.1 percent of snow covered (SCE) areas in the respective arctic and boreal domains in the spring, and a smaller 34.9 to 53.0 percent of SCE areas in these biomes in the autumn. The estimated annual snow-free season ranged from 147 days to 217 days for the respective arctic and boreal domains from 2015–2016. The BSA and SCE observations remain near annual maximum levels prior to the major AMSR FT transition in spring and then undergo rapid declines under increasing transitional FT conditions, indicating active snowmelt. The decrease in BSA and SCE induces greater absorption of incoming solar radiation, which intensifies surface thawing and snowmelt. The MODIS BSA and SCE observations generally attain annual minimum levels in accordance with the reduction in AMSR transitional FT affected areas following spring snow-cover depletion. These results indicate that SCE has a dominant impact on the BSA seasonal cycle in both tundra and boreal biomes, with both variables strongly related to the extent of transitional FT areas indicating wet snow conditions. In the autumn, both SCE and BSA increase with the initial onset of transitional FT conditions, and then become less sensitive to these conditions as the transitional areas decline under colder temperatures later in the season. After the major autumn FT transition, the SCE and BSA levels remain high commensurate with more persistent snow cover conditions. However, the MODIS SCE and BSA data availability varies seasonally and spatially over the study domain, with a greater amount of missing data during the shoulder seasons due to reduced solar illumination and persistent cloud contamination effects (Helfrich et al 2007, Sun et al 2017). The respective mean percentage of missing data in the MODIS SCE and BSA records is 36 and 26 percent for the spring, and 48 and 50 percent for the autumn, which may contribute greater uncertainty in assessing the SCE and BSA response to FT transitions.
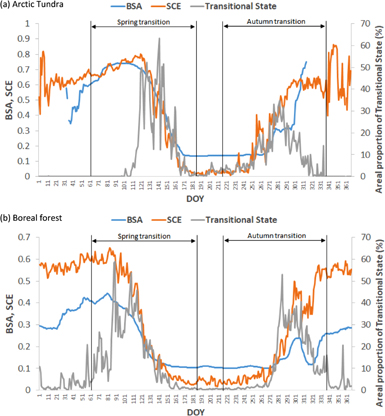
Figure 4. Seasonal variations in the areal proportion (%) of AMSR FT transitional conditions over corresponding MODIS derived SCE. The seasonal progression in spatial mean BSA and SCE from the MODIS record is also shown for the same snow covered area in 2016 for arctic tundra (a) and boreal forest (b) biomes within the ABoVE domain.
Download figure:
Standard image High-resolution imageThe integrated satellite record indicates that the BSA decreases from dry snow to wet snow and snow-free conditions during the spring transition over the tundra and boreal biomes, while this trend is reversed during the autumn transition (figure 5). The lower BSA over boreal forests is consistent with greater evergreen coniferous forest canopy cover, which has a relatively low albedo and may obscure surface snow cover. The BSA difference between snow covered (dry snow) and snow-free (no snow) conditions is generally larger (79%) than between dry and wet snow conditions (25%). However, the lower albedo for wet snow conditions indicates significant additional inputs of net solar energy to the snowpack relative to dry snow conditions. These additional energy inputs are expected to be greater in spring due to more solar radiant energy loading relative to autumn in the ABR. The additional energy loading under wet snow conditions is also expected to further enhance regional snowmelt.
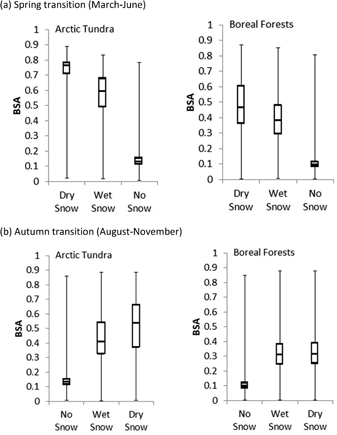
Figure 5. The mean spatial distribution of MODIS albedo (BSA) for wet snow, dry snow and snow-free conditions derived from the combined AMSR FT and MODIS SCE records during (a) spring (March–June) and (b) autumn (August–November) transition periods for arctic tundra and boreal forest biomes within the ABoVE domain for 2015–2016. The box plot represents the upper (75th percentile), median (middle line) and lower (25th percentile) quartiles, while vertical lines denote minimum and maximum values.
Download figure:
Standard image High-resolution image4.3. Surface radiation budgets
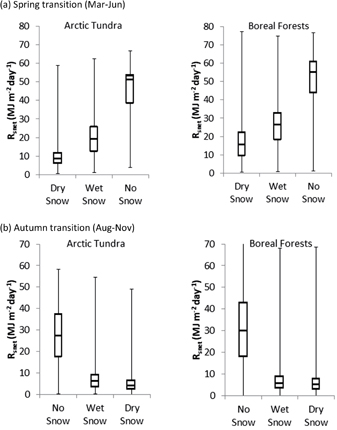
Seasonal progressions in mean daily Rsnet during the spring and autumn transitions for the two major biomes and three general snow conditions is presented in figure 6. The onset of wet snow conditions and snowmelt in spring coincides with a marked increase in net solar radiation (Rsnet) and an associated decrease in surface albedo (BSA) indicated from the AVHRR and MODIS records. The Rsnet (BSA) levels are generally at a minimum (maximum) level under dry snow conditions prior to snowmelt onset. The arrival of wet snow conditions coincides with a relatively abrupt increase in Rsnet driven by a corresponding BSA decline. During spring wet snow conditions, Rsnet generally shows an intermediate energy state between dry snow and snow-free conditions. The largest increase in Rsnet occurs between dry snow and snow-free conditions in the spring driven by a large decline in surface albedo, and with a generally larger Rsnet increase for tundra than boreal forest (figure 6). The rate of Rsnet increase indicated from the seasonal trend is 0.24 MJ m−2 d−1 (tundra) and 0.04 MJ m−2 d−1 (boreal) during the spring wet snow condition.
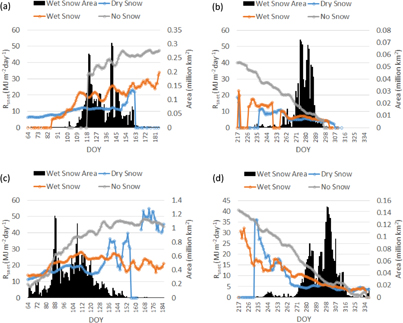
Figure 6. Seasonal progressions in mean daily net shortwave radiation (Rsnet) for dry snow, wet snow, and snow-free conditions for 2016; plots show spatial mean daily progressions in spring (March–June) and autumn (August–November) within the ABoVE domain for: (a) tundra spring, (b) tundra autumn, (c) boreal spring, and (d) boreal autumn conditions. The seasonal progression in the spatial average Rsnet for the different biomes and periods is presented. Snow conditions were derived from the combined AMSR FT and MODIS SCE records, while Rsnet was derived from the AVHRR and MODIS BSA records. A seven day average moving window was used to derive the Rsnet seasonal progression.
Download figure:
Standard image High-resolution imageThe spring and autumn BSA and Rsnet conditions for the 2015–2016 period are summarized in table S2 and figure 7. The Rsnet levels are approximately 26 percent greater over boreal forest than tundra for all snow conditions due to the more southerly latitude of this biome and the lower characteristic forest albedo (figure 7). While surface albedo and net radiation show the largest differences between dry snow and snow-free conditions, BSA and Rsnet are shifted by 25% and 74% from dry snow to wet snow conditions in spring; the resulting Rsnet enhancement ranges from 9–10 MJ m−2 d−1 for the respective boreal and tundra biomes and reinforces the energy available for snowmelt, which can extend for up to several weeks during snowpack depletion.
Figure 7. Distribution of AVHRR and MODIS BSA derived Rsnet for wet snow, dry snow and snow-free conditions defined from the combined AMSR FT and MODIS SCE records during (a) spring (March–June) and (b) autumn (August–November) transitions for arctic tundra and boreal forest biomes within the ABoVE domain for 2015–2016. The box plot represents the upper (75th percentile), median (middle line) and lower (25th percentile) quartiles, while the vertical lines denote minimum and maximum values.
Download figure:
Standard image High-resolution image
The Rsnet levels were approximately 50% lower in the autumn relative to spring for all snow conditions and both biomes. The lower Rsnet levels occur because the autumn snow-cover transition occurs further from the annual peak in solar radiation loading within the ABR. The autumn Rsnet levels also show a general declining trend from the summer season, with maximum, intermediate and minimum net radiation levels for respective snow-free, wet snow and dry snow conditions progressing into the winter season, and driven by a corresponding increase in surface albedo.
5. Discussion and conclusion
The combined satellite record from this study provides new information on the pattern and seasonality of wet snow conditions, and their effect on the surface energy budget within the ABR. The satellite observations show the longest wet snow duration in the southern portion of the domain, and a shorter wet snow period at higher latitudes. The ability of the AMSR record to distinguish snow characteristics at higher elevations and along the southern Alaska coastline is constrained by ocean contamination of the Tb retrievals in coastal areas and the relatively coarse sensor footprint, and larger AMSR FT uncertainty in areas with complex terrain.
The wet snow conditions indicated from the AMSR FT record are sensitive to mid-day thawing and nighttime refreezing of the surface snow layer observed in early and late season snow-cover. Our results indicate that these transient conditions can extend up to several weeks while snow-cover is present and surface air temperatures are near the 0.0 °C FT threshold. The process of thawing and refreezing of the surface snow layer exacerbates sintering, resulting in larger grain sizes and increased snow surface roughness, which, in turn, reduces surface albedo (Colbeck et al 1982, Dozier et al 1981, Warren and Wiscombe 1980). Our results show an associated albedo (MODIS BSA) decline from dry snow to wet snow conditions of approximately 19–20 percent for boreal and tundra biomes. The lower albedo enhances the Rsnet load at the snow surface by approximately 9 to 10 MJ m−2 d−1, which can intensify snowmelt, runoff, and surface warming (Euskirchen et al 2006). The relative impact of these changes on the surface energy budget is larger in spring than the autumn due to greater solar irradiance in spring, despite similar dry-wet snow BSA differences for both seasons. The BSA decline between dry snow and wet snow conditions, and the increase in incoming solar shortwave radiation in the spring contribute to an approximate 74% Rsnet enhancement. While this energy increase is less than the difference between dry snow and snow-free conditions, the additional 9–10 MJ m−2 d−1 Rsnet loading can extend over several weeks in the spring. These additional energy inputs enhance snowmelt and the new release of liquid water in the landscape, while the associated increase in plant-available moisture and available energy for photosynthesis are a precursor to the onset of the growing season and the seasonal increase in evapotranspiration and terrestrial carbon (CO2) sink activity in the ABR (Zhang et al 2011, Yi et al 2014). To our knowledge, this study is the first to delineate these patterns over a regional domain. Our results contribute to further understanding of snow albedo feedbacks to earth's energy budget, the process of Arctic amplification and the representation of surface albedo in global earth system models.
The wet snow duration derived from the integrated satellite record documents the regional pattern and temporal dynamics of snowmelt activity within the ABR, while providing new opportunities for estimating snowmelt (Homan et al 2011). The AMSR FT primary spring thaw onset pattern is similar in timing and pattern to the MODIS BSA record, indicating that land surface thawing is a dominant factor affecting seasonal shifts in land surface albedo over the domain (figure S3). Our results indicate that the primary spring onset (BSA decrease) and thaw date coincide with the rapid depletion of seasonal snow cover, and the snowmelt-driven spring flood pulse in arctic and boreal regions (Rawlins et al 2005). These findings imply that warmer springs may promote more rapid and extensive thawing and snowmelt, increasing the risk of flooding over seasonally snow-covered landscapes when water drainage is impeded by frozen soil.
The AMSR FT and MODIS BSA and SCE records show generally favorable accuracy and performance during the snow cover season (Wang et al 2014, Kim et al 2017a). However, effective satellite monitoring of the ABR from optical-IR sensors are constrained by persistent cloud cover and reduced light levels during the shoulder seasons (Helfrich et al 2007, Sun et al 2017), while satellite microwave FT signals may be degraded by surface water inundation from snowmelt (Kim et al 2017a). The FT sensitivity of microwave sensors may also be influenced by sensor view geometry and the frequency and polarization of the Tb retrievals, atmospheric conditions, and other factors influencing landscape dielectric properties including soil moisture, snow cover and vegetation conditions. The microwave emission and sensing depth is frequency dependent and generally shallow for wet surface conditions due to the low emissivity and high attenuation of liquid water (Ulaby and Long 2014). While up and down-welling short and longwave-radiation are primary forcings on spring snowmelt, a detailed energy balance was not included in this study (Betts et al 2014, Ellis and Pomeroy 2007). Further research is needed to quantify the effects of these additional energy components on FT transitions and snowpack melt, particularly for cloudy days. Our results may also be influenced by SCE retrieval uncertainties (Mudryk et al 2015), which are summarized in the supplement (text S3) for the MODIS SCE (v006) record used in this study.
Surface air temperature and RH measurements from in situ weather stations were used to represent variations in seasonal climate for the different snow conditions in this study even though the AMSR FT retrieval is more directly sensitive to land surface dielectric changes due to FT related shifts in liquid water abundance (Du et al 2017). Alternatively, surface 'skin' temperatures from the MODIS (MYD11A1) land surface temperature (LST) record were analyzed for the same domain, period and snow (SCE) conditions (figure S4); the LST retrievals are a closer proxy of the energy state within the surface snow layer represented by the AMSR FT retrieval, while the LST results were consistent with the in situ air temperature assessment.
The recently launched NASA SMAP (Soil Moisture Active Passive) microwave radiometer satellite provides low frequency (L-band) Tb retrievals designed for soil FT detection (Derksen et al 2017, Dunbar et al 2016), and may be sensitive to wet snow conditions over a deeper snow layer relative to the higher frequency AMSR FT record used in this study. Finer scale FT retrievals from planned satellite radars (e.g. NISAR) may also provide new capabilities for delineating FT and wet snow heterogeneity over complex vegetation and terrain. These potential advances offer capabilities for new investigations and regional monitoring of the seasonal energy budget, the water and carbon cycles, and linkages to the climate system in landscapes with seasonal snow-cover.
Acknowledgments
This work was conducted at the University of Montana under contract to NASA (NNX14AB20A, NNX15AT74A, NNX14AI50G). The MODIS albedo (MCD43) efforts are supported by NASA grant NNX14AI73G.