


Abstract
Beyond emissions from coal-fired power generation, urban sources of mercury (Hg) to the atmosphere, especially minor fugitive sources, are relatively poorly characterized. To identify urban sources of fugitive Hg emissions, passive air samplers (PASs) were deployed for periods of 4–6 weeks in the summer of 2016 at 145 sites across the Greater Toronto Area (GTA). PASs were also deployed along transects of increasing distance from five sites listed as Hg sources in the National Pollution Release Inventory (NPRI) within or near the GTA. Mean gaseous Hg concentrations in downtown Toronto (1.77 ± 0.28 ng m−3) are slightly, but significantly elevated relative to other parts of the GTA (1.42 ± 0.20 ng m−3). Similarly, concentrations at sites close to waste/recycling (1.61 ± 0.22 ng m−3) and hospitals/dental facilities (1.63 ± 0.21 ng m−3) are significantly higher than at sites presumably distant from potential sources (1.37 ± 0.20 ng m−3). Gaseous Hg concentrations are elevated near four of five NPRI source sites, but not near a wastewater treatment plant. Measured or predicted concentrations (using extrapolated transect relationships) close to known Hg sources do not correlate with reported NPRI emissions. For example, the Hg disposal company Aevitas Inc. has the lowest reported NPRI emissions (0.11 kg yr−1) among the five sources, but measured (12.3 ng m−3) and predicted (60.0 ng m−3) concentrations outside the facility are the highest. The PAS's ability to precisely and accurately discriminate small differences in gaseous Hg concentration (<0.2 ng m−3) at and near global background concentrations enables the mapping of the spatial concentration variability and the identification of fugitive Hg emission sources.
Export citation and abstract BibTeX RIS

Original content from this work may be used under the terms of the Creative Commons Attribution 3.0 licence.
Any further distribution of this work must maintain attribution to the author(s) and the title of the work, journal citation and DOI.
Introduction
Urban centres are important sources of mercury (Hg) to the atmosphere (Pacyna et al 2010, Wilson et al 2006), most often due to local fossil fuel combustion, metal manufacturing, cement production, medical and industrial waste discharges, cremations, and caustic soda production (Pirrone et al 2010, Selin 2009, Streets et al 2011). Additional non-point sources of Hg to the atmosphere may be important in overall urban Hg budgets, but are difficult to quantify. For example, approximately one-third of atmospheric Hg observed in Milwaukee has been attributed to non-point sources: a mixture of Hg transported into the city and small or unknown sources (Rutter et al 2008). In Beijing, Hg concentrations in the atmosphere and dust have been attributed to non-point sources including historical land use and transport from sources outside of the urban area (Chen et al 2010, Xinmin et al 2006). Diffuse vehicular emissions may also contribute to emissions of Hg (Lynam and Keeler 2006). The recently ratified Minamata Convention on Hg stipulates that complete emissions inventories should be established and monitoring networks improved (UNEP 2013). Methods to enable improved characterization and mapping of fugitive emissions from unknown point and non-point sources in urban areas are needed to improve emissions inventories.
Traditionally, atmospheric Hg monitoring in urban areas has been conducted with active measurement instruments in long-term deployments at a limited number of sites (e.g. Lynam and Keeler 2006, Rutter et al 2008, 2009, Brown et al 2015). Studies such as these are effective in relaying both short-term and long-term (if sampling sites exist over multiple years) information on the variability of atmospheric Hg concentrations. This information is particularly pertinent in cities with relatively high and temporally variable concentrations, such as in East Asia, where industrial sources, coal-fired power plants, and residential coal-burning heaters result in elevated emissions in or near urban centres (Streets et al 2005, Fu et al 2011). However, the expense of active measurement instruments generally leads to insufficient spatial resolution for distinguishing specific sources. Mobile sampling with a single active measurement instrument has been conducted in urban areas for mapping spatial patterns (e.g. Yang et al 2008, Cairns et al 2011), but this does not easily allow for the attribution of concentration variability singularly to spatial or temporal factors. Alternatively, passive air samplers (PAS) produce time-averaged concentration data over longer deployment periods (McLagan et al 2016a). They are low cost, easy to use and do not require energy or compressed gases, allowing them to be deployed concurrently in high numbers. They are therefore particularly well-suited for mapping gaseous Hg concentrations to assess spatial variability.
Here we show, using the Greater Toronto Area (GTA) as a case study, how a network of passive air samplers deployed simultaneously across an urban area can be used to identify and locate unknown Hg sources and to assess the contribution that known or suspected Hg sources are making to urban emissions. Previous monitoring studies have evaluated gaseous Hg concentrations in the GTA using both long term monitoring at a single downtown site (St. Denis et al 2006, Song et al 2009) and multiple sites over differing time periods (Cairns et al 2011). This study represents the first concurrent, spatially resolved assessment of gaseous Hg concentrations not only across the GTA, but indeed in any urban area.
Methods
Sampler design
We used the PAS for gaseous Hg described in (McLagan et al 2016b), which possesses the necessary accuracy and precision for background concentration sampling (McLagan et al 2018). It incorporates a sulphur-impregnated activated carbon sorbent (HGR-AC; Calgon Carbon Corporation), a commercially available, white Radiello® diffusive housing (Sigma Aldrich), and a polyethylene terephthalate protective shield.
The sampled analyte is referred to as 'gaseous Hg' as it has not been established whether the PAS takes up total gaseous Hg (TGM) or solely gaseous elemental Hg (GEM). GEM is the predominant form in the atmosphere, typically making up >95% of TGM (Driscoll et al 2013, Cole et al 2014, Slemr et al 2015). The atmospheric lifetimes of the other atmospheric forms of Hg, gaseous oxidized Hg (GOM) and particulate bound Hg (PBM) are shorter (days to weeks) due to greater atmospheric reactivity and deposition (Ariya et al 2015, Shah et al 2016, Horowitz et al 2017). Considering that TGM is typically dominated by GEM, we assume that the use of the term 'gaseous Hg' and our assumption of its dominance by GEM should contribute little to the overall uncertainty.
Sampling design
The study had two components aimed, respectively, at (i) identification of unknown Hg emissions within the GTA and (ii) evaluation of emissions from facilities within the GTA that report Hg emissions to the National Pollution Release Inventory (NPRI). The GTA, covering an area of 7124 km2, is made up of Toronto, the fourth most populated city in North America, and the four regional municipalities of Halton, Peel, York, and Durham. In 2016, Toronto and the GTA were home to 2.732 million and 5.928 million people, respectively (Statistics Canada 2017). The province of Ontario no longer has any active coal-fired electricity generation (Ronsenbloom et al 2016). The first component of this study involved deployment of 145 samplers across the GTA (102 in Toronto, 16 in Peel, 22 in York, and five in Durham) in July and August 2016 for time periods ranging from 34–46 days (figure 1). 58 samplers were deployed at homes by faculty, staff, and students of the University of Toronto Scarborough participating in a 'community science network', reducing the cost associated with deployment. At all other sites, samplers were deployed by attaching a PAS to an available structure (e.g. utility pole, tree). Most deployment heights ranged between 1 and 5 m above ground level, with a few exceptions that were deployed at homes of the community science network in taller buildings (see supplementary information table S1.1 available at stacks.iop.org/ERL/13/074008/mmedia). Data for each PAS deployment are given in table S1.1.
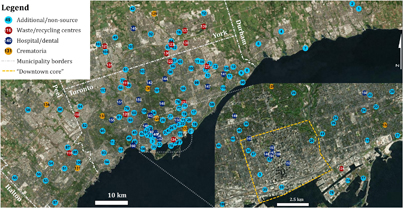
Figure 1. Sampling sites in the Greater Toronto Area. Inset shows central Toronto sampling sites. Orange bounded area of inset delineates the 'downtown core'—bounded north-south: Bloor St to Lake Ontario, and east-west: Bathurst St to Don River.
Download figure:
Standard image High-resolution image43 of the 145 samplers were placed in the vicinity of potential Hg sources, which were grouped into three categories: (i) waste/recycling centres accepting Hg containing products for disposal (n = 16), (ii) crematoria, which are suspected sources from the incineration of dental amalgams (n = 7) (Pirrone et al 2010), and (iii) hospital/dental facilities potentially emitting Hg during incineration of medical waste and in the manufacture and use of dental amalgams (n = 20) (Pirrone et al 2010). The remaining 102 'additional/ non-source' sites were not associated with any identifiable or suspected sources of Hg.
The second component of the study involved deployment of samplers in the vicinity of facilities within 100 km of downtown Toronto that report atmospheric Hg emissions in the NPRI (figure 2) (ECCC 2017a). Samplers were deployed for between 29 and 30 days in July and August of 2016 or 2017. The facilities are (from west to east) (i) Aevitas Inc., Ayr, Ontario (major disposal site for Hg containing products and only approved Hg retort in Canada (Aevitas Inc. 2017); sample prefix: AEV), (ii) ArcelorMittal Dofasco G.P., Hamilton, Ontario (steel production plant; sample prefix: AMD), (iii) Cement Roadstone Holdings (CRH) Canada Group Inc., Mississauga, Ontario (cement production plant; sample prefix: CRH), (iv) Duffin Creek Water Pollution Control Plant (waste water treatment plant; sample prefix: DCW), Pickering, Ontario, and (v) Gerdau Ameristeel Corp., Whitby, Ontario (steel production plant; sample prefix: GAS) (figure 2). Four to six samplers were deployed at approximately 3.5 m above ground level along a transect of increasing distance from each source location. Sampling sites are coded using the prefix of each source location, with site '1' of the transect being the closest to the presumed source buildings. Data from source transect samples are given in table S1.2. The sampling sites at ArcelorMittal Dofasco G.P. in Hamilton could not easily be ranked in terms of distance from source, as (i) the location of the Hg source(s) is not known because the company has multiple buildings spread across the Hamilton Harbour area and (ii) other facilities nearby may also emit Hg. US Steel Canada Inc., listed on NPRI as emitting 9 kg of Hg per year to the atmosphere, is 2 km from site AMD1 and AMD2 is adjacent to Ruetgers Canada Inc. which produces coal tar, but is not listed in the NPRI. Given ArcelorMittal Dofasco has a number of buildings in the Hamilton Harbour area, the distances from source for sites AMD1 and AMD2 use different potential source buildings associated with the company. The distance from source for the remaining AMD transect sites are from the building adjacent to site AMD1, which is suspected to be the main source building due to its larger size. We attempted to align source transects closely with predominant wind directions. Nonetheless, this was not always possible due to the presence of Lake Ontario, major highways, private property, or irregular winds during the sampling periods. Wind roses for the weather stations used for each source location (listed below) are provided in figure S4.1.
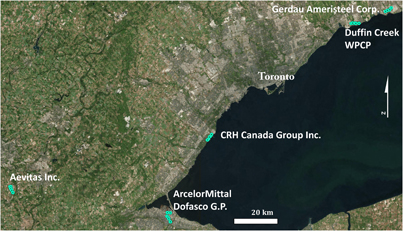
Figure 2. Site transects at NPRI listed atmospheric mercury sources.
Download figure:
Standard image High-resolution imageAnalysis
Total Hg in the HGR-AC sorbent was quantified using an Automated Mercury Analyzer (AMA254, Leco Instruments) according to USEPA method 7473 (USEPA 2007). Full details of the method for analyzing this particular sorbent can be found elsewhere (McLagan et al 2017a, 2017b, 2018). All samples were adjusted for field blank concentrations, which overall were low at 0.4 ± 0.2 ng.g−1 (mean ± standard deviation; n = 18, corresponding to less than 5% of the average amount in exposed samplers). Precision, determined by sampler duplication at 11 sites, was 2 ± 2% (mean ± standard deviation). Analytical accuracy and precision were within accepted ranges (see section S2 for details).
Gaseous Hg concentration calculation and interpolation
The gaseous Hg concentration (C; ng m−3) was calculated by dividing the quantified mass of sorbed Hg (m, ng) by the product of deployment time (t, day) and sampling rate (SR, m3 day−1). The SR of 0.135 m3 day−1 (McLagan et al 2018) was adjusted for temperature and wind speed (McLagan et al 2017b, 2018). The average temperature and wind speed measured at Toronto International Airport during July and August 2016 (24.0 ± 2.6 °C, 4.3 ± 1.4 m s−1) were used for all of the sites in component 1. For the sites in component 2, temperature and wind speed data were retrieved from weather stations at Region of Waterloo Int'l Airport (for Aevitas Inc.), Burlington Lift Bridge (for ArcelorMittal Dofasco G.P and CRH Canada Group Inc.) and Oshawa Executive Airport (for Duffin Creek Water Pollution Control Plant and Gerdau Ameristeel Corp.). Exact wind speeds, temperatures, and adjusted SRs of each deployment in components 1 and 2 are given in tables S1.1 and S1.2, respectively (ECCC 2017b).
Spatial patterns of gaseous Hg concentrations were interpolated and mapped using empirical Bayesian kriging to derive the experimental variogram model (ArcGIS 10.3, Esri Ltd.). Full details of the variogram model parameters are given in supplementary information section S3. The horizontal x and y dimensions of the concentration maps are constrained by a polygon surrounding the sampling sites in order to minimize the extrapolation of predictions outside the spatial range of the sampling sites.
All statistical analyses were performed by hand or using R v3.3.2 (R Foundation for Statistical Computing). Non-source and potential source groups in the GTA were compared by ANOVA with Tukey's Honestly Significant Differences post-hoc test at α = 0.05. Differences between downtown and other sites used a T-test.

Figure 3. Measured and predicted gaseous Hg concentrations (ng m−3) averaged over a period of 4–6 weeks in July/August 2016 in the Greater Toronto Area. Prediction contours are derived from an empirical Bayesian kriging model.
Download figure:
Standard image High-resolution imageResults and discussion
Gaseous mercury concentrations across the GTA
Summertime gaseous Hg concentrations averaged over a period of 4–6 weeks are low (mean concentration: 1.46 ± 0.23 ng m−3) and overall, close to the mean North American background concentration that has declined to approximately 1.2–1.3 ng m−3 in 2015 (Zhang et al 2016) (figure 3). While the range in concentrations is relatively low (1.43 ng m−3), the distribution of gaseous Hg was not uniform across the GTA. Low concentrations observed in eastern Toronto, Durham, western Peel, and northern and eastern York may be influenced by cleaner air arriving from rural areas north of the city or from Lake Ontario. Accordingly, the lowest measured concentrations of 0.94 and 0.95 ng m−3 occurred near the edges of the GTA urban area in the north-eastern part of the City of Toronto (site 12) and the eastern part of York Municipality (site 14), respectively. Concentrations were highest in downtown Toronto, which is very densely populated and home to six major hospitals. The mean concentration of 1.77 ± 0.28 in the downtown core (comprising sites 3, 29, 33, 35, 37, 38, 52, 140, 146, 152–154, 157, and 158) was significantly higher (p < 0.001) than the average of concentrations elsewhere within the GTA (1.42 ± 0.20 ng m−3). The maximum measured concentration in the downtown core and indeed at any of the GTA sampling sites was 2.37 ng m−3 (site 35; figure 3, table S1.1). Concentrations were also slightly elevated to the west of the downtown core (West Toronto and Mississauga). This trend generally reflects the higher proportion of industrial zoning along the border of the City of Toronto and Peel Municipality (see City of Toronto and Peel municipality land use maps in section S5; City of Toronto 2017, Region of Peel 2017).
Concentrations at both waste/recycling centres (mean = 1.61 ± 0.22 ng m−3; p = 0.001) and hospital/dental facilities (mean = 1.63 ± 0.21 ng m−3; p = 0.001) were significantly elevated relative to the additional/non-source sites (mean = 1.37 ± 0.20 ng m−3). Concentrations near crematoria were slightly higher as well, but not significantly so (mean = 1.58 ± 0.18 ng m−3; p = 0.105), which is in part a result of the small number of sites (n = 7). These results suggest that waste and recycling centres and hospital/dental facilities are minor fugitive emission sources of gaseous Hg.
Site 96 was approximately 200 m south-east of the Highland Creek Waste Water Treatment Plant, which is listed on the NPRI as emitting 2.8 kg of Hg per year in 2016 (ECCC 2017b). The concentration at this site (1.13 ng m−3) was at or below that of adjacent sampling locations (1.15–1.29 ng m−3 at sites 8, 9, and 11), suggesting that this treatment plant emits negligible amounts of Hg. Site 114 was approximately 100 m south of the former Hearn Generating Station, a power plant that generated electricity from coal until 1971 and from oil until 1983 (Stinson 1996, Dulmage et al 2014). Its concentration (1.81 ng m−3) was slightly higher than that at two adjacent sites (site 77: 1.43 and site 78: 1.27 ng m−3), possibly indicating small amounts of legacy Hg remaining on the site of the power station.
Sampling sites at higher elevation (greater than 5 m above ground level) were not distinct from adjacent sampling sites (see table S1.1). All sampling heights were well within the atmospheric boundary layer, where gaseous Hg concentrations are expected to remain relatively uniform away from point sources (Bieser et al 2017).

Figure 4. Gaseous Hg concentrations across NPRI source transects at varying distance from source buildings. The predicted gaseous Hg concentrations (C; ng m−3) at 1 m distance (d; m) from the source structure are given by the scaling factor of power relationships for each location. AEV—Aevitas; AMD—ArcelorMittal Dofasco; CRH—Cement Roadstone Holdings; DCW—Duffin Creek Water Pollution Control Plant; GAS—Gerdau Ameristeel.
Download figure:
Standard image High-resolution image
Gaseous Hg (reported as GEM) previously has been measured in the Toronto atmosphere using active sampling instruments (St. Denis et al 2006, Song et al 2009, Cairns et al 2011). Cairns et al (2011) took 2147 five-minute measurements using a Tekran 2537A active instrument across the GTA from a moving vehicle in July 2009 and found a mean gaseous Hg concentration of 1.89 ± 0.62 ng m−3. These measurements were not taken concurrently, as they are in our study, and hence the variability in concentrations may not only be caused by spatial but also temporal factors. Gaseous Hg concentrations of 2.48 ± 2.22 ng m−3 (June 2001 and February 2002) (St. Denis et al 2006) and 4.5 ± 3.1 ng m−3 (between December 2003 and November 2004) (Song et al 2009) were recorded at Ryerson University in the downtown core of Toronto. The increase in concentration was linked to a shift in sampler inlet location from the side to the top of the building in the later study. The Ryerson University sampling location is approximately 400 m east of site 158 and 650 m north of site 152, which had concentrations of 1.88 and 1.83 ng m−3, respectively. Comparing our set of measurements with the previous studies addressing gaseous Hg in the GTA is slightly complicated because of (i) the single sampling site, spatial differences between this site and our sites, the impact of the inlet location, and possible seasonal differences between our study and (St. Denis et al 2006 and Song et al 2009), and (ii) the non-concurrent measurements in (Cairns et al 2011). Nevertheless, a cautious comparison suggests a slight decline in the gaseous Hg concentration across the GTA over the past decade, which is in line with the general decline in gaseous Hg concentrations across North America (Soerensen et al 2012, Cole et al 2014, Zhang et al 2016). This trend may also be linked to the phase out of coal-fired power generation in Ontario in 2014 (Ronsenbloom et al 2016).
Concentration gradients in the vicinity of NPRI sources
Results from four of the five NPRI source transects indicate elevated gaseous Hg concentrations closer to potential source structures (figure 4). Nonetheless, the measured values at sites closest to source buildings (AEV1 > mean of AMD1 and AMD2 > GAS1 > CRH1 > DCW1) did not reflect NPRI emissions estimates (GAS > AMD > DCW > CRH > AEV) (ECCC 2017a). Due to site access restrictions and variable distances between property boundaries and potential sources, the distances of sampling sites from source buildings varied among locations. For example, Site AEV1 was closer to a suspected source than any other sampling site. To avoid bias in comparing different sources, we estimated a concentration at 1 m distance from each suspected source by extrapolating the fitted power relationships between concentration and distance from source building displayed in figure 4. These extrapolated concentrations (numerical values are the scaling factors in the fitting equations included in figure 4) followed the same trend as the measured concentration (i.e. the highest concentration measured in each transect): AEV > AMD > GAS > CRH > DCW. In other words, even accounting for the close proximity of AEV1 to the Aevitas building, our data indicate this facility is still the largest of the Hg sources sampled in this study. However, we should note that we could not account for the variation in concentration that may have been caused by variable emissions height (i.e. stack vs. ground-based emissions). Moreover, the time-averaged PAS concentrations are representative of only the 4–6 week summer period sampled in the study whereas the NPRI emissions estimates are for an entire year. Differences between wind speed and both wind and transect orientation among sites may also yield additional uncertainty in the predicted 1 m concentrations. For these reasons the comparison between measured concentrations and NPRI emissions estimates should be considered qualitative.
These patterns suggest different levels of Hg emissions from these sources, but emissions are likely much less than from Hg-contaminated brownfields. For example, the weekly averaged concentration at the main source building of a former Hg mine in Italy in July 2016 was 6700 ng m−3 McLagan (2018). Concentrations predicted at 1 m distance from NPRI source sites (figure 4) are 111 (AEV) to 1670 (CRH) times lower than that concentration measured at the Italian Hg mine site. This information helps contextualize the elevated gaseous concentrations observed near the NPRI sites against a much stronger source of Hg.
Both the measured (site AEV1: 12.3 ng m−3) and 1 m predicted (60.0 ng m−3) concentrations at Aevitas Inc. were clearly the highest among the five source locations, approximately four times higher than the next highest measured concentration (site AMD1: 3.74 ng m−3). As previously mentioned, Aevitas Inc. had the lowest reported NPRI emissions (0.11 kg yr−1) of the five source sites34. Active retorting of Hg-containing products, on-site storage of Hg-containing products and the extracted Hg are the likely sources of Hg at this site. Considering the measured and 1 m predicted gaseous Hg concentrations are the highest among source sites, we expect the actual Hg emissions from this site to be well in excess of the relatively small emission estimate reported by NPRI. It may be of value to monitor indoor gaseous Hg concentrations and/or ventilation emissions at this facility.
The next highest measured and 1 m predicted concentrations were at ArcelorMittal Dofasco G.P. in Hamilton (3.74 and 2.23 ng m−3 at sites AMD1 and AMD2, respectively) and at Gerdau Ameristeel Corp. (2.29 ng m−3 at GAS1), which are the two facilities with the highest reported Hg emissions in Ontario according to the NPRI (ECCC 2017b). Global Hg emissions from pig iron and steel production have been estimated at 43 Mg yr−1, ranking it as the eighth largest sector of anthropogenic Hg emissions (Pacyna et al 2006, 2010). Identifying the actual source of Hg emissions within the Hamilton harbour area with a small number of sampling sites is difficult due to the region's history of well over 100 years of steel production and other heavy industry (Gentilcore 1987). Multiple diffuse sources are likely present, including evaporation from soils that have been contaminated with Hg in the past. This is supported by gaseous Hg concentrations at the more distant transect sites that are slightly higher than at the other sources. This suggests slightly elevated background concentrations in this area overall (orange diamond markers in figure 4). An investigation involving a much larger number of passive samplers across the entire Hamilton Harbour Area would be required to demarcate the different sources and possible legacy emissions from contaminated surfaces in the area via high spatial distribution gridded sampling and possibly vertical gradient deployments (McLagan 2018).
Cement production is listed as the fourth largest sector of anthropogenic Hg emissions (Pacyna et al 2006, 2010). Yet, based on only slightly elevated concentrations at the two sites closest to CRH Canada Group Inc. (site CRH1: 1.68 ng m−3; site CRH1: 1.66 ng m−3), and relatively low 1 m predicted concentration (4.02 ng m−3) this cement plant appears to generate only minor gaseous Hg emissions. This may be a result of the use of raw materials low in Hg and/or a large proportion of atmospheric Hg emissions being in the form of GOM or PBM. Hg emitted from cement production plants is predominantly PBM, although variability is high (8.3%–96.9%) (Mlakar et al 2010). Indeed, substantial particle plumes could be seen emanating from the plant during deployment and collection. The Radiello® diffusive body of the PAS has a reported average pore size of 25 ± 5 μm and a wall thickness of 1.7 mm (Baechler et al 2010, Puchalski et al 2011), and hence is not likely to allow the passage of PBM.
The gaseous Hg concentrations along the Duffin Creek Water Pollution Control Plant transect were not elevated, despite an NPRI atmospheric emission estimate of 17 kg yr−1 (ECCC 2017b). Similar to our findings near the Highland Creek Wastewater Treatment Plant, Hg emissions from wastewater treatment plants in the GTA may be overstated. These emissions estimates appear to be based on factors related to volumes of waste treated. The qualitative difference between the measured concentrations and the NPRI emissions estimates suggests these factors may not be broadly applicable, especially in terms of atmospheric emissions. However, more in-depth, high spatial resolution PAS deployments at these sites and detailed emissions modelling from this data are necessary to confirm this hypothesis.
Conclusions
Overall, this study indicated that emissions of Hg in the GTA are low and likely to emanate from a number of minor diffusive sources (waste centres, hospitals/dental facilities). In particular, no major point sources other than those listed in the NPRI were identified. The elevated measured and 1 m predicted gaseous Hg concentrations around facilities reporting atmospheric Hg releases in the NPRI (with the exception of waste water treatment plants), suggests that these sites indeed emit Hg. However, the lack of a relationship between reported emissions and air concentrations measured in the vicinity of those sources indicates the need for follow-up work, in particular at facilities where the air concentration measurements suggest much higher emissions than reported.
This study highlighted that a sampler suitable for identifying, locating and evaluating sources of Hg to the atmosphere through measurements of ambient air concentrations needs to have (i) a limit of detection that allows for the measurement of concentrations close to the global background (<2 ng m−3) and (ii) a precision that is able to discriminate small concentration differences on the order of 0.2 ng m−3 or less. These and previous results (McLagan et al 2018) obtained with the PAS we employed here demonstrate it is clearly capable of doing this. Otherwise, it would not have been possible to establish with statistical significance that gaseous Hg concentrations in downtown Toronto or in the vicinity of waste recycling centres and hospital/dental facilities are slightly elevated above sites in other parts of the GTA. Automated ambient air analyzers that combine gold cartridges with atomic fluorescence spectroscopy can also achieve such limits of detection and precision, but generally not with a similar spatial resolution. Even if they are mounted on a mobile platform (Cairns et al 2011), the resultant maps or gradients are not temporally concurrent. The time averaging feature of the PAS is particularly important when Hg sources are highly time variant or possibly even episodic. An additional advantage of the PAS approach is its low cost and ease of use, as was confirmed via the successful integration of a community science network into this sampling campaign. The use of such networks not only reduces sampling costs, but also indicates a potential to expand the spatial scope of deployments. Furthermore, the low costs, simplicity, and portability of the PAS allow deployments to be easily tailored to suit the needs of the investigators and the specific urban centre of interest.
Acknowledgments
We would like to thank the network of volunteers from the Department of Physical and Environmental Sciences at the University of Toronto Scarborough. We also acknowledge funding from Strategic Project Grant no. 463265-14 by the Natural Sciences and Engineering Research Council of Canada (NSERC) and an NSERC Alexander Graham Bell Canada Graduate Scholarship.