

Abstract
China has emerged as the global manufacturing center for solar photovoltaic (PV) products. Chinese firms have entered all stages of the supply chain, producing most of the installed solar modules around the world. Meanwhile, production costs are at record lows. The decisions that Chinese solar producers make today will influence the path for the solar industry and its role towards de-carbonization of global energy systems in the years to come. However, to date, there have been no assessments of the future costs and efficiency of solar PV systems produced by the Chinese PV industry. We perform an expert elicitation to assess the technological and non-technological factors that led to the success of China's silicon PV industry as well as likely future costs and performance. Experts evaluated key metrics such as efficiency, costs, and commercial viability of 17 silicon and non-silicon solar PV technologies by 2030. Silicon-based technologies will continue to be the mainstream product for large-scale electricity generation application in the near future, with module efficiency reaching as high as 23% and production cost as low as $0.24/W. The levelized cost of electricity for solar will be around $34/MWh, allowing solar PV to be competitive with traditional energy resources like coal. The industry's future developments may be affected by overinvestment, overcapacity, and singular short-term focus.
Export citation and abstract BibTeX RIS

Original content from this work may be used under the terms of the Creative Commons Attribution 3.0 licence.
Any further distribution of this work must maintain attribution to the author(s) and the title of the work, journal citation and DOI.
1. Introduction
Progress in solar photovoltaic (PV) technology has caught many by surprise. From a niche product for small-scale applications, solar PV has become an attractively cheap candidate for countries around the world to reduce greenhouse gas emissions. In the past ten years, global solar installed capacity has grown more than 45 times, from 5.1 GW in 2005 to 229 GW 2015 (Schmela 2015). Currently, solar PV meets about 1.3% of the global electricity demand, a small but rapidly growing percentage (PVPS 2016). Production costs have plummeted at an unprecedented rate to levels that many experts previously deemed unlikely (Curtright et al 2008, Baker et al 2015). Central to these developments stands China, which has emerged in recent years as the global behemoth in terms of both PV production and deployment (Schmela 2015). Of the 50.6GW of solar PV installed in 2015, a third was in China, making it the world's largest solar PV market (Schmela 2015). Chinese firms dominate every stage of the supply chain, from polysilicon to modules. Chinese polysilicon producers provide half of the global polysilicon supply (BNEF 2016a). For every ten PV modules installed in the world, about seven were manufactured by Chinese PV producers (CPIA 2016a).
The competitiveness of the solar industry has been studied from various perspectives. Yu et al (2011) use an input-output model to show that the decline in solar module costs was due to raw material prices (polysilicon, silver), scale effect, and high learning-by-doing rate. Gallagher (2014) attributes the competitive advantage of Chinese firms to global and national climate policies, human capital mobilization—an argument that Luo et al (2013) also make—internal manufacturing optimization, and vertical integration (Zhang and Gallagher 2016). Furthermore, the Chinese PV industry drew crucial support from market formation policies (Grau et al 2012, Gallagher 2014). In a bottom-up engineering economics model, Goodrich et al (2013) show that economy of scale and supply-chain specific factors such as discounts in material and equipment confer a China-based factory cost advantages over a US-based factory.
However, lacking from the literature is an understanding of how the Chinese solar PV industry will evolve in the next few years. Through a series of expert elicitations, this study aims to fill this gap. We begin by assessing specific technological factors and non-technological factors that contributed to the fall of PV production costs in China, and we then seek to determine the current status and future prospects of China's solar PV industry.
Expert elicitation has wide application and enjoys high popularity in the technology assessment community (Baker et al 2015, Verdolini et al 2016). Previous studies have used expert elicitations to quantify future progress of solar PV globally (Baker et al 2009, Bosetti et al 2012, Anadon et al 2011, Inman 2013), though they did not feature China. China will continue to play an important role in the future progress of solar PV, and developments in China will reverberate far beyond its borders. By focusing on China, this study paints a more detailed picture of the solar PV industry's current status as well as its future technological trajectories.
2. Method and data
The overall goals of this expert elicitation study are to: (i) understand the factors that affected the cost of crystalline Silicon PV modules between 2005 and 2015; (ii) to identify the major barriers to the future success of PV; (iii) to assess the state and economic viability of different PV technologies by 2030 under current R&D funding. In order to do so, we developed an expert elicitation survey following the traditional approach established by Carnegie Mellon University over several decades (Morgan et al 1992, Morgan and Keith 1995, Morgan 2014). In the supplemental information (SI) available at stacks.iop.org/ERL/13/034038/mmedia, we provide a general description of the approach as well as alternative methods to estimate future technology costs. A full version of the protocol used for this elicitation is also available in the SI.
The elicitation is organized as follows: the interviewer first introduces the method of expert elicitation and explains the goal of the study to the expert. The interviewer then explains the elicitation procedure as well as biases associated with this type of study and strategies to address them. After that, the expert is asked to rank his or her levels of expertise towards different solar PV technologies. The formal elicitation consists of two parts: an assessment of silicon technologies and another for non-silicon technologies. The emphasis is on silicon-PV technologies, because they make up an overwhelmingly large portion of the global market (Fraunhofer 2016), and Chinese firms predominantly compete in this technology space. The expert is asked to identify technological and non-technological factors that led to the decline of production cost of silicon PV modules from 2005–2015. The expert then assesses technological barriers and potential advances before estimating module efficiency and costs by 20305. He or she is asked to perform the same assessment and estimation tasks for non-silicon technologies. Finally, to check for consistency, the expert is asked to assign probabilities that any technology for each major technological group achieving certain system costs by 2030.
The elicitation includes questions for 17 solar PV technologies. Table 1 lists these technologies. Solar PV module is chosen as the unit of analysis because modules are often sold commercially and installed as electricity-generating units, even though progress at the cell level may attract more attention.
Table 1. 17 technologies featured in study. We provided definitions of each category and technology to experts as needed. They are also available in the protocol in the SI.
| Crystalline Si | Thin film | CPV | Excitonic | Emerging |
|---|---|---|---|---|
| Mono-Si | CdTe | LCPV | DSSC | Hot carrier |
| Mc-Si | CI(G)S | HCPV | Organic, molecule | Multiple electron-hole pair |
| Novel | Amorphous Si | Organic, polymer | Multiband/impurity | |
| Up/down converter | ||||
| Thermophotovoltaic | ||||
| Perovskite |
We use cost as opposed to price to minimize the number of market uncertainty factors such as overcapacity in the supply chain. Furthermore, instead of eliciting directly the levelized cost of electricity (LCOE), which is location- and operation-specific, we compute it using elicited results. This approach allows us to perform sensitivity analysis on key parameters such as balance of system, capacity factors, and discount rate. For simplification, we consider utility-scale solar only.
Previous studies also consider various Research, Development, and Deployment (RD&D) scenarios (Curtright et al 2008, Anadon et al 2011, Bosetti et al 2012, Inman 2013). However, eliciting how increasing or decreasing public RD&D can affect costs and performance of PV technologies decades from now creates an extra dimension of uncertainty and adds an additional set of tasks to an already-long protocol. Thus, we designed less ambitious research questions and focused simply on understanding the performance of solar PV assuming current levels of R&D.
Because the Chinese market is the focus on this study, we elicited costs in local currency (yuan RMB per Watt peak) in current year value. Many experts preferred to express their estimates in US dollars, the currency used by large firms and some industry trade groups. We report both values, assuming an exchange rate of 6.5 yuan RMB to a dollar. We also note the unit for power refers to Watt-DC as is standard within the manufacturing sector.
Overall, we recruited 16 participants from industry, academia, and national laboratories with expert knowledge of solar PV technologies and China's solar industry6. All but three are Chinese nationals. Participation was voluntary and anonymous. Table SI 1 in the SI section summarizes demographic and background information of participating experts. One interview was conducted via Skype call, and two via telephone. The remainder of the interviews were conducted in person. All interviews were conducted in Chinese or English, depending on the expert's preference. (One Chinese expert decided to respond in English.) We interviewed 16 additional subjects in person. These individuals engaged in various parts the PV industry but did not formally participate in the survey due to time constraints or lack of expert knowledge of some aspects of the industry. These discussions were guided by open-ended questions at the end of the protocol7. The entire study was conducted between June and December 2016.
3. Results
3.1. Experts assessments of technological factors for Chinese silicon PV cost decline between 2005 and 2015
Table 2 summarizes technological factors mentioned by the experts that influenced the cost of solar PV. Experts pointed to the sharp decrease of polysilicon price as the single most important factor in reducing the overall costs of PV in the past decade8, as illustrated in figures SI 1 and SI 2. Chinese investors led the effort to ease the global polysilicon shortage that peaked in the late 2000s. In 2016 the global production capacity totaled over 400 000 tons, half of which was owned by Chinese producers (BNEF 2016a). Polysilicon price as of 2016 has fallen to $12-$17 per kilogram (Energy Trend 2016), from $350 per kilogram in 2008.
Table 2. Key technological improvements that influenced the cost of Silicon PV mentioned by our experts.
| Stage | Key factors |
|---|---|
| Polysilicon | Investment and scaling up of production plants; hydrochloronation technology upgrade; increase number of seed rods in furnace; reduction in electricity use; investment in fluidized bed reactor technology |
| Ingot/Wafer | Seed-assisted growth method using crystalline Si and quartz; larger furnace and larger ingots; diamond wire sawing; black Silicon; direct wafer |
| Cell | Improved efficiency; improved silver paste recipe; efficiency use of silver paste; higher number of busbars; high-efficiency cells (PERC/L/T, IBC, HIT) |
| Module | Domestic production and reduction of material use of key components (EVA sheets, glass, backsheets); replacement of TPT backsheets |
| Equipment | Indigenization of equipment for aluminum back surface field; automation; gradual domestication of key equipment for high-efficiency cells |
Chinese producers improved wafer quality by controlling the distribution of grain sizes and bringing down the level of dislocation density through a seed-assisted crystal growth method (Zhu et al 2014). Commercial raw mc-Si seeds placed at the bottom of the crucible act as starting points for the growth of silicon crystal, yielding mc-Si crystals with fewer defects. A standard cell can gain up to 0.5% in efficiency. As much as 60% of the mc-Si ingots were made using this process in 20159, and currently non-Chinese manufacturers are exploring and adopting this technique as well10. Ingot makers also built larger furnaces, thus increasing the proportion of unpolluted ingot blocks.
Wafer makers replaced multi-wire slurry sawing with diamond wire to produce more wafers with smaller thickness at a higher throughput (Watanabe et al 2010). Because diamond wires are thinner than steel wires, there is less kerf loss, or sawdust from slicing. Diamond wire can slice a kilogram of silicon into 60 wafers, compared to steel wire's 51, thus delivering substantially more efficient production. By one estimate, diamond wire sawing can lower module cost by about 2.6 cents/W (Xing 2016).
Improvements in key material inputs such as silver paste allowed manufacturers to further increase cell efficiency. Better silver paste recipes and improved printing methods reduced silver use: a solar cell in 2015 contained 0.10 gram of silver compared to 0.30 gram five years prior (BNEF 2014, ITRPV 2016). At the same time, profiles of cell conductors became taller and more narrow, resulting in lower shading loss and higher overall efficiency11.
Chinese cell makers added more busbars to their solar cells, increasing the overall cell efficiency. Early cells contained two busbars, though the majority of solar cells now have three. Four-busbar technology can increase cell efficiency by 0.3% (ITRPV 2016, BNEF 2014). Recently, Canadian Solar recently launched their five-busbars mc-Si and mono-Si products with cell efficiency as high as 20% (Canadian Solar 2016).
Module makers have been aggressive in cutting costs as well. Previously, Chinese module assemblers relied on international suppliers for main components, but new domestic entrants allowed them to source these components locally at a fraction of the cost of international brands. For example, ethyl vinyl acetate (EVA) sheets, front glass covers, and aluminum frame are all produced domestically. Chinese producers have been forceful in fabricating inexpensive alternatives to more complex components. For instance, Jolywood (Suzhou) Sunwatt, a Chinese firm, offers backsheet at half the cost of DuPont12.
The indigenization of capital equipment was one of the most important factors in driving down PV module costs. Early Chinese PV entrants purchased turnkey production lines from Western equipment makers, who in turn trained local employees to operate the machines (la Tour et al 2011, Zhang and Gallagher 2016). Small-scale producers, who were more price-conscious, opted to purchase domestic equipment. Early equipment was rife with quality issues, but through iteration and learning, often alongside with customers, equipment makers were able to iron out technical kinks and fine-tune their designs.
Investment costs have dropped significantly thanks to the proliferation of domestic equipment. For example, an expert from a leading Chinese equipment maker estimated that a 25 MW production line in the mid 2000s costed 100–300 million yuan RMB to set up. A production line of the same capacity currently costs about 40 million yuan RMB. Automation also helped to reduce labor costs. Five years ago operating a 500 MW module manufacturing plant required around 2000 employees, but a new plant of the same capacity can be run with 400 people (Zheng 2016). Similarly, as Suntech emerged from its bankruptcy, the company was able to reduce its work force from 10,000 in 2011 to 3000 in 2016 while maintaining the same level of production capacity13.
3.2. Experts assessments of non-technological factors for Chinese silicon PV cost decline between years 2005 and 2015
Policies aimed at creating market demand for solar PV technologies—what Gallagher (2014) terms 'market formation policies'– were critical to the development and success of China's solar industry14. These policies included generous feed-in-tariffs (FIT) in Europe before the financial crisis and in post-Fukushima Japan; and renewable energy portfolio, net energy metering laws, investment tax credits in the US15. The Chinese government also used demonstration projects and FIT to promote domestic deployment of solar. Promotion of solar energy not only brought the promise of jobs and exports, but it also dovetailed with the central government's official commitment to environmental protection and clean energy16.
The experts also stated that access to capital and technology was not a constraint (Gallagher 2014). Financial aid from the local governments in the form of cheap loans, tax breaks, low-cost land-use rights, and subsidized electricity made investment in solar PV more attractive, even at times bringing the market to a 'feverish frenzy'17.
Economies of scale, agglomeration effects, learning-by-doing, and human capital mobilization—especially in the form of intellectual returnees—contributed to the competitiveness of Chinese PV industry18. Previous literature also identifies these factors (Yu et al 2011, Goodrich et al 2013, Luo et al 2013, Gallagher 2014). Flexible management, especially among small firms, enhanced the industry's competitiveness. Additionally, a number of firms pursued vertical integration to improve their financial prospects (Zhang and Gallagher 2016), though this strategy has left some firms exposed and vulnerable to market and policy shifts and caused firms great financial duress that sometimes led to bankruptcies.
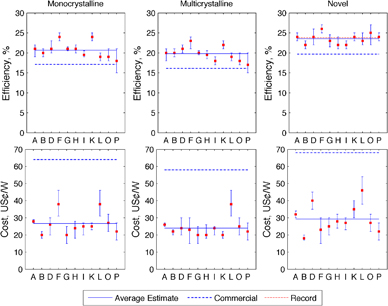
Figure 1. Expert judgments of efficiency and cost in 2030 for monocrystalline, multicrystalline, and novel silicon PV modules. Each expert response corresponds with the best, upper, and lower estimates. We also report the average of the best estimates and 2015 commercial values. Panasonic HIT panel holds the lab record module efficiency of 23.8% (Green et al 2016); its commercial efficiency is 19.7% (Panasonic 2016). Data for commercial efficiency of mono-Si and mc-Si modules are from BNEF (2016b), data for commercial prices of mono-Si and mc-Si modules are from BNEF (2016a), data for commercial price of novel modules is from pv magazine (Schachinger 2016).
Download figure:
Standard image High-resolution imageCharacteristics particular to silicon PV technology and the industry's organization allow silicon PV to be competitive over other types of solar PV technologies19. Compared to thin-film, the silicon PV industry is highly modular in its organization. Improvements can come from cell or module makers or from material and equipment suppliers. Changes in one part of the supply chain does not necessarily compromise the operation or technical specifications of another. A design change in the doping process does not impinge on the cleaning process. A new profile for cell conductor does not affect how backsheets are made. 'Drop-in' equipment replacements do not require manufacturers to modify their entire existing production line20. In contrast, manufacturers of other solar technologies, such as CdTe, CIGS, pursue a more integrated approach21.
The modular and open nature of silicon PV technology further drives product specialization and knowledge spillover within the industry. In a mature industry with standard products, improvements that result in price reduction can translate to rapid adoption, an outcome that can be accelerated by leading firms' embrace of the improved technology. For example, a major Chinese silicon PV firm, in partnership with a domestic tool maker, successfully developed a technology that would prevent light-induced degradation in modules. As soon as the partnership ended, the tool maker introduced the technology to other module producers, and the technology quickly became an open secret22.
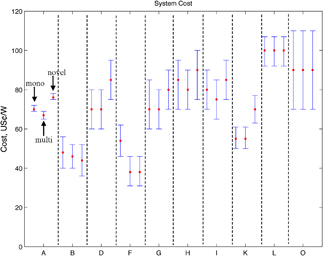
Figure 2. Experts judgment of expected cost for PV systems using mono-Si, multi-Si, and novel Si modules by 2030. Each expert responds with their best, upper, and lower estimates.
Download figure:
Standard image High-resolution image3.3. Expert assessment of future cost and performance of Chinese PV technologies
3.3.1. Silicon PV technologies
Under current RD&D scenario, all experts anticipated continued improvement in efficiency for all silicon-based PV technologies from Chinese producers (figure 1). Median estimates show that mono-Si modules will reach an average efficiency of 21.2% by 2030 (solid line in figure 1), about 4% higher than the average mono-Si module sold today (dashed line). Average efficiency for mc-Si modules will be one percentage point lower, and average efficiency for novel silicon-based technology will reach 23%. Some experts anticipated that in the most optimistic scenario novel technology would be close to the theoretical maximum efficiency of about 30% (Shockley and Queisser 1961). Estimations are fairly consistent with some exceptions. Experts F and K expected significantly higher efficiency for mono-Si and mc-Si modules, while most experts saw limited prospects for these technologies. Some experts anticipated that aluminum back surface field (Al-BSF) solar panels for the most part would be replaced by high-efficiency panels, though low-cost, low-efficiency products would continue to exist in the market.
All experts stated that the module cost would continue to decline (figure 1). Median estimates for mono-Si module costs range from $0.16/W to $0.46/W, with an average cost of $0.27/W (solid line in figure 1). For comparison, mono-Si module price in early 2016 was $0.64/W (dashed line). Due to oversupply, mono-Si module price had already fallen by 30% within one year to $0.41/W (Energy Trend 2016), reaching the lower range of results in recent studies (Anadon et al 2011). The average of median estimates for mc-Si module production costs is $0.24/W, $0.15/W lower than its current price. Novel modules will be more expensive relative to mono-Si and mc-Si modules, reaching around $0.30/W.
Estimated ranges for costs are wider than those for efficiencies. Overall, the estimated ranges are narrower than previous studies (Curtright et al 2008). Efficiencies for silicon PV modules have improved over the past decade, but the theoretical efficiency ceiling remains unchanged. Similarly, decrease in module cost has been dramatic, but future system cost reductions will depend more on non-module components.
Figure 2 shows elicited system costs for different silicon PV technologies by 2030. Average of median estimates for mono-Si PV system cost is $0.72/W, about four cents higher than mc-Si system. PV system using novel modules is $0.03/W more expensive than mono-Si-based system. Two experts anticipated no difference in system costs across the three technologies (Experts L and O); two stated novel PV systems would be cheaper (Experts B and F). Novel modules may be more expensive, but their higher efficiency drives down area- and weight-related component costs. Such offset can be more pronounced as module becomes a smaller fraction of the system costs.
All experts were confident that by 2030 system costs would fall below six yuan RMB per Watt ($0.92/W) (table SI 2)23. Likewise, all but three experts assigned a better-than-chance probability that 2030 system costs would fall below four yuan RMB per Watt ($0.62/W). This translates to an LCOE of about $40/MWh (table SI 4). At $40/MWh, LCOE for solar energy is comparable with the current LCOE for coal in China (Salvatore 2013). Using experts' estimates for module prices, we also compute LCOE for solar under different assumptions about balance of system costs (tables SI 5 and 6). We find that LCOE for solar can reach as low as $34/MWh, half of the LCOE that Bosetti et al (2012) report. However, these LCOE estimates do not account for integration costs. The assumed capacity factor of 20% is optimistic for China: in 2015 the industry's utility factor for solar PV was 12.9%, and its capacity factor was 10% (NEA 2016).
Improvements in both efficiency and production costs can come from a number of sources. New cell designs such as PERC/L/T, IBC, and HIT can help Chinese producers boost cell efficiencies. These high-efficiency cells were invented and developed elsewhere, but Chinese cell makers hope that they can scale up operations and indigenize equipment to drive down costs in a similar manner as Al-BSF cells.
Advances in polysilicon and wafering process can further lower production costs. Recently the industry has turned to Fluidized Bed Reactor (FBR) as a cost-effective alternative technology to produce polysilicon material (BNEF 2014). Adoption of diamond wire sawing technology for mc-Si application in conjunction with black silicon technology can reduce kerf loss and increase mc-Si cell efficiency.
All experts believed that China would remain a strong player in silicon PV, but they envisioned two scenarios for the industry's long-term evolution. In the first scenario improvements across the supply chain through specialization of material and equipment would continue, though with some degree of industry consolidation24. In the second scenario, major organizational and technological changes would take place, resulting in a shortened supply chain and substantial reduction in capital intensity25. For example, a new technology that would enable direct growth of the absorber layer from raw polysilicon could allow producers to bypass multiple upstream production processes.
3.3.2. Non-silicon PV technologies
Most experts expected that silicon PV would continue to be the mainstream electricity supply technology for at least the next ten years. Some experts expected that demand for non-silicon PV technologies would remain relatively small, but others offered a more positive outlook, believing demand would rise26. Differences in technical characteristics and application requirements can result in wide segmentation of PV products. Furthermore, China may continue to be a strong player in silicon PV cell and panel production, but the US, Germany, and Japan may focus on non-silicon technologies.
Of the non-silicon PV technologies, thin film is the most promising candidate that can challenge silicon both on efficiency and cost. A few Chinese firms are engaged in thin film module production, but they command only a small fraction of the domestic solar PV market. Amorphous silicon's market share has diminished substantially in recent years, and experts concluded that it was essentially eliminated from the market.
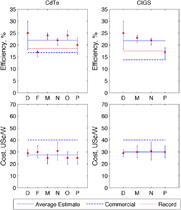
Historical module efficiency and learning rates for thin film technologies are lower than c-Si PV (Chen et al 2014), but some experts expected thin film technologies to maintain its competitiveness27. Median estimates show efficiency for cadmium telluride (CdTe) modules will reach 22% by 2030 with production cost of $0.27/W (figure 3). For comparison, modules made by the world's largest CdTe manufacturer, First Solar, have a 16.8% efficiency and cost $0.40/W (First Solar 2016, Martin 2016). CdTe manufacturers need to scale up their production size without sacrificing efficiency and reliability. Copper-indium-gallium-selenide (CIGS) modules will achieve lower efficiency and cost reduction than CdTe. CIGS technology may not be able to compete with silicon-based PV on a cost basis, but CIGS module's lightweight and highly flexible features allow them to compete in other market segments.
Figure 3. Expert judgments of efficiency and cost in 2030 for CdTe and CIGS thin film technologies. Each expert responds with their best, upper, and lower estimates. CdTe modules will reach an average efficiency of 22%. First Solar CdTe panels hold a lab record efficiency of 18.6%, and their commercial panels have an efficiency of 17.1% (Green et al 2016, First Solar 2016). Production cost for First Solar panels is $0.40/W (Martin 2016), compared to the experts' average estimate of $0.27/W. CI(G)S modules will reach an average efficiency of 23%. Current commercial efficiency is 13.8% (Solar Frontier 2016), and record efficiency is 17.5% (Green et al 2016). Production cost for CI(G)S modules will be $0.29/W. Solar Frontier, the largest CI(G)S incumbent, has a target production cost of $0.42/W by 2017 (Watanabe 2015).
Download figure:
Standard image High-resolution image
A number of concentrator photovoltaic (CPV) demonstration projects have gone online around the world (Philipps et al 2015), though experts generally expressed skepticism toward CPV's future viability. Expert O did not see commercial viability for CPV systems and declined to provide CPV's future costs and efficiency28. The collapse in polysilicon price made low concentrator photovoltaic (LCPV) less attractive. A leading firm in LCPV, SunPower offers a tracker system using its high-efficiency solar cell, but the product has not been successful due to the precipitous fall in prices of traditional silicon PV panels. High concentrator photovoltaic (HCPV) system uses high-efficiency multi-junction cells, but challenges in tracking and alignment mechanisms and high system costs remain. One expert posited that CPV systems could be competitive in sunny regions close to big population centers with high electricity price. For example, CPV systems could be installed in North Africa to provide electricity across the Mediterranean to Europe.
Excitonic technologies have enjoyed wide academic interests in China, though their commercial prospects remain bleak. Gain in efficiency for dye-sensitized solar cells and organic photovoltaic technologies would continue, though reliability issues would preclude them from replacing silicon crystalline PV29. Silicon PV technologies typically last between 20–25 years, whereas excitonic PV lifetimes are much shorter. Perovskite, the most promising of the emerging technologies, faces reliability and stability issues as well. Perovskite's lab efficiency has increased nearly six times since its introduction in 2009 (Kojima et al 2009, NREL 2016). Recently researchers were able to fabricate large, stable cells (University of New South Wales 2016). Perovskite would not be ready for commercial production in the near future30, but investors have shown intense interests in this technology (Snieckus 2016). Other emerging technologies have not made it past the lab stage, and there is little commercial interest for them in China.
4. Discussion and conclusion
We find that if estimates provided by experts materialize, Chinese solar PV will continue following a cost reduction roadmap, closing in on coal as a cheap source of power, with silicon PV remaining the dominant technology for large-scale electricity-generation applications.
Similar to many expert elicitation surveys, this study does not have a large sample size. Recent studies such as Wiser et al (2016) consider samples of substantially larger size through online instruments. There are merits to both approaches. In-person interviews allow experts to participate in in-depth discussions, where they can ask clarification questions and review and modify their responses. Though it is impossible to completely eliminate cognitive biases, a number of tactics can be employed to minimize effects of these biases and ensure internal consistency. A broader representation of experts may affect different technologies in different ways. For instance, a larger sample size would have little influence on the efficiency estimates for silicon PV technologies given their maturity levels and their physical limits. The range of production cost estimate might widen with a slight downward tilt in light of the general bullish sentiment within the industry. However, it is not immediately clear how a larger sample might affect results for other PV technologies primarily because there currently exist few, if any, commercial projects of these types in China.
There are a few notable cultural differences. Out of humility Chinese experts often understated their levels of expertise during self-evaluation. After being reminded of the anonymous nature of the study, a few changed their minds. Experts in general did not shy away from sensitive topics, such as curtailment and overcapacity problems within the industry. This may be because the interviews were conducted in Chinese, and because the first author is of Asian descent. There are few differences between responses from Chinese and non-Chinese experts with one notable exception. Whereas non-Chinese experts were more conservative in their responses for traditional PV technologies, Chinese experts were more confident that these technologies would continue to improve in both efficiency and costs.
That Chinese silicon PV makers did not require fundamental breakthroughs in order to slash costs and boost efficiency is remarkable. The standard Al-BSF design was invented decades ago, and physics principles behind photovoltaics were established much earlier. Advanced cell designs like PERT, IBC, and HIT predated China's entrance to the PV market. Nonetheless, China's leading production and installation status confers certain advantages. As long as a new innovation stays within the silicon paradigm, a firm has to rely on China's manufacturing infrastructure as a 'platform for product development'(Nahm and Steinfeld 2014). Equipment manufacturers need to design new 'drop-in' machines that are compatible to existing production lines. In this sense, China has essentially become the test bed for new silicon PV technologies.
In the short term, China solar PV's success may also be its largest obstacle. Attracted by burgeoning global and domestic demand, investors have poured money into capacity expansion. Local governments are eager to build the next local champion. Existing firms continue to scale up, hoping that economies of scale will justify their investment. These commitments leave large firms especially exposed to sudden market or policy shifts. As new capacity comes online, prices plunge and margins shrink. Instead of investing in long-term R&D, many firms are fixated on chasing short-term profits. What small firms cannot offer in quality, they make up in price. Price-conscious developers are willing to sacrifice quality for a better deal, especially in locations where land is not a constraint. Most remarkably, this pressure is almost entirely domestic. The industry is currently in the throes of another overcapacity episode: module prices in 2016 decreased by 30%. This is great news for PV customers around the world, but for central planners, it is neither efficient nor sustainable. Furthermore, episodic overcapacity of traditional silicon panels in recent years may have impeded the adoption of high-efficiency technologies.
In an effort to cull the industry, the National Energy Administration (NEA) has implemented the 'Top Runner Program,' which grants development priority to projects that use modules of certain efficiency and reliability standards (NEA 2015). The government reduced the country's installed target to 110 GW from 150 GW (BJX 2016) to cool the pace of solar development, though with little success. In 2017 the industry installed more than 50GW, blowing past the 2020 target. As a result, the NEA almost doubled the target to 213 GW (NEA 2017). Feed-in-tariff levels for utility solar were lowered by 24%–31%, and again by 12%–15% from 2017 levels. This adjustment was ostensibly designed to account for the falling module prices, but it will slow rampant development as well. At the same time, downstream problems have surfaced. China's wind industry has been continually troubled by curtailment (Lam et al 2016), and its solar industry is facing similar problems. The national average curtailment for solar is 12.6% in 2015, and curtailment is much worse in the North Western provinces—more than half of Gansu's solar electricity was curtailed (CPIA 2016b). Distributed solar PV can help to mitigate curtailment issues, but its development so far has fallen short of official target (Zhang et al 2015).
Finally, given the uncertain nature of the innovation process, China's heavy emphasis on one technology may cause it to miss out on potential breakthrough technologies. A diversified research and development portfolio enlarges the knowledge pool that serves as the basis for new technologies or new concepts. Even technologies that do not have big market potential can serve as catalysts for future developments. For instance, perovskite traces its origins to research in dye-sensitized solar cells (Kojima et al 2009). In a diverse technology market, scientists and engineers can learn and draw inspiration from products outside their technical domain. Cross pollination of ideas can result in new breakthroughs. Thin film technologies improved their performance by building on surface passivating and antireflection principles used in crystalline silicon PV. At the heart of high-efficiency HIT cell's architecture is amorphous silicon, a thin film technology. Even if silicon PV is able to help countries to economically decarbonize their electricity systems like experts predicted, support for a diverse R&D portfolio can bring us to that future faster or in a more economically efficient manner.
Acknowledgments
We thank the experts for participating in this study. We gratefully acknowledge the financial support from the following sources: Fundação para a Ciência e a Tecnologia (Portuguese Foundation for Science and Technology), the CMU∣Portugal Program, the National Science Foundation, CMU's Scott Energy Institute and the Climate and Energy Decision Making Center (CEDM). For assistance and feedback on the protocol, we thank Ana Paola Giordano, Tatiana Marques, António Moreira (CLSBE); Ahmed Abdullah (UCSD), Prof. Kelly Gallagher (Tufts University); Prof. Granger Morgan, Chris Yang, and CEDM student seminar participants (Carnegie Mellon University); Sun Shuang (Tsinghua University); Prof. Sally Xu (Peking University).
Footnotes
- 5
We elicited in-house production costs instead of blended costs. For a discussion of the difference between the two, please refer to the supplemental information.
- 6
Please see the SI for a full description of the protocol and its development.
- 7
We refer to these as 'Interview' in the following sections.
- 8
Please refer to section 6 of the SI for a detailed discussion of relevant technological advancements.
- 9
Expert A.
- 10
Expert P.
- 11
Interview #1.
- 12
Expert A.
- 13
Interviews #10, #11.
- 14
Experts A, B, D, I, L, P, and O.
- 15
Please see IEA/IRENA Joint Policies and Measures Databases (2016) for a full summary of relevant policies.
- 16
In addition to GDP growth, evaluation and promotion criteria for local officials now include metrics on environmental management and clean energy development (Expert A).
- 17
Expert K.
- 18
Experts A, B, D, I, K, L, M, P, and O.
- 19
Experts H and L.
- 20
Expert H.
- 21
On the other hand, this integrated strategy affords thin film producers independence from equipment suppliers, and thin-film producers can customize their production lines and incorporate secret nuances in the production process.
- 22
Expert I.
- 23
This is roughly the same as the cost target set by the US SunShot initiative for US solar PV.
- 24
Experts A, B, I, and L.
- 25
Expert P.
- 26
Experts J, M, and P.
- 27
Experts A, J, M, and P.
- 28
Experts A, F, I, and N echoed this sentiment and were to various degrees skeptical of CPV's economic viability in the future.
- 29
Experts C, D, E, and O.
- 30
Experts D and F.