

Abstract
Mangroves are ecologically and economically important forested wetlands with the highest carbon (C) density of all terrestrial ecosystems. Because of their exceptionally large C stocks and importance as a coastal buffer, their protection and restoration has been proposed as an effective mitigation strategy for climate change. The inclusion of mangroves in mitigation strategies requires the quantification of C stocks (both above and belowground) and changes to accurately calculate emissions and sequestration. A growing number of countries are becoming interested in using mitigation initiatives, such as REDD+ (reducing emissions from deforestation and forest degradation), in these unique coastal forests. However, it is not yet clear how methods to measure C traditionally used for other ecosystems can be modified to estimate biomass in mangroves with the precision and accuracy needed for these initiatives. Airborne Lidar (ALS) data has often been proposed as the most accurate way for larger scale assessments but the application of ALS for coastal wetlands is scarce, primarily due to a lack of contemporaneous ALS and field measurements. Here, we evaluated the variability in field and Lidar-based estimates of aboveground biomass (AGB) through the combination of different local and regional allometric models and standardized height metrics that are comparable across spatial resolutions and sensor types, the end result being a simplified approach for accurately estimating mangrove AGB at large scales and determining the uncertainty by combining multiple allometric models. We then quantified wall-to-wall AGB stocks of a tall mangrove forest in the Zambezi Delta, Mozambique. Our results indicate that the Lidar H100 height metric correlates well with AGB estimates, with R2 between 0.80 and 0.88 and RMSE of 33% or less. When comparing Lidar H100 AGB derived from three allometric models, mean AGB values range from 192 Mg ha−1 up to 252 Mg ha−1. We suggest the best model to predict AGB was based on the East Africa specific allometry and a power-based regression that used Lidar H100 as the height input with an R2 of 0.85 and an RMSE of 122 Mg ha−1 or 33%. The total AGB of the Lidar inventoried mangrove area (6654 ha) was 1 350 902 Mg with a mean AGB of 203 Mg ha−1 ±166 Mg ha−1. Because the allometry suggested here was developed using standardized height metrics, it is recommended that the models can generate AGB estimates using other remote sensing instruments that are more readily accessible over other mangrove ecosystems on a large scale, and as part of future carbon monitoring efforts in mangroves.
Export citation and abstract BibTeX RIS

Original content from this work may be used under the terms of the Creative Commons Attribution 3.0 licence.
Any further distribution of this work must maintain attribution to the author(s) and the title of the work, journal citation and DOI.
1. Introduction
Estimating and monitoring forest carbon (C) stocks has become increasingly important because of its relevance to climate change adaptation and mitigation programs, as well as the importance of forest C stocks in the global C cycle and global environmental change studies. In the case of mangrove forests, there is still considerable uncertainty in the estimates of the C balance in its ecosystem, although recent studies have shown their potential for high C storage (Bouillon et al 2008, Donato et al 2011, Mcleod et al 2011, Murdiyarso et al 2015). Mangrove forests cover approximately 138 000 km2 of subtropical and tropical coastlines equivalent to 0.5% of global coastal areas or 0.7% of tropical forest area (Giri et al 2011, Alongi 2014). They provide a variety of ecosystem services such as harboring biodiversity, storm protection, sequestering nutrients, sediments and C, shoreline stabilization and linking terrestrial and aquatic environments. Of all the ecosystem services, C sequestration has become one of the most recognized (Donato et al 2011, Mcleod et al 2011, Siikamäki et al 2012). In addition, mangrove-lined estuaries and coastal ecosystems are significant to global biogeochemical processes and they regulate the structure, productivity and function of adjacent coastal ecosystems disproportionately relative to their limited land cover (Bouillon et al 2008, Kristensen et al 2008, Alongi 2014). Mangroves are also able to sequester C at a rate two to four times greater than mature tropical forests and can store three to five times more C per equivalent area than upland tropical forests (Donato et al 2011, Alongi 2014). This has led to mangrove C stocks being highly valued (Jerath et al 2016).
Despite their ecological importance, it is estimated that since the 1950s between 35% and 60% of global mangrove cover has been lost, primarily in South East Asia (Polidoro et al 2010, Van Lavieren et al 2012). Consequently, protecting forests from degradation and deforestation has been proposed in order to help mitigate C emissions through continued high C sequestration of mangroves and avoided emissions from soil decomposition and aboveground stock loss through initiatives such as REDD+ (reducing emissions from deforestation and forest degradation) (Chmura et al 2003, Duarte et al 2005, Bouillon et al 2008). One of the main challenges for implementing REDD+ is the accurate quantification of C emissions from deforestation and forest degradation, which requires accurate estimates of deforestation rates and biomass (Gibbs et al 2007). Generally speaking, most mangrove C is stored in the soil and in sizable belowground pools of dead roots (Alongi et al 2004, Donato et al 2011), but because soil C pools can be relatively stable in riverine and deltaic mangrove forests (Stringer et al 2015, Stringer et al 2014, Adame and Fry 2016), the focus on estimating mangrove forest C stocks and changes has been on monitoring changes in land cover and aboveground biomass (Shapiro et al 2015).
There has been interest in estimating forest composition and structure using remote sensing data, particularly in remote or hard to access forest areas like mangroves (Fatoyinbo and Simard 2013, Lagomasino et al 2016). Forest canopy height is the one structural attribute that can be accurately estimated with active sensors and which is highly correlated with biomass in forests (Duncanson et al 2010, Lu et al 2016). Aboveground biomass (AGB) in turn, can be directly converted to C stocks (IPCC 2006). Forest structure measurements, such as metrics of forest height, generated from airborne laser/Lidar (ALS) have been used successfully to estimate AGB and C content in numerous forest types (Zhao et al 2012, Schlesinger and Bernhardt 2013, Zolkos et al 2013, Duncanson et al 2015, Taylor et al 2015), but applications of Lidar data in mangrove forests are scarce (Simard et al 2006, Feliciano et al 2014). Many of the abovementioned studies use different definitions of canopy height, such as mean height of all trees, basal-area weighted height, or height of the tallest tree within a certain area. This can lead to variations in the methods to estimate AGB and sometimes differing results from the same datasets.

Figure 1. Study area along Zambezi Delta showing plot locations and ALS survey outline. Dark grey areas represent mangrove cover mapped by Shapiro et al (2015).
Download figure:
Standard image High-resolution imageIn mangrove forests in particular, AGB estimation from ALS or other canopy height datasets has taken the form of regressions relating plot-level field measurements of AGB with field, airborne or spaceborne measurements of canopy height. The most commonly used linear regression model relating canopy height and mangrove AGB was developed by Saenger and Snedaker (1993) based on a review of 43 published papers and reports on field measurements. This model was applied to continental scale estimates of mangrove canopy height generated from the Shuttle Radar Topography Mission (SRTM), a spaceborne InSAR (Interferometric Synthetic Aperture Radar) dataset, combined with spaceborne Lidar from the GLAS (Global Laser Altimetry System) instrument in Fatoyinbo and Simard (2013). Similar, more site specific models have been used to estimate AGB from SRTM in the Florida Everglades (Simard et al 2006, Feliciano et al 2017), Colombia (Simard et al 2008), Mozambique (Fatoyinbo et al 2008), West Africa (Tang et al 2016) and Indonesia (Aslan et al 2016). AGB estimates may vary greatly depending on the selection of the allometric models, as the estimates are dependent on (a) the availability of a specific model for the species and region of interest, (b) whether the allometry was intended as a global, national or regional model, (c) which field-based parameters (e.g. diameter at breast height (DBH), height, wood density) are used as allometric inputs, and (d) the range of input values, such as DBH and height, used to generate the allometries (Chave et al 2014). As an example, Zhao et al (2012) found that Lidar-based allometric models using reference AGBs calculated from regional allometric models performed much better than those using reference AGBs calculated from national models. This was in part due to the inclusion of height as input into the regional or site-specific models, in addition to DBH. In mangrove forests, site-specific allometric models are rare, and generalized models are most commonly used. The most used allometry for non-neotropical mangroves was developed by Komiyama et al (2005) and uses DBH and wood density as input. The general tropical equations developed by Chave et al (2004) and Chave et al (2014) based on canopy height in addition to DBH and wood density as input can also be applied to mangroves. Additionally, regional equations have been developed for the Everglades in Florida (Smith and Whelan 2006, Feliciano et al 2014), Gazi Bay in Kenya (Kairo et al 2009), Tanzania (Njana et al 2015), Sofala Bay, Mozambique (Sitoe et al 2014), Brazil (Olagoke et al 2016) among others.
The aim of this study was develop a biomass estimation model for mangroves using a combination of ALS and field data. ALS data has not been widely used in mangrove forests, and their unique structure of aboveground root systems, and regular inundation might result in errors in the height retrievals. Furthermore, REDD+ will be implemented by countries with extensive mangroves throughout the tropics, yet it is not yet clear whether ALS-based methods to measure AGB stocks and changes in other ecosystems can be applied to mangrove systems. Here we present an AGB estimation approach using high point cloud density ALS data calibrated and validated using field measurements of canopy height and AGB in the Zambezi Delta Region in Mozambique, a REDD+ pilot study site (Shapiro et al 2015, Trettin et al 2015). We evaluated the (1) accuracy of using H100, or the height of the 100 tallest trees within a hectare, to estimate AGB and (2) the effect of using three different allometric models on AGB values and uncertainties.
2. Materials and methods
2.1. Study area
Africa is home to one fifth of the world's mangrove forests (Giri et al 2011) and there has been a loss of African mangrove forests due to small scale and commercial harvesting, oil exploitation and climate change (Corcoran et al 2007). Within Africa, Mozambique is ranked second in mangrove area (3054 km2) (Fatoyinbo and Simard 2013). Mangroves occur along the entire length of the 2770 km Mozambican coastline, but the largest areas are found in the northern and central regions (Benkenstein and Chevallier 2013). Our study area encompasses the mangroves forests of the Zambezi Delta region (figure 1), which extends for 180 km along the coast and approximately 50 km inland, making it the second-largest continuous mangrove habitat in Africa (Barbosa et al 2001).
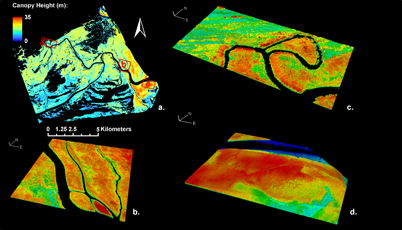
Figure 2. (a) Zambezi Delta Lidar H100 mangrove canopy height map with zoomed areas showing various mangrove statures (b), (c) and (d).
Download figure:
Standard image High-resolution imageThe Zambezi Delta's vegetation is a mix of woodlands, savanna, grasslands, coastal dunes, marshes, freshwater wetlands and mangroves, which are estimated to cover an area of ~37 000 ha within the Delta (Shapiro et al 2015). There are eight mangrove species present here: Avicennia marina, Bruguiera gymnorrhiza, Ceriops tagal, Heriteria littoralis, Lumnitzera racemosa, Rhizophora mucronata, Sonneratia alba and Xylocarpus granatum. They are distributed in heterogenous mixtures with no obvious zonation, and stocking densities averaging 2036 trees per hectare (Trettin et al 2015). Since the construction of the Kariba and Cahora Bassa dams in 1959 and 1974, freshwater and sediment discharge to the delta have reduced; these hydrological changes were predicted to result in coastal erosion and loss of coastal ecosystem extent (Beilfuss et al 2001). However, a recent Landsat-based study of mangrove change detected an increase in total mangrove extent of over 3000 ha from 1994–2013, due to low deforestation rates and expansion into new areas (Shapiro et al 2015). The new areas that have been colonized include new seaward land formed through sediment trapped by mangroves and upland areas colonized by mangroves, possibly as a result of both sea level rise and decreased freshwater discharge (Shapiro et al 2015). The Zambezi River Delta's mangroves not only play a key role in sustaining the livelihoods of the nearly 200 000 people living in the region, but they are also particularly important to Mozambique's economy as they support the shrimp fisheries of the Sofala Bank, a key export sector valued at US$114 M, equivalent to 14% of total exports in 2002 (WWF 2011).
2.2. Field measurements of forest C stocks
C stocks of mangroves within the Zambezi Delta were inventoried using a stratified random sampling design that took into account forest canopy height class determined from the Mozambique mangrove canopy height product derived from SRTM and GLAS data (Fatoyinbo et al 2008). This height-based stratification method ensured that forest inventory would be distributed across all representative canopy height and biomass strata (Trettin et al 2015). In total, the forest was separated into five height classes, and five sub-plots (0.0154 ha) were used as the basis for measurements and sampling within each 0.52 ha plot to characterize above and belowground biomass C pools. Within each sub-plot tree DBH and height were measured using a nested sampling approach, with trees > 5 cm measured on the entire sub-plot and trees < 5 cm were measured on a 2 m radius area. DBH was measured with a diameter tape, and tree height was measured and rounded to the nearest 0.5 m with a Haglof Vertex III hypsometer. Details regarding the mangrove field inventory can be found in Stringer et al (2015) and Trettin et al (2015).
2.3. Lidar data collection and processing
To compare and analyze field-based canopy height and AGB measurements in the Zambezi Delta, commercial ALS data were acquired on May 5–6, 2014 with a point density of 10 points per m2 (Fatoyinbo et al 2017). The airborne survey comprised an area of 115 km2 in the Zambezi Delta region (figure 1). The last ALS return data were used to generate a 1 m × 1 m resolution digital terrain model. A digital surface model (DSM) and a canopy height model (CHM) were also generated using the point cloud data. Mangrove canopy heights were calculated relative to the Earth Gravitational Model 2008 (EGM2008) geoid. The mangrove DSM and CHM were georeferenced into a WGS84 datum and UTM Zone 36 South projection. Mangrove forest extent was extracted in the Lidar data using the most recent published Landsat-based map (Shapiro et al 2015).
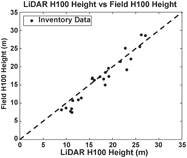
Figure 3. Comparison of Field H100 and Lidar H100 heights. R2 values for the plots are 0.93, RMSE (m) for Lidar H100 vs Field H100 is 1.73 m.
Download figure:
Standard image High-resolution imageOf the 52 plots sampled in the Zambezi Delta, 24 fell within the ALS survey (figure 1). To compare and analyze the ALS-derived canopy height model versus other height metrics and tree-level AGB estimates, we processed and converted ALS height estimates to Lidar H100 (figure 2), equivalent to the height of the 100 tallest trees in a given hectare, based on the assumption that the tallest trees contribute the most to AGB estimates (Aulinger et al 2005, Hajnsek et al 2009). In order to acquire the H100 value from the ALS data, a moving window of 10 m2 was used to extract the highest first return value for the tallest tree in this window resulting in one maximum tree value per moving 10 m2 window, equivalent to 100 trees per hectare. This is a similar method to what has been used in comparable forest stand structure studies to compare canopy height estimation of optical and radar remote sensing datasets (Aulinger et al 2005, Lee and Fatoyinbo 2015, Lagomasino et al 2016). The main motivation for using the H100 metric was for ease of comparison with other, high and medium resolution spaceborne canopy height datasets, such as those derived from stereo photogrammetry, polarimetric InSAR or other digital canopy height models representing the height top of the canopy, as has been shown by Lagomasino et al (2016). This would allow us to expand the model relating H100 to AGB from being site- and ALS-specific, to a larger scale.
2.4. Field height metrics and Lidar-based canopy height analyses
We compared Field H100 height with the Lidar H100 height metric to evaluate the accuracy of the Lidar relative height estimates (figure 3). Field H100, was calculated from the field data using the average of the two tallest trees for each sub-plot of 7 m radius/0.0153 ha area:
where Field H100 is in m and H1.53 trees (the mean height of 1.53 trees) is in m. For simplification the mean height of 2 trees per sub-plot was used.
The comparison between Lidar H100 and Field H100 yielded an R2 of 0.93 and RMSE of 1.7 m, confirming that the Lidar data was able to well characterize Field H100 in mangroves (figure 3).
2.5. Total plot-level aboveground biomass estimates
We estimated AGB using the generalized Komiyama et al (2005) mangrove allometry, the pantropical (Chave et al 2005) allometry, and the Tanzania mangrove allometry (Njana et al 2015), as there is no site-specific published allometry for the Zambezi region. The Njana et al (2015) allometric model was selected as it was developed for the same geographical region (East Africa) and species as are present in the Zambezi. The Komiyama and Chave allometries were selected because they are global models that are primarily driven by species-specific wood density in the case of Komiyama and species-specific wood density and height in the case of Chave. Also, while a recent study by Sitoe et al (2014) did develop allometries for Sofala province in Mozambique, this model has been shown to result in extremely low per ha values, most likely due to an error in the equation (Trettin et al 2015). We therefore did not include the use of the Sofala allometry in our study. Komiyama's generalized mangrove AGB equation was derived using DBH and wood density as parameters and is given by equation (2):
where AGBK is above-ground biomass in kg per tree, ρ is wood density in g cm−3 and D is DBH in cm. This model has a standard AGB error of 8.5% and was created from mangrove stands with a maximum DBH of 49 cm (Komiyama et al 2005).
The generalized pantropical Chave et al (2005) equation for moist mangrove forests is given by equation (3):
where AGB is above-ground biomass in kg per tree, ρ is wood density in g cm−3, D is DBH in cm and H is height in m. Chave et al (2005) incorporates tree height information, which reduces the standard error. This model has a standard AGB error of 12.5% and was generated for mangrove stands with a maximum DBH of 42 cm. An additional AGB allometric equation, which incorporates height, DBH and wood density is given by Njana et al (2015) equation (4):
where AGB is above-ground biomass in kg per tree, ρ is wood density in g cm−3, D is DBH in cm and H is height in m. This model was developed for quantification of tree above and belowground biomass for Avicennia marina, Sonneratia alba and Rhizophora mucronata, which are the dominant mangrove species in East Africa. The standard error for this model was less than 10%, and was generated for trees with a maximum DBH of 70.5 cm and maximum height of 32.2 m.
As both DBH and tree height data were available in this study, we were able to generate comparative estimates of AGB using all three models. The values for wood density that we used were found on the world agroforestry wood density database (www.worldagroforestry.org/sea/Products/AFDbases/WD/Index.htm). The range of wood density values covers published values found around the globe. Because none of the wood densities reported are specific to Mozambique, we used the mid-values of wood density shown in table 1. While this is another source of uncertainty in the biomass estimate, it is the same ρ value that was used by the field-based studies in the Zambezi by Stringer et al (2015) and in Tanzania by Njana et al (2015), thereby allowing intercomparison of our results with previous studies. Furthermore, it somewhat constrains the bias of the allometric model, meaning that we neither systematically over or underestimate the AGB.
We calculated total AGB for the 24 plots located inside the ALS transect and for the plots located outside the ALS transect using the allometric equations referenced above (equation (2) = AGBK, equation (3) = AGBC and equation (4) = AGBN), table S1 available at stacks.iop.org/ERL/13/025012/mmedia. Statistical Ordinary Least Squares regressions were then generated between height metrics and total AGB estimates derived from the three existing allometric models for each plot. All analyses were carried out using MATLAB software and consisted of fitting linear and power regression models to Lidar H100 height metrics with AGB values calculated from the three AGB allometric models (figure 4). In order to validate the regression results, half of the plots were used for the regression analysis and half for the validation analysis. For the Lidar H100-based regressions, 12 plots were used for validation and 12 plots for the regression analysis (figure S1). Using the resulting regression models, we selected the best model to generate the AGB estimates for the Zambezi Delta, taking into account the R2, root mean square error (RMSE) and how well the range in input data used to generate the allometric models overlapped with the actual field measured values in the Zambezi. To produce the AGB maps we applied a 25 m smoothing filter, equivalent to the size of the sub-plots. This methodology allowed us to resample the data without losing resolution.
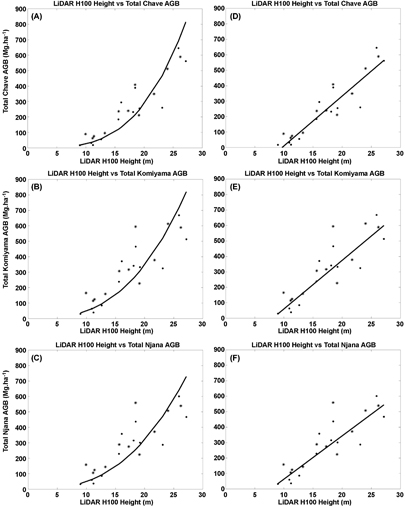
Figure 4. Power- and linear-based Lidar H100 height vs AGB regressions are shown in panels (A)−(F). The first column (A), (B) and (C) shows power-based Lidar H100 vs Chave, Komiyama and Njana based AGB estimates. The second column (D), (E) and (F) shows linear-based Lidar H100 vs Chave, Komiyama and Njana based AGB estimates. The solid dots represent plot level AGB calibration data while stars are the plot level AGB values used for validation.
Download figure:
Standard image High-resolution image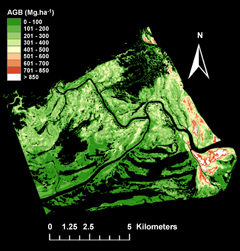
Figure 5. Zambezi Delta mangrove AGB maps derived from Lidar H100 and the Njana power-based model. Total AGB stock for the region shown was 1 350 902 Mg.
Download figure:
Standard image High-resolution image
3. Results
3.1. Field estimates of above ground biomass
Plot level AGB estimates varied depending on which allometric model was used (table S1), with mean plot AGB of 294.4 Mg ha−1 for AGBK versus mean plot AGB of 231.2 Mg ha−1 for AGBC and mean plot level AGB of 271.5 Mg ha−1 AGBN (table 2). The maximum plot level AGB ranged from 668.18 Mg ha−1 (AGBK), to 601.11 Mg ha−1 (AGBN). The spread in AGB estimates generally increased with height classes, as the uncertainty introduced by the allometry increased with taller stands (table 2).
Table 1. Wood density values for mangrove species found in the Zambezi Delta. Source: World Agroforestry Center.
| Mangrove species | Wood density (kg m−3) | ||
|---|---|---|---|
| Low | Mid | High | |
| Avicennia marina | 0.79 | 0.81 | 0.85 |
| Bruguiera gymnorrhiza | 0.63 | 0.84 | 1.05 |
| Ceriops tagal | 0.87 | 0.97 | 1.09 |
| Heriteria littoralis | 0.83 | 0.98 | 1.23 |
| Lumnitzera racemosa | 0.75 | 0.88 | 0.97 |
| Rhizophora mucronata | 0.94 | 1.02 | 1.12 |
| Sonneratia alba | 0.62 | 0.78 | 1.00 |
| Xylocarpus granatum | 0.59 | 0.70 | 0.83 |
Table 2. Comparison of plot level field AGB (Mg ha−1) within the Lidar imaged area (24 plots) generated using three allometric models.
| AGBChave | AGBKomiyama | AGBNjana | |
|---|---|---|---|
| Mean AGB | 231.2 | 294.4 | 271.5 |
| Standard Deviation | 158.7 | 165.9 | 148.8 |
| Min plot level AGB | 17.3 | 29.6 | 31.7 |
| Max plot level AGB | 644.9 | 668.2 | 601.1 |
| Height Class Mean (Std. Dev.) | |||
| 7−9.9 m | 47.9 (27.4) | 85.7 (47.3) | 85 (46.2) |
| 10−12.9 m | 136.5 (89.7) | 208.1 (119.5) | 190.5 (110.3) |
| 13−17.9 m | 244 (63.6) | 329.2 (95) | 305.4 (88.3) |
| 18−29 m | 439.4 (150) | 472.2 (143.3) | 429.2 (119.8) |
Table 3. Regression models based on field AGB and Lidar H100 (LH100). (Models were based on 12 data points. 12 additional data points were used for validation).
| Equation | R2 | p-value | RMSE (Mg ha−1) | RMSE (%) | Allometry |
|---|---|---|---|---|---|
| Linear | |||||
| AGB = 32.27 ⁎ (LH100)—312.84 | 0.85 | 0.000023 | 78 | 24 | Chave |
| AGB = 31.45 ⁎ (LH100)—254.81 | 0.82 | 0.000040 | 83 | 23 | Komiyama |
| AGB = 28.02 ⁎ (LH100)—217.2 | 0.80 | 0.000110 | 80 | 24 | Njana |
| Power | |||||
| AGB = 0.01 ⁎ (LH100)3.46 | 0.88 | 0.000005 | 119 | 33 | Chave |
| AGB = 0.07 ⁎ (LH100)2.83 | 0.86 | 0.000012 | 135 | 33 | Komiyama |
| AGB = 0.10 ⁎ (LH100)2.7 | 0.85 | 0.000023 | 122 | 33 | Njana |
3.2. Lidar estimates of aboveground biomass
Using linear and power-law models of AGB and Lidar H100, we found that Lidar H100 alone could explain up to 80%−88% of the variation in plot-level AGB values (table 3, figure 4). A summary of the ALS-based AGB predictive models and their respective coefficients of determination can be found in table 3. In general, the Lidar-based regression models performed equally or better in estimating AGB than the field height measurements in terms of R2. Although all linear models have lower errors than the power models, they could not be used in stands shorter than 7 m as the linear models intersect the x-axis (figure 4), resulting in negative AGB estimates. While the power regressions had higher errors, they also have higher R2 and can be applied across the entire range of height values. Because there was no significant difference in R2 and RMSE between the Lidar H100-AGB power models (figure S1), we selected the Njana Power AGB prediction model as it is the only allometric model generated for East African mangroves, it takes into account height, and has the highest range in input DBHs and heights. Based on this, the total AGB of the Zambezi Delta is 1 350 902 Mg with a mean AGB 192 Mg ha−1. Total site level AGB stocks within the Lidar-surveyed area ranged from 1 274 245 Mg using the Chave power regression up to 1 583 927 Mg using the Komiyama linear regression, with mean AGB values ranging from 192 Mg ha−1 up to 252 Mg ha−1 (table 4 Fatoyinbo et al (2017)). The largest proportion of AGB was stored in height class 5 (18 m–28.9 m) and height class 6 (29 m to 35 m) (table 5). AGB density was not significantly different in height classes 2, 3 and 4. Using the selected Lidar H100-based allometry we then generated an AGB map for the 115 km2 area covered by the ALS data in the Zambezi Delta (figure 5).
Table 4. Total AGB estimates based on Lidar H100 (LH100) from the different allometries.
| Allometric equation | Total AGB (Mg) | Mean AGB in(Mg ha−1) [Standard Deviation] |
|---|---|---|
| AGBC = 32.27 ⁎ (LH100)− 312.84 | 1 312 092 | 224 [133] |
| AGBK = 31.45 ⁎ (LH100)− 254.81 | 1 583 927 | 252 [138] |
| AGBN = 28.02 ⁎ (LH100)– 217.2 | 1 472 805 | 232 [125] |
| AGBC = 0.01 ⁎ (LH100)3.46 | 1 274 245 | 192 [208] |
| AGBK = 0.07 ⁎ (LH100)2.83 | 1 384 576 | 209 [179] |
| AGBN = 0.1 ⁎ (LH100)2.7 | 1 350 902 | 203 [166] |
Table 5. Lidar H100 based mean AGB density values (Mg ha−1) by height range dependent on the allometric model. Standard deviation is shown in parenthesis.
| Height range (m) | Chave linear | Komiyama linear | Njana linear | Chave power | Komiyama power | Njana power |
|---|---|---|---|---|---|---|
| 2−6.9 | N/A | N/A | N/A | 4.3 (2) | 9.7 (4.4) | 10.9 (4.8) |
| 7−9.9 | 3.4 (1.6) | 30.9 (15.7) | 33.6 (16.8) | 17.9 (5.6) | 32.1 (8.2) | 34.6 (8.4) |
| 10−12.9 | 57.4 (26.7) | 106.1 (25.9) | 104.5 (23.1) | 47.1 (11.6) | 70.1 (14.3) | 73.3 (14.2) |
| 13−17.9 | 192.4 (45.8) | 237.5 (44.6) | 221.4 (39.8) | 140.7 (42.4) | 171.8 (42.8) | 171.3 (40.8) |
| 18−28.9 | 351.2 (79.8) | 392.4 (77.7) | 359.3 (69.3) | 374.1 (184.2) | 379.3 (146.3) | 364.0 (132.8) |
| 29−35 | 664.7 (31.5) | 697.8 (30.6) | 631.5 (27.3) | 1342.6 (153.9) | 1093.6 (101.8) | 1002.3 (88.8) |
The Lidar H100-based mean AGB values per height class (table 5) varied from those measured in the field (table 2). In general, the mean AGB values estimated from Lidar H100 data in the shorter height classes (up to 13 m) were lower than those estimated from the field plots while the Lidar H100-based mean AGB values of the taller forests were higher. For example, mean AGB using the Njana power model for trees between 7 m and 9.9 m was 34.6 Mg ha−1 while the plot-based estimate for that height class was 85 Mg ha−1. The AGB values of the taller classes on the other hand were much higher, ranging up to 1000 Mg ha−1 for the forests between 29 m and 35 m in height. This difference in AGB values can be attributed to several factors, the first being that the height classes from the field in table 2 are based on mean height whereas the height classes in table 5 represent the mean of only the tallest trees. For the lower height classes, the modeled fit is always lower and the field-based AGB has a much larger standard deviation (~46 Mg ha−1) because of the more variable range of AGB values. Because the modeled fit is generally lower, the average AGB from the model for the lowest class will always be lower. The minimum field-based Njana value is ~31 Mg ha−1, very close to the average Lidar-based Njana values. This suggests that the models do a good job at representing the minimum values of the AGB, but do not capture some of the heterogeneity within the height class. Additionally, the lack of information regarding very tall trees (29 m−35 m) in the field calibration data will result in very high AGB values when extrapolated using a power regression model. The airborne Lidar and AGB datasets are available from the Oak Ridge.
4. Discussion
In this study we found that field and Lidar-derived height of the top 100 trees within a hectare (H100) can be used to estimate wall-to-wall AGB density ranges in mangroves of the Zambezi Delta. The Lidar H100 canopy height model was also very highly correlated to the corresponding field height measurements with a correlation coefficient of 0.93. The main driver behind the use of H100 from Lidar data in this study was to use a metric that could be comparable to current spaceborne elevation datasets such as SRTM, TanDEM-X (TDX) and very high resolution (VHR) stereo imagery, which can only measure the maximum canopy height or an equivalent thereof. These sensors, in combination with ALS, can enable the estimate of canopy height measurements across large regions. The use of multiple independent datasets (ALS, SRTM, TDX and VHR) has been used to accurately generate canopy height estimates (Lagomasino et al 2016) and in other forest types such as temperate and woodland forests (Næsset et al 2016, Qi and Dubayah 2016). Large-scale, wall-to-wall estimates of forest structure are currently not available from ALS alone due to the narrow swath and high costs associated with airborne data acquisitions; it is therefore important to use height metrics that are consistent and enable the comparison of forest canopy height metrics across and between sensors.
Our study shows that sensors and remote sensing techniques that are able to well characterize H100 in undisturbed mangrove systems such as the Zambezi are well suited to estimate total AGB density and subsequently C stocks. Using our method, the final mapped RMSE of the mapped AGB ranged between 23% and 33% which we suggest is within the required accuracy needed to implement MRV (monitoring, reporting and verification). Current MRV guidelines do not explicitly state accuracy requirements for remotely sensed AGB estimates, but AGB errors within 20 Mg ha−1 or 20% of field estimates have been recommended by previous studies for a global biomass map at 1 ha resolution (Houghton et al 2009, Hall et al 2011). In a 2013 review by Zolkos et al (2013) the mean AGB errors estimated by Lidar ranged up to 40% of the field measured biomass, with model error decreasing as plot size increased. None of these studies were carried out in mangrove systems, which are structurally very complex systems, despite their perceived simple structure. Indeed, their extensive aboveground root systems, high stocking density and varying growth forms, such as multiple-trunks, can lead to a great variability in plot-scale height measurements and biomass densities per a given height class, as exemplified by the large spread in biomass values in the Zambezi Delta (figure 5).
Although ALS is able to estimate canopy height at a cm accuracy level, there are still additional sources of uncertainties in our estimates, as the Lidar H100 metric does not capture structural and/or density variations. For example, all AGB models had RMSEs between 23% and 33% when compared to the validation dataset. The range in Lidar derived AGBs was much larger than in the field. This is due to the extrapolation of the field-based biomass regression to taller trees than were sampled in situ. Field sampled heights did not exceed 29 m, although the Lidar data showed that the maximum height in the surveyed area was 35 m. However, due to the stratified field sample protocol based on canopy height, the distribution of height classes and AGB densities, however, shows that only a small percentage (between 3% and 8%) of the total area has AGB densities over 700 Mg ha−1 (figure 5), and as such the areas of high uncertainty are limited to a few, very small areas.
Mangrove forests are often described as even-aged forest patches that follow patterns of species composition and forest structural zonation (Watson 1928, MacNae 1969). The height class distribution of Lidar data shows that within the limited 115 km2 area surveyed, canopy height varies, with a large range in heights, more representative of uneven-aged forests. The high structural variation found within the Lidar data also correlates well with the field-based stand structure analysis, which found that an abundance of small trees was representative of strong recruitment in all height classes and that the Zambezi Delta mangroves are regularly regenerating (Trettin et al 2015). The factors regulating the composition and structure of mangroves are highly complex and depend on a range of environmental factors such as salinity, nutrient availability, soil type, and disturbance regime, among others (Ellison 2002). Variations in these factors result in diverse patterns of forest structures, such as those found in the Zambezi Delta. The maximum canopy height in our area was 6 m taller than the SRTM-based estimate of maximum canopy height that was generated previously for all of Mozambique (Fatoyinbo et al 2008). The height class distribution also shows a much larger proportion of tall trees (> 15 m) than previous maps (Fatoyinbo and Simard 2013) have, primarily due to the ALS survey design, which was developed to cover the tallest area of the deltaic mangroves. The difference in height ranges between the ALS map and previous, SRTM-based map (Fatoyinbo and Simard 2013) can be attributed to resolution, differences in sensors (C-band Interferometry versus ALS) and 14 years between acquisitions.
The average AGB values calculated for the surveyed area are relatively high mean AGB values for mangroves in general, and for African mangrove forests in particular. Previous estimates of mean AGB found that the range of biomasses across the African continent (Fatoyinbo and Simard 2013) ranged from 76 Mg ha−1 to 178 Mg ha−1. The primary driver of the high AGB densities found in this analysis is the presence of very tall, dense stands in the most downstream island in the mouth of the Zambezi River Delta itself, where tree heights averaged over 30 m and field measured AGB densities were highest. River discharge has a direct and indirect influence on mangrove biomass allocation; riverine and deltaic mangroves are generally taller and have higher AGB values as a result of high nutrient availability and reduced soil salinity levels, which are strongly regulated by river discharge (Castañeda-Moya et al 2013, Rovai et al 2015). This results in taller trees, a larger extent of mangroves and higher C stocking densities. The difference in growing conditions is also highlighted in the regression model used to estimate AGB. Indeed, when comparing the Zambezi values to similar studies from the Americas, the slope of the model is much higher. In Colombia and Florida for example, it was found that AGB was approximately seven to ten times the value of forest canopy height (Simard et al 2006). Similarly, the global height-biomass regression by Saenger and Snedaker (1993) also found that AGB was about ten times the value of mean forest height. Here, AGB was about 30 times the value of the canopy height, showcasing the high stocking density in the Zambezi Delta.
In this study, we found high AGB stocks regardless of the allometry used. Nevertheless, our results do highlight the large range in values and uncertainty that accompanies each estimation methodology. The importance of characterizing and estimating AGB prediction errors from allometric model to landscape-scale has been highlighted in other tropical forest ecosystems (Chen et al 2015) as well as temperate forests (Zhao et al 2012). Here, we estimated AGB based on three different tree-based allometric models and two different regression-modeling approaches. Any of the resulting six Lidar AGB estimates had RMSE estimates of 30% or less, which would have been reasonable estimates by themselves. By providing multiple estimates, we are additionally able to provide a range and uncertainty in AGB values. Finally, two out of the three allometric models used in this study were not site- or even mangrove-specific and used wood density measurements from other continents. More accurate estimates can be generated by developing site-specific allometric models, or at the very least measuring site-specific wood density before developing or applying regional models relating remotely sensed metrics, such as H100 to an AGB value.
The allometric models based on standardized height metrics that were developed as part of this study can now be used in large scale AGB estimates in mangroves in similar geographic or geomorphic setting using other remotely sensed datasets that are more readily accessible than airborne Lidar. The Zambezi Delta studied here represented an ideal case to investigate methods in AGB modeling and trends in AGB distribution in a remote and relatively untouched forested wetland system where stocking densities and AGB values were high. However, given that a large proportion of mangroves are heavily impacted by human activities, we do recommend that the effect of disturbance and human activity on the relationships between standardized height and AGB be further investigated, so as to not bias larger scale estimates of AGB and subsequent C stocks in mangroves.
5. Conclusion
We used a combination of airborne Lidar, height-stratified field measurements and multiple allometric models to estimate the total AGB density of mangrove forests in the Zambezi Delta Region. Lidar-derived metrics of Lidar H100 canopy height coupled with in situ height and six AGB regression models showed that the mangrove forests in the Zambezi Deltaic system grow taller and with higher AGB densities than is indicated by previous studies. The Lidar H100 metric was a good representation of field H100, even though it only takes into account the tallest trees within a given area. Lidar H100 was also a good predictor of AGB density, able to estimate biomass stocks across the large range in values in the Zambezi Region. This ALS-based estimate of mangrove AGB showcased the possibility of generating aboveground ecosystem C stocks in mangroves in support of monitoring, reporting and verification (MRV), using simplified canopy height metrics with higher accuracies than for other tropical forest ecosystems. Our study suggests that it is also possible to expand aboveground C estimates to large-scale measurements, by upscaling to similar height metrics from current spaceborne sensors and digital elevation modeling techniques, such as interferometric synthetic aperture radar and stereo-photogrammetry. This result now lays the foundation for the development of continental-to-global scale mangrove biomass and C stock estimates.
Acknowledgments
This work was supported by the NASA Carbon Monitoring System (CMS) Grant #14 C MS14–28, the USDA-Forest Service and the USAID Sustainable Wetlands Adaptation Mitigation Program (SWAMP). We would also like to thank the anonymous reviewers for providing comments and corrections to the previous versions of this article. Data supporting this paper are available from the ORNL DAAC at http://doi.org/10.3334/ORNLDAAC/1521 and http://doi.org/10.3334/ORNLDAAC/1522.