

Abstract
Climate change will increase the number and severity of heat waves, and is expected to negatively affect crop yields. Here we show for wheat and maize across Europe that heat stress is considerably reduced by irrigation due to surface cooling for both current and projected future climate. We demonstrate that crop heat stress impact assessments should be based on canopy temperature because simulations with air temperatures measured at standard weather stations cannot reproduce differences in crop heat stress between irrigated and rainfed conditions. Crop heat stress was overestimated on irrigated land when air temperature was used with errors becoming larger with projected climate change. Corresponding errors in mean crop yield calculated across Europe for baseline climate 1984–2013 of 0.2 Mg yr−1 (2%) and 0.6 Mg yr−1 (5%) for irrigated winter wheat and irrigated grain maize, respectively, would increase to up to 1.5 Mg yr−1 (16%) for irrigated winter wheat and 4.1 Mg yr−1 (39%) for irrigated grain maize, depending on the climate change projection/GCM combination considered. We conclude that climate change impact assessments for crop heat stress need to account explicitly for the impact of irrigation.
Export citation and abstract BibTeX RIS

Original content from this work may be used under the terms of the Creative Commons Attribution 3.0 licence.
Any further distribution of this work must maintain attribution to the author(s) and the title of the work, journal citation and DOI.
1. Introduction
Climate change will increase the number and severity of heat waves (Gourdji et al 2013b, Schär et al 2004, Trnka et al 2014) which may negatively affect crop yields (Asseng et al 2015, Deryng et al 2014, Semenov and Shewry 2011). Heat stress has a number of negative effects on crop growth and can result in considerable yield losses in major cereals due to reduced photosynthesis, pollen sterility, kernel abortion and earlier senescence resulting in lower grain number (Rezaei et al 2015b) for both wheat (Porter and Gawith 1999) and maize (Rattalino Edreira et al 2011). Previous large scale assessments of the impact of heat stress on crop yields have been based on ambient air temperature Tair (°C) measured at 2 m height at standard weather stations or projected by climate models (Asseng et al 2015, Deryng et al 2014, Lobell et al 2015, Semenov and Shewry 2011) despite evidence suggesting that the temperature at the top of the crop canopy Tcan (°C) is more relevant (Gourdji et al 2013a, Pinto et al 2010, Siebert et al 2014). Tcan can deviate by more than 10 °C from Tair (Blad et al 1988, Durigon and van Lier 2013), even under temperate climate conditions (Siebert et al 2014). The difference between Tcan and Tair is largely determined by the vapor pressure deficit and other local weather conditions, canopy and crop properties and the soil water content (Webber et al 2016b). High rates of evapotranspiration can result in the cooling of the canopy beneath Tair, whereas crop canopies can be warmer than the air when evapotranspiration rates are low as can occur with drought (Siebert et al 2014). As a result, Tcan and corresponding heat stress can differ substantially between rainfed and irrigated agriculture (Durigon and van Lier 2013, Siebert et al 2014), particularly in arid regions (Kimball et al 2015). Despite the known cooling effect of irrigation (Boucher et al 2004, Lobell and Bonfils 2008, Puma and Cook 2010) and its probable role in reducing yield losses from high temperature (Carter et al 2016, Troy et al 2015, Pinto and Reynolds 2015), to our knowledge it has not been accounted for in climate change impact studies on crops considering heat stress.
The objective of the current study is to explicitly quantify the extent to which irrigation can reduce crop heat stress damage on grain yield under current and future climate change scenarios by using Tcan to simulate heat stress (Gabaldón-Leal et al 2016, Siebert and Ewert 2014, Siebert et al 2014) and the magnitude of the error made when Tair is used in climate impact assessments. The study simulates Tcan for maize and wheat under irrigated conditions across Europe for a historical period, 1984 to 2013, and with future climate projected by three GCMs for two RCPs for the periods 2036–2065 and 2064–2093
2. Methods
Daily maize and winter wheat growth and development were simulated across the EU27 for agricultural land at a spatial resolution of 25 km2 using the SIMPLACE (Gaiser et al 2013, Webber et al 2016a, Zhao et al 2015a) crop modeling framework. Simulations considered both water and heat limitation, but did not consider nutrient limitation. Four sets of simulations were conducted for each crop: (1) full irrigation with air temperature Tair (°C) as input to the heat stress module; (2) full irrigation with canopy temperature Tcan (°C) as input to the heat stress module; (3) rainfed conditions with Tair as input to the heat stress module; (4) rainfed conditions with Tcan as input to the heat stress module. These simulations were conducted for current land use in each simulation unit to estimate yield levels for a historical period centered on 1999, and two scenario periods centered on 2050 and 2079 using three different global climate model (GCM) and two representative concentration pathway (RCP) combinations.
Historical daily gridded climate data at 25 km spatial resolution for the baseline period (1984 to 2013) were obtained from the EC Joint Research Centre AGRI4CAST interpolated meteorological data (supplementary table 1, available at stacks.iop.org/ERL/12/054023/mmedia). Climate data (1975 to 2100) simulated by three GCMs (HadGEM2 E S, GFDL-ESM2M, GISS-E2 H ) with two RCPs (4.5 and 8.5) were obtained from the Earth System Grid Federation (supplementary table 1). The downscaling of GCM results to the resolution used in this study was implemented by adding simulated deltas (absolute for temperature and relative for precipitation, global radiation and wind speed) to the observed baseline climate data (Ruane et al 2015). Monthly deltas were calculated as the average change of each variable during the baseline period and two future periods, namely 2036–2065 and 2064–2093 (supplementary figure 1). Monthly deltas were interpolated to daily deltas using cubic splines.
Soil data from the derived soil layers of the European Soil Database (ESDB) (Hiederer 2013a, Hiederer 2013b) at a 1 km2 spatial resolution were masked to select only agricultural soils using the Corine Land Classification 2006 (supplementary table 1). These agricultural soil properties were aggregated to the 25 km2 climate grid cells by selecting the majority soil texture, and median soil depths and available water contents. Phenology observations were obtained from the JRC/MARS database (supplementary table 1) and aggregated to environmental zones (Metzger et al 2005) to calibrate SIMPLACE so that the sowing, anthesis and maturity dates in each simulation unit corresponded to historical average observations.
Implemented in SIMPLACE, the LINTUL5 (Wolf 2012) crop growth model and the LINTUL2 water balance model DRUNIR (Spitters and Schapendonk 1990), were coupled together with a canopy temperature model (Webber et al 2017, Webber et al 2016b) and a module to simulate the effects of high temperature on grain yield (Gabaldón-Leal et al 2016). Crop development rates were simulated as a function of daily temperature sums and requirements, and pre-flowering development for winter wheat were additionally moderated by photoperiod and a vernalization requirement, which varied with the local climate conditions (van Bussel et al 2015) (supplementary figure 2). Current sowing and harvest dates were applied for future climate conditions as well which assumed a complete adaptation of cultivars to climate change by modification of their temperature sum requirements (supplementary figure 3). Daily biomass growth was determined as the product of intercepted photosynthetically active radiation and radiation use efficiency, which was limited by water stress. The effects of atmospheric CO2 concentration on radiation use efficiency and transpiration rates were not considered. Radiation interception was determined using Beer's Law as a function of leaf area index (LAI). Initial LAI growth was exponential and limited only by temperature, whereas subsequent LAI growth was a function of the daily biomass allocated to leaves, specific leaf area, water stress, and leaf death. The soil water balance employed a one layer tipping bucket approach and crop evapotranspiration was computed using the Penman equation (1948). Initial soil water contents were reset at sowing each year. Default values of all parameters for the LINTUL models, except the thermal time requirements for phenological development, were from Boon-Prins (1993). SIMPLACE and the LINTUL models have been widely used in climate change impact assessment studies (Farre et al 2000, Webber et al 2015, Zhao et al 2015a, Zhao et al 2015b) as their relatively low parameterization requirements render them suitable for regional scale application (Adam et al 2011).
Canopy temperature was simulated with an energy balance for a cropped surface, including corrections for atmospheric stability using Monin–Obukhov Similarity Theory (MOST) (Monin and Obukhov 1954, Webb 1970). To avoid the need to calculate stomatal conductance, a simplification was used that Tcan varies linearly between daily upper and lower limits as a function of the crop water stress factor, equal to the ratio of actual transpiration to potential transpiration (Clawson et al 1989, , Webber et al 2017). Heat stress was estimated using the concept of stress thermal time (STT, °C h) (Blumenthal et al 1991). STT was simulated as the hourly temperature sum above a crop specific temperature threshold, 31 °C for wheat (Porter and Gawith 1999, Wheeler et al 1996) and 35 °C for maize (Sánchez et al 2014), during the most sensitive phase around flowering. The sensitive period for flowering and grain development was considered as starting when 75% of photo-vernal-thermal development to flowering was reached and ending when 25% of post-anthesis to maturity development was achieved. Grain yield was reduced by a constant reduction factor of 0.25% (Gabaldón-Leal et al 2016, Rattalino Edreira et al 2011) for each unit STT above the respective threshold temperature, following the the approach in APSIM (Lobell et al 2015). No heat stress effects were included on leaf senescence. The method used is described and evaluated in Gabaldón-Leal et al (2016). The heat stress module was used with each Tcan and then Tair as input.
3. Results
For historical climatic conditions, Tcan in irrigated agriculture very rarely surpassed the critical temperature thresholds of 31 °C for wheat (Porter and Gawith 1999) and 35 °C for maize (Sánchez et al 2014) (figures 1(b) and (d) during the respective growing periods. With projected climate change, irrigation would help to avoid crop heat stress in most regions of Europe, except of Southern Portugal, Southwestern Spain and the central parts of Greece where, even under irrigated conditions, STT increased considerably (figures 1(f) and (h); supplementary tables 2, 3). While STT increased in many regions, associated yield losses were smaller than 1% for most parts of Europe (supplementary tables 1, 2).
Simulations of crop heat stress in irrigated wheat and maize based on Tair resulted in higher estimates of STT (figure 1) and corresponding yield loss (figure 2) than those based on Tcan. Even for the baseline climate, a STT of 200 °C h and an associated yield reduction of 50% were simulated for parts of Greece (for both crops), Spain (for grain maize) and Portugal (grain maize). For most countries, STT simulated with Tair for the baseline climate was larger than STT simulated with Tcan for each of the future climate projections (supplementary tables 2, 3). Critically, errors made by using Tair instead of Tcan to calculate STT increased considerably for almost all regions under projected climate change (figures 1(e)–(h),
4. Discussion and conclusions
The cooling effect of irrigation investigated here is supported by other studies performed in largely irrigated areas of the United States (Carter et al 2016, Lobell and Bonfils 2008, Mueller et al 2016, Troy et al 2015), South Asia (Saeed et al 2013) or global assessments (Boucher et al 2004, Puma and Cook 2010). Many of these previous studies focused on the effects of irrigation on Tair and found that, in particular, daily maximum air temperature measured at weather stations located in regions with a high density of irrigated land was considerably reduced, often by more than 5 °C. In the present analysis, we account for the cooling effects of irrigation on crop heat stress and yield and show that because of the difference between Tair and Tcan (Kimball et al 2015), the irrigation cooling effect on crops is even larger than the impact on Tair (figure 1). In regions with a high share of irrigated land, the weather station observations of Tair used in the current study already reflect the cooling effect of irrigation and our simulations of crop heat stress under irrigated conditions consider the combined effect of irrigation on Tair and Tcan. In contrast, in regions which are currently predominantly rainfed, the Tair observations are probably higher than they would be if there were large areas of irrigation (Lobell and Bonfils 2008, Mueller et al 2016). As a result, the potential for irrigation to reduce crop heat stress in these areas may be underestimated in the present study. Accounting for the overall effect of irrigation on Tair and Tcan requires consideration of the horizontal and vertical vapor and heat exchange and associated feedbacks between temperature, VPD and canopy cooling, as well as of the spatial extent of irrigation, and warrants further research.
While high soil moisture contents maintained under irrigation, particularly when associated with high VPD, resulted in high transpiration of the crops and Tcan lower than Tair, drought can cause the opposite effect: reduced crop transpiration, a heating of the crop canopy and consequently, values of Tcan above Tair (Durigon and van Lier 2013, Siebert et al 2014). Therefore, in rainfed agriculture, the difference between Tair and Tcan can either become positive or negative, depending on the soil water content, crop height and the evaporative demand of the atmosphere (Blad et al 1988). STT under rainfed conditions and calculated with simulated Tcan was higher than STT calculated with Tair for many regions across Europe (supplementary figure 4). Consequently, patterns of heat stress calculated across Europe based on simulated Tcan differed considerably between irrigated conditions (figures 1 (b) and (d)) and rainfed conditions (supplementary figures 4 (b) and (d). In particular for Southern Spain and Greece, we identify large areas where STT calculated with Tcan simulated for rainfed conditions has been higher than 200 °C h under baseline climate (supplementary figures 4 (b) and (d), while little heat stress is visible when using Tair (supplementary figures 4(a) and (c). Similarly, in an analysis of historical rainfed and irrigated yields of a number of crops, Troy et al (2015) demonstrated the role of irrigation in minimizing yield losses associated with hot days and dry spells, as compared to yield losses for rainfed systems, in the High Plains region of the US. In the current study, under projected climate change, STT is further increased for rainfed conditions (supplementary figures 4(e)–(h)).
Under baseline climate, the difference between yields simulated with Tair and yields simulated with Tcan was surprisingly small, in particular for maize (supplementary figures 5 (b) and (d) despite of large differences in heat stress simulated for Southern Europe (supplementary figures 4(a)–(d). Because of drought stress, very low rainfed crop yields were simulated in parts of Southern Europe additionally affected by heat stress (supplementary figures (4) and (5). Therefore it is not surprising, that grain maize grown presently in these regions is mainly irrigated (supplementary figures 5). Average rainfed wheat yields simulated for Southern Europe with Tcan were 0.5–1 t ha−1 lower than yields simulated with Tair implying that episodes of soil water stress led to heat stress in wheat that was not captured when considering Tair. This pattern of underestimating heat stress in rainfed wheat in Southern Europe if Tair was used in simulations increased under projected climate change. However, in large regions of Northern and Central Europe, the difference between rainfed crop yields simulated with Tair and rainfed crop yields simulated with Tcan was negative (supplementary figures 5 (f) and (h)), which indicated predominantly cooling of the crop canopy in these regions due to adequate soil moisture conditions on average associated with increased precipitation under climate change.
The difference between Tair and Tcan is the result of interplay between many factors. However, the expected range in the difference of STT calculated based on Tair versus Tcan, ΔSTTTair,Tcan (°C h), was approximated across Europe as a function of the mean of the daily maximum temperature  (°C) in the period April to June (winter wheat) or June to August (grain maize). The difference ΔSTTTair,Tcan was low for regions with a smaller than 20 °C (winter wheat) or 25 °C (grain maize), mainly because STT was low with either Tair or Tcan for these temperatures (supplementary figure 6). When was larger than 30 °C, we found in general a positive difference ΔSTTTair,Tcan for irrigated crops and for most grids a strong negative difference ΔSTTTair,Tcan for rainfed crops (supplementary figure 6). Under projected climate change, in both periods considered is increasing and the range between the 5th and 95th percentile of ΔSTTTair,Tcan increases (supplementary figure 6).
The large differences between heat stress simulated with Tair and Tcan, which are shown to increase under projected climate change, suggest that climate change heat stress impact assessments on crop yields should be based on Tcan. Since simulation of Tcan is complex, a preliminary improvement for large scale models might be to proceed with using Tair but to adjust the critical temperature thresholds for crop heat stress (Barlow et al 2015, Siebert et al 2014). As discussed in Gabaldón-Leal et al (2016), for irrigated crops, these thresholds should in general be higher than thresholds established in pot experiments to account for the canopy cooling by crop transpiration, but this threshold will vary with the general evaporative conditions. In contrast, no general recommendation can be made for rainfed crops for which the threshold temperature should be decreased under drought and increased for no drought conditions.
The analysis of the impact of irrigation on crop heat stress under climate change required making a number of significant assumptions. Sowing and harvest dates of the two crops under projected climate change were assumed to be similar to the observations made under the baseline climate. This represents a compromise between a scenario in which cultivars are considered static which would result in a shortening of the cropping season in response to the projected warming trend (no adaptation) and a scenario in which very late ripening cultivars were introduced to extend the cropping season similar to the expected extension of the potential growing season (over-adaptation). Historical changes in crop phenology point to trends towards earlier sowing, earlier harvest and a shortening of the period between sowing and harvest for both crops, winter wheat and maize, grown in Germany and Spain (Estrella et al 2007, Oteros et al 2015, Rezaei et al 2015a). In contrast, a modeling study suggested that an extension of the generative phase would be beneficial under projected climate change for winter wheat grown in Denmark (Montesino-San Martin et al 2014). A further limitation is that impacts of rising CO2 concentration on crop heat stress are not considered. While there is growing evidence that biomass production and transpiration efficiency increase in response to elevated CO2 concentration for C3 crops like winter wheat (Zhao et al 2015b), effects on crop heat stress were shown to be diverse (Manderscheid et al 2016). Finally, the study considered only one crop model, whereas various studies (Asseng et al 2013, Bassu et al 2014, Martre et al 2015) demonstrate the uncertainty in climate change impact across crop models. However, due to the well documented (Durigon and van Lier 2013, Lobell and Bonfils 2008) physical basis of the cooling effect of high transpiration rates (Monteith and Unsworth 2013), it is expected that repeating the simulation exercise in other crop models would not change the general conclusions for irrigated conditions. For rainfed conditions, conducting the study with multiple crop models is recommended, due to the uncertainty in simulated rates of water use by crop models (Bassu et al 2014, Cammarano et al 2016, Webber et al 2016a) and its importance in determining canopy temperature (Jackson et al 1981). Additionally, the interactions between soil water availability, transpiration, leaf area and water stress should be investigated to understand the resulting sensitivity of Tcan simulations to LAI.
Opportunity for model validation at the European scale is limited, as most yield statistics report combined irrigated and rainfed yields. However, for Spain separate irrigated and rainfed data are available and we compared irrigated maize yield observations from MAGRAMA (1986–2016): Anuario de Estadística Agraria. Ministerio de Agricultura, Alimentación y Medio Ambiente (www.mapama.gob.es/es/estadistica/temas/publicaciones/anuario-de-estadistica/) with our simulated yields using Tcan and Tair aggregated to the subnational NUTS2 administrative regions of Spain (supplementary figure 7). In regions where STTirrigated calculated using Tair often exceeded 100 °C h−1 in Southern Spain (figure 1(c)), simulations with Tcan had greater correlations with observations than the yields simulated using Tair, which often had insignificant correlations. The time series plots illustrate how the simulations considering Tair show greater variation than the observations or the simulations with Tcan as evaporative cooling is neglected. In regions with low values of STTirrigated there was little difference in the correlation coefficients between Tcan and Tair as no heat stress would be simulated, as was the case for wheat. In the current study under projected climate change, STT is further increased for irrigated production (supplementary figures 1(e) and (g)) suggesting this error will be more widespread as more regions and crops are affected. Comparing the magnitude of heat stress impacts for simulations with Tcan and Tair illustrate the potential of increasing the extent of irrigation in the future to be beneficial to mitigate heat stress, in particular for Southern Europe. Assessing the future potential for irrigation under the constraints of scarce water resources requires further study.
In conclusion, this modelling study confirmed that irrigation is a promising measure to minimize crop heat stress under current climates, and to the best of the authors' knowledge, was the first study to quantify the potential of irrigation to mitigate heat stress effects under projected future climates at a European scale. Assessments of the impact of climate change on crop heat stress should be based on canopy temperature, which varies considerably between rainfed and irrigated conditions.
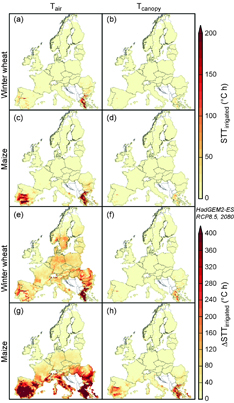
Figure 1 Heat stress intensity around anthesis (STT) simulated for baseline climate (a)–(d) and change of STT under future climate projected by the climate model HadGEM2 E S under emission scenario RCP8.5 for period 2070–2100 (e)–(h) for irrigated winter wheat and irrigated grain maize when using air temperature (a), (c), (e) and (g) or canopy temperature (b), (d), (f) and (h). STT represents the sum of hourly maximum temperatures >31 °C (wheat) or >35 °C (maize).
Download figure:
Standard image High-resolution image
Figure 2 Yields of wheat and grain maize simulated for baseline climate (a) and (c) and for projected future climate (e) and (g) based on simulated canopy temperatures in heat stress routines for irrigated agriculture (YieldCanopy T), difference in yields simulated with air temperature and canopy temperatures (ΔYieldAir-Canopy T) for baseline climate (b) and (d) and projected future climate (f) and (h), difference between yields simulated for baseline climate and projected future climate based on canopy temperatures (ΔYieldCanopy T) for wheat (i) and maize (k), and change in the difference in yields simulated with air temperature and canopy temperatures caused by projected climate change (ΔΔYieldAir-Canopy T) for winter wheat (j) and grain maize (l); the future climate shown here was projected by the climate model HadGEM2 E S under emission scenario RCP8.5 for period 2070–2100. Hatching is used to delineate regions in which the majority of the crop area is presently irrigated.
Download figure:
Standard image High-resolution image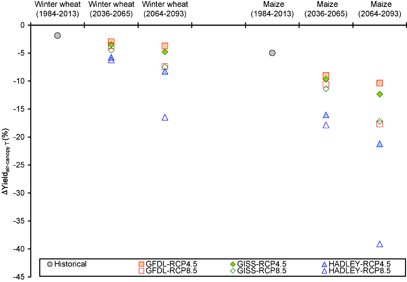
Figure 3 Difference between yields simulated across Europe based on air temperature Tair (°C) or canopy temperature Tcan (°C) for irrigated winter wheat and irrigated maize for historical climate and future climate projected for periods 2036–2065 and 2064–2093 by the global climate models GFDL-ESM2M, GISS-E2 H , and HadGEM2 E S for the emission scenarios RCP45 and RCP85. Mean yields across Europe were calculated by weighing yields simulated per NUTS2-region with the respective growing areas of irrigated winter wheat and irrigated maize, where NUTS2 are sub-national administrative regions (see http://epp.eurostat.ec.europa.eu/portal/page/portal/nuts_nomenclature/introduction).
Download figure:
Standard image High-resolution image
Acknowledgments
S S and F E acknowledge funding by the German Science Foundation (project EW 119/5-1). H W, F E and G Z contributions were funded by the German Federal Ministry of Education and Research (BMBF, grant number 01LG1202A) through WASCAL (West African Science Service Center on Climate Change and Adapted Land Use). FE also acknowledges support from the FACCE JPI MACSUR project (031A103B) through the German Federal Ministry of Food and Agriculture (2812ERA115). G Z received support from the 'Limpopo Living Landscapes' project within the SPACES programme funded by the German Federal Ministry of Education and Research (BMBF, grant number 01LL1304A).