

Abstract
In the face of climate change, predicting and understanding future fire regimes across Canada is a high priority for wildland fire research and management. Due in large part to the difficulties in obtaining future daily fire weather projections, one of the major challenges in predicting future fire activity is to estimate how much of the change in weather potential could translate into on-the-ground fire spread. As a result, past studies have used monthly, annual, or multi-decadal weather projections to predict future fires, thereby sacrificing information relevant to day-to-day fire spread. Using climate projections from the fifth phase of the Coupled Model Intercomparison Project (CMIP5), historical weather observations, MODIS fire detection data, and the national fire database of Canada, this study investigated potential changes in the number of active burning days of wildfires by relating 'spread days' to patterns of daily fire-conducive weather. Results suggest that climate change over the next century may have significant impacts on fire spread days in almost all parts of Canada's forested landmass; the number of fire spread days could experience a 2-to-3-fold increase under a high CO2 forcing scenario in eastern Canada, and a greater than 50% increase in western Canada, where the fire potential is already high. The change in future fire spread is critical in understanding fire regime changes, but is also imminently relevant to fire management operations and in fire risk mitigation.
Export citation and abstract BibTeX RIS

Original content from this work may be used under the terms of the Creative Commons Attribution 3.0 licence. Any further distribution of this work must maintain attribution to the author(s) and the title of the work, journal citation and DOI.
Corrections were made to this article on 11 September 2017. The supplementary appendices were loaded.
1. Introduction
There is a broad consensus that climate change during the next century will have major impacts on Canada's temperate and boreal forests (Price et al 2013), in part through changes in disturbance regimes (Flannigan and Van Wagner 1991, Boulanger et al 2014). Of particular concern are the effects of changes in the frequency and intensity of extreme disturbance events such as large wildland fires (Settele et al 2014) that can strongly influence vegetation structure, pattern, and species composition. Indeed, recent research suggests that wildland fire activity has already increased throughout much of North America in recent years, both in terms of number of fires and area burned (e.g. Gillett et al 2004, Kasischke and Turetsky 2006, Dennison et al 2014, Abatzoglou and Williams 2016). These increases have been occurring despite stable or increasing fire suppression effectiveness (Flannigan et al 2016), suggesting anthropogenic influences on fire activity via climate and land-use change.
Wildland fire activity is controlled by a number of factors including flammable biomass, weather, topography, and ignition sources. Weather variables such as temperature, precipitation, wind, and atmospheric moisture are the key drivers of inter and intra-annual variation in fire activity (Abatzoglou and Kolden 2013) and have a dominant influence during extreme fire years (Moritz 2003, Gedalof et al 2005). Weather affects fuel moisture and flammability at hourly to daily temporal scales, whereas its long-term manifestation, climate, determines the type and amount of flammable biomass (fuel) at a given location (Bradstock 2010).
Early projections of future fire regimes in Canada used monthly and season-averaged changes in weather variables (e.g. temperature, relative humidity, wind speed, and 24 h precipitation and associated Fire Weather Index System values) to forecast broad-scale wildfire patterns under climate change (e.g. Flannigan et al 2005, Balshi et al 2009, Littell et al 2009). However, monthly, annual, or multi-decadal averages may mask important changes in fire weather extremes, particularly for those conditions that affect fire size (e.g. Anderson 2010, Finney et al 2011). For example, similar amounts of fire-season precipitation can lead to widely different patterns of fire danger severity if they occur in small amounts regularly through a fire season, rather than in larger amounts interspersed with long periods of drought. In contrast, measures of daily fire spread potential that better account for weather patterns (e.g. rain-free periods) and fuel flammability may provide a more accurate assessment of fire-conducive conditions and a different perspective on the magnitude of present and future extreme fire weather conditions (Wang et al 2015). Although impacts of climate change on extreme weather events such as drought (Dai 2012, Dennison et al 2014), heavy rainfall (Fowler et al 2007), and windstorms (Blennow and Olofsson 2008) have received some attention, the impacts of climate change on fire weather extremes are poorly understood (but see Abatzoglou and Kolden 2013, Finney et al 2011, Anderson 2010). This has been due in part to difficulties in obtaining and processing future daily fire weather data.
In Canada, large fires (e.g. 10 to 104 km2) are relatively infrequent, but are responsible for the vast majority of the total area burned (Stocks et al 2002). Some large fires may burn for a long period of time (weeks or months) until a substantial rain event occurs (Latham and Rothermel 1993). Regardless of how long a fire burns, a large proportion of area burned occurs on a relatively few days of extreme fire weather (e.g. Rothermel et al 1994), termed 'spread days' (Parisien et al 2005, Podur and Wotton 2011, Wang et al 2014), during the life of a fire. In the temperate and boreal forests of Canada significant 'spread days' are associated with crown-fire type fire behavior, which typically has head fire spread rates in the order of 1.2–6.0 km hr−1 (Alexander and Cruz 2011). While there can be no days when a fire is not spreading at all (it would be extinguished), days with negligible spread are characterized by surface fire type behavior with head fire rates typically less than 0.3 km hr−1.
Following Wang et al (2014), we distinguish two types of spread days: 1) weather-based potential spread days (PSD) corresponding to hot, dry, and windy conditions that are likely to result in significant fire spread (Podur and Wotton 2011) should a fire occur, and 2) realized spread days (RSD) during which spread is observed on active fires (Wang et al 2014). In our approach, PSD are conditional on the joint occurrence of: a) a drying period where fuel moisture is expected to support fire ignitions and survival, b) simulated potential ignitions, and c) extreme fire weather (i.e. hot, dry, and windy) (e.g. Alexander and Cruz 2011, Van Wagner 1977). RSD are conditional on the joint occurrence of: a) an active fire, b) extensive fuels to support fire spread, and c) extreme fire weather. Extreme fire weather, therefore, might not result in a realized spread day due to either a lack of flammable biomass, a geographic impediment to spread, successful fire suppression, or simply lack of ignitions (Finney et al 2009, Gavin et al 2006, Parks et al 2012), and so RSD are usually less than PSD in any geographic region. It is important to note that PSD and RSD are measures of the number of days suitable for active fire growth within the potential or observed lifetime of a fire, for potential and active fires, respectively, not the total number of suitable spread days within a fire season. In this way, the number of spread days during a burning period or fire can be considered analogous to the number of goals scored by a hockey team during a game. It is not the total number of goals scored throughout a season that gets a team to the playoffs; it is the number of goals scored in a given game (resulting in wins in a season) that determines the outcome. This is because fires are discrete events that are more strongly influenced by conditions during the event frame than by seasonal averages or totals.
The goal of this study was to evaluate the impact of climate change on fire spread days, using homogeneous fire regime zones (Boulanger et al 2012) as analysis units, and a multi-model ensemble approach to estimate changes in spread day frequency over time. We first calculated the baseline and future number of PSD from multiple global circulation models (GCMs) and CO2 forcing scenarios and, then, estimated changes in RSD using PSD‐RSD link functions (Wang et al 2014) to correct for the PSD-based over-estimation of actual spread days. This approach assumes that the current relationship between potential and realized spread days will remain unchanged in the future. Although this and other assumptions are reasonable simplifications, their implication for modeling future fire activity in Canada will be more fully explored in the discussion section.
2. Methods
2.1. Study area
The study area encompasses the predominantly forested portion of Canada as defined by the Ecological Stratification Working Group (ESWG 1996, figure 1). Climates in the study area can be broadly characterized as having long, cold winters and short, warm summers, although climates in areas adjacent to the Pacific and Atlantic coasts and the Great Lakes are relatively mild. Mean annual temperature generally decreases northward, whereas annual precipitation is lower in the center of the continent than in the coastal areas. The study area covers three major biomes: temperate coniferous forests (west coast), temperate broadleaf and mixed forests (east coast and Great Lakes area), and boreal forests (central Canada and north of the two other biomes). We used the 16 homogeneous fire regime zones (hereafter, 'fire zones'; figure 1) developed by Boulanger et al (2012) as analysis units. Fire regime zones are more relevant to the examination of shifting fire weather than larger ecozones (ESWG 1996) as they better represents unique combinations of weather and fuel. An area north of 54 °N in Ontario was excluded from this zonation by Boulanger et al (2012) because of missing fire data, and was thus excluded from our analysis as well.

Figure 1 Homogeneous fire zones of Canada (Boulanger et al 2012). Figure reproduced from Wang et al (2014).
Download figure:
Standard image High-resolution image2.2. Determining baseline and future PSD and RSD frequency distributions
Baseline and future PSD and RSD were estimated following an eight-step process illustrated in figure 2.
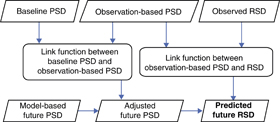
Figure 2 Flowchart of predicting future realized spread days (RSD) distribution based on potential spread days (PSD) distribution. Because the model-based future PSD distributions underestimate the length of drought events, they were adjusted by the observation-based PSD with a link function following Wang et al (2014). Taking the adjusted future PSD as input, the link function between observation-based PSD and RSD were used to predict the future RSD.
Download figure:
Standard image High-resolution image2.2.1. Interpolated baseline fire weather and PSD
Baseline fire weather elements (i.e. daily noon temperature [temp], relative humidity [rh], wind speed [ws], and 24 h precipitation [prec]) were obtained from an interpolated 3-km resolution daily fire weather raster product created from historical surface weather observations between April 1 and September 30 from 1981 to 2010 (Wang et al 2015a). These data were used to calculate Canadian Fire Weather Index (FWI) System variables using the R function 'fwi' from the R package cffdrs (Wang et al 2017) for the fire season. In the calculation, the standard initial fire season start values represent approximately three days of springtime drying of the soil starting from full saturation (Turner and Lawson 1978). In order to reduce spatial autocorrelation in weather data, we randomly sampled points that were at least 60 km apart from the 3 km daily fire weather raster product. In total, 567 sample points were used to determine the PSD frequency distributions in the fire zones.
Potential spread days (PSD) were defined as the number of days when the daily FWI exceeded 19, following a potential fire ignition, during a potential burning period (not simply the number during fire season). PSD were simulated as follows:
- The Duff Moisture Code (DMC) of the FWI System (Van Wagner 1987) is a measure of the moisture content and flammability of the upper forest floor organic layer that is important to sustain crown fires; it integrates the influence of precipitation, temperature, and relative humidity on wetting and drying of this fuel layer (Flannigan et al 2016). We assumed that fires can ignite, survive and spread when DMC >20; this criterion defines the potential burning period. Canadian fire seasons are characterized by a series of drying and wetting cycles; the DMC increases during rain-free periods and falls when precipitation exceeds 1.5 mm. We used the DMC >20 threshold to estimate the start and end of burning periods within annual fire weather streams.
- We further assume that fire ignitions can occur on any day during a burning period and will extinguish at the end of the burning period (DMC <20). We carried out a simple Monte Carlo simulation to randomly 'ignite' and then 'extinguish' hypothetical fires during the burning periods. Effective PSD were then counted as those days with FWI ≥19 between the potential fire ignition and extinguishment dates. For each fire zone, 50 000 events were simulated, which resulted in an equal number of simulated PSD points that were later used to create PSD frequency distributions for each fire zone.
2.2.2. Observed baseline fire weather and PSD
Daily noon (local standard time) weather observations from April 1 to September 30 for the period 2001–2014 were also obtained from 425 Environment Canada synoptic weather stations. Because stations are unevenly distributed throughout the study area, with a decreasing density towards the north, and because station data record lengths vary, one station within a 100 km radius with the longest record was selected to obtain a more equal number of weather stations among fire zones; if stations had the same data record length, the selection was made from a random draw. A resulting 171 stations were retained for analysis. FWI System variables and the PSD frequency were calculated as in the previous step.
2.2.3. Baseline—observed PSD link function
We found that PSD calculated from interpolated weather data (Step 1) had fewer extreme counts (appendix A, figure S1 available at stacks.iop.org/ERL/12/025005/mmedia) than did PSD calculated from weather station observations (Step 2 ), likely due to the effect of spatial smoothing reducing the number of high wind speed and zero precipitation days. Thus future RSD distributions would be underestimated if the baseline PSD were used directly for the predictions (results not shown). In order to correct this, we built linear conversion functions between the model-based baseline PSD and observation-based PSD in each fire zone following the approach used in Wang et al (2014) (appendix A, table S1) and adjusted the interpolated baseline PSD distributions to conform to the observation-based PSD distributions.
2.2.4. Observed RSD
Data used to generate observed RSD distributions came from two sources: (1) the Canadian National Fire Database (NFDB, Canadian Forest Service, 2015) between 2001 and 2014, which contains fires ≥200 ha; and (2) Moderate Resolution Imaging Spectroradiometer (MODIS6) fire detection data (hotspots) for the above mentioned large fires between 2001 and 2014. Following Parks (2014), we delineated the daily fire spread for fires ≥200 ha in the study area using MODIS hotspots. We computed daily burned area and constrained the final modeled fire perimeters to be the same as those in NFDB. Within a fire perimeter, fire progression was mapped for every burning day at a 30 × 30 m resolution. The method used to distinguish spread vs non-spread days followed Wang et al (2014). We summed the number of spread days for each fire between 2001 and 2014. The distributions of spread days were then generated for all fire zones.
2.2.5. Link function between observation-based PSD and RSD
We also developed linear conversion functions between the corrected interpolation-based baseline PSD (Step 3) and the observed RSD (Step 4) in each fire zone following the same approach as in Wang et al (2014) (appendix A, table S2) assuming an exponential distribution for both (see also appendix A).
2.2.6. Model based future PSD
Future PSD were determined in a three-step process.
- Three GCMs and three CO2 forcing scenarios were selected from those included in the fifth phase of the Coupled Model Intercomparison Project (CMIP5; Taylor et al 2012). CMIP5 involves modeling future climate scenarios through a series of Representative Concentration Pathways (RCPs), which are scenarios of combined land use and concentrations of aerosols and greenhouse gases; different combinations result in different radiative forcing levels (van Vuuren et al 2011). Four levels of end-of-century radiative forcing are modeled: RCP 2.6, RCP 4.5, RCP 6.0, and RCP 8.5, where the number represents forcing in W m−2. We selected RCP 2.6, RCP 4.5, and RCP 8.5 from three different General Circulation Models (GCMs), namely CanESM2, HadGEM2-ES, and CSIROMk3-6-0 for our study. These three GCMs were chosen using a best-performance selection method similar to that described by Perkins et al (2007). In this method, we calculated model skill scores from GCM and Reanalysis II (Mesinger et al 2006) probability density functions within Canadian ecozones (ESWG 1996) for maximum temperature, minimum temperature and precipitation. Using these skill scores we determined that the above-mentioned three GCMs performed best over Canada.
- Monthly data from the above models and scenarios were downloaded for 1976 to 2100 (or 2099 in the case of HadGEM2-ES) and used to generate the monthly mean temp, prec, rh, and ws variables over 30-year time periods. We chose 1976–2005 as the reference period because many models did not go beyond 2005. For future projections, we used the following time-periods: 2020s (2011–2040), 2050s (2041–2070), and 2080s (2071–2099/2100). We then downscaled these monthly means to the 567 sampled points in the interpolated baseline weather set (Step 1) using an ordinary kriging method (Cressie 1993, Pebesma 2004).
- We generated monthly anomalies for temp, rh, and ws at the 567 sampled points by subtracting the modeled historical data from each of the future projection periods. For prec, the monthly anomalies were calculated as ratios, which were derived by dividing each future projection periods by the back projections. The resulting temp, rh, and ws anomalies were added to the interpolated baseline daily weather variables 2 (Step 1) for each year between 1981 and 2010 by month. For precipitation, the monthly anomalies (ratios) were multiplied to the daily precipitation in the baseline in the same manner as the other three variables. In total (30 years × 3 GCMs × 3 RCP scenarios × 3 time periods + 30 year baseline) 840 years of daily fire weather data, each year containing 4 weather variables, were generated for each sample point. FWI System values were calculated and used to determine PSD frequency distributions for the 10 cases as in Step 1. In total, we simulated ((3 GCMs × 3 scenarios × 3 time periods) + 1 baseline + 1 weather observations) × 16 fire zones = 464 PSD distributions, with both the modeled and observed fire weather data, namely the model-based PSD and observation-based PSD distributions.
2.2.7. Adjusted future PSD
Future PSD frequency distributions (Step 6) were adjusted using the baseline‐observation based link function (Step 3) to correct for the reduction of extremes in the interpolated grid data.
2.2.8. Predicted future RSD
Finally, baseline and future RSD frequency distributions were estimated by applying the observation-based-PSD-observed-RSD link function (Step 4) to the corrected baseline (Step 3) and adjusted future PSD data (Step 8). We compared the predicted maximum RSD with the observed maximum RSD in the baseline, and it showed that the maximum RSD were well predicted (appendix B); therefore, no correction was required.
2.2.9. Change Analysis
These analyses were intended to examine the magnitude of change of spread days (predicted RSD) through time across fire zones in Canada.
2.2.10. Shifts in spread days over time
Because the distributions of spread days are highly skewed (Wang et al 2014), both the median and the 95th percentile (95PCT) were used to measure the shifts of the spread days distributions and changes in extreme fire weather (i.e. long periods of fire conducive condition). Ratios between medians were calculated to measure the shifts; differences of the 95th percentiles between future time periods and the baseline were used to quantify the extent of extreme fire weather changes. An ensemble approach was applied to summarize the overall changes across GCMs by scenarios and time periods.
2.2.11. Effect size of climate change
Changes in the spread days are influenced by the choice of GCM, CO2 forcing scenario, and future time period (e.g. figure 3). To evaluate the effects of climate change on fire-conducive weather conditions, we performed a mixed-model analysis of variance (Zuur et al 2009) on the median ratio and extreme fire weather changes (i.e. differences in 95PCT between future time periods and the baseline) for the spread days. Fire zone was considered a random effect, and GCM, CO2 emission scenario (SCN), and time periods (TP) were fixed effects. We partitioned the effect sizes among TP, GCM, and SCN, as well as their interactions by dividing the partial sum-of-squares with their total. A larger effect size attributable to a factor indicated a stronger influence of the factor to the changes of the dependent variables, i.e. median ratio and differences in 95PCT.
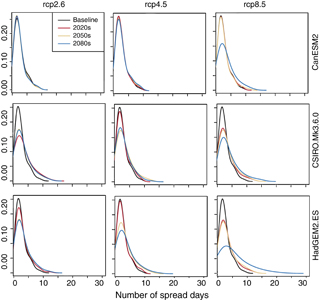
Figure 3 Kernel density curve of the realized spread days in the South Prairies zone by 3 GCMs (CanESM2, HadGEM2-ES, and CSIROMk3-6-0) and 3 CO2 emission scenarios (RCP2.6, RCP4.5, and RCP8.5).
Download figure:
Standard image High-resolution image3. Results
3.1. Shifts in spread day frequency distributions
Both PSD and RSD frequency distributions were highly skewed, with long tails in some fire zones (figure 3). Substantial increases in the ratio of future-to-baseline median RSD (e.g. >1.5) averaged across all GCMs and emission scenarios were observed in southern Canada (e.g. fire zones Southern Cordillera (SC) and Eastern Temperate (ET)) in the 2020s, spread to the west coast (P) in the 2050s, and to the two northern zones (Great Slave Lake (GSL) and Western Subarctic (WS)) and a southern zone (Lake Winnipeg (LW)) in the 2080s (figure 4; appendix C, table S1). The southern zones were the first to experience a substantial increase in predicted future spread days. The smallest shifts occurred in fire zones in and east of the Rocky Mountains (Interior Cordillera (IC), Great Bear Lake (GBL), and Southern Prairies (SP)), as well as the northeastern zones (figure 4). Although the RSD/PSD ratios vary by zone, the average increment of spread days over time also depends on the magnitude of the baseline median. For example, although the median ratios in the GSL zone are not the largest in any of the scenarios, the absolute increase in median spread days was always among the largest (table 1). Fire zones SC and WS also showed absolute increases >1 in the median number of spread days in most of the scenarios.

Figure 4 Ratio of future to baseline median RSD for each fire zone and time period, averaged across all GCMs by CO2 forcing scenario.
Download figure:
Standard image High-resolution imageTable 1. The difference in the median number of spread days between future time periods and the baseline, averaged across the three GCMs used in this study by fire zones and CO2 emission scenarios.
| rcp 2.6 | rcp 4.5 | rcp 8.5 | ||||||||
|---|---|---|---|---|---|---|---|---|---|---|
| Fire Zone | Baseline median | 2020s | 2050s | 2080s | 2020s | 2050s | 2080s | 2020s | 2050s | 2080s |
| ES | 2 | 0.2 | 0.2 | 0.4 | 0.1 | 0.4 | 0.5 | 0.1 | 0.3 | 1.2 |
| GSL | 5 | 1.1 | 1.4 | 0.7 | 1.1 | 1.8 | 2.2 | 1.1 | 2.1 | 4.7 |
| SC | 3 | 0.6 | 2.8 | 1.4 | 2.6 | 1.2 | 2.5 | 1.6 | 2.5 | 2.7 |
| LW | 2 | 0.5 | 0.5 | 0.4 | 0.2 | 0.6 | 1 | 0.4 | 0.9 | 2.6 |
| ET | 1 | 0.7 | 0.5 | 0.3 | 0.5 | 0.7 | 0.7 | 0.5 | 0.8 | 0.9 |
| LA | 2 | 0.0 | −0.1 | 0.0 | 0.0 | 0.0 | −0.2 | 0.0 | 0.1 | 1.2 |
| EJB | 1 | 0.0 | 0.0 | 0.0 | 0.0 | 0.2 | 0.5 | 0.0 | 0.3 | 0.6 |
| IC | 2 | 0.1 | −0.1 | −0.1 | −0.2 | 0.1 | 0.2 | 0.1 | 0.2 | 0.8 |
| WO | 1 | 0.0 | 0.0 | 0.0 | 0.0 | 0.0 | 0.0 | 0.0 | 0.0 | 0.6 |
| WS | 3 | 0.9 | 0.3 | 0.6 | 0.5 | 1.1 | 1.8 | 1.0 | 1.9 | 3.6 |
| GBL | 3 | −0.1 | 0.1 | −0.2 | 0.2 | 0.1 | 0.3 | −0.1 | 0.3 | 1.4 |
| WJB | 2 | 0.1 | 0.1 | 0.0 | 0.0 | 0.1 | 0.6 | 0.1 | 0.1 | 1.4 |
| SY | 2 | 0.0 | 0.0 | 0.1 | 0.0 | 0.1 | 0.1 | 0.0 | 0.1 | 0.7 |
| NA | 2 | 0.0 | 0.0 | −0.2 | −0.3 | 0.1 | 0 | −0.4 | 0.0 | 0.4 |
| SP | 2 | 0.1 | 0.1 | 0.1 | 0.0 | 0.2 | 0.3 | 0.1 | 0.2 | 1.4 |
| P | 1 | 0.3 | 0.2 | 0.1 | 0.0 | 0.7 | 0.8 | 0.3 | 0.8 | 1.2 |
The differences in the 95PCT of RSD increased substantially through time for all fire zones in the higher CO2 forcing scenarios (i.e. RCP 4.5 and RCP 8. 5) (figure 5), ranging between −1.7 (East James Bay (EJB))–11.0 (SC) days in the 2020s, 0.0 (EJB)–12.0 (SC) days in the 2050s, and 2.0 (EJB)–20.7 (Lake Athabasca (LA)) days in the 2080s (appendix C, table S2). The lower CO2 forcing scenario (i.e. RCP 2.6) didn't show a strong temporal increasing trend (appendix D), where the 2080s increments were lower than those in the 2020s and/or 2050s for all fire zones (appendix C, table S2). Spatially, these differences tend to increase from south to north with the exception of the west coast area, where the increase in 95PCT RSD was higher in SC than in zones to the north of it (figure 5).

Figure 5 Differences in the 95th percentile values of spread days between baseline and future time periods, averaged across all GCMs by CO2 emission scenarios.
Download figure:
Standard image High-resolution image
Overall, no strong spatial trends were evident in the above two metrics considered in this study: the ratio of median between future time period and baseline and the difference of 95PCT. Across all scenarios and for both metrics, projected changes in RSD were relatively large in the Pacific (P), Great Slave Lake (GSL), Eastern Subarctic (ES), and Southern Cordillera (SC) zones. In contrast, projected changes were relatively low in the Northern Atlantic (NA), East James Bay (EJB), Great Bear Lake (GBL), Southern Prairies (SP), and Southwestern Yukon (SY) zones. The Eastern Temperate zone (ET) showed a high median ratio, but only a moderate change in predicted 95PCT.
3.2. Mixed effect models
The effect sizes of GCM, CO2 forcing scenarios, and time periods did not vary substantially with the two different dependent variables, median and 95PCT (table 2). Among the three factors, the effect sizes of time period and scenario, ranging between 11.6% and 12.8%, were very close to each other but much higher than that of the GCM, which contributed only about 2% to the overall variation (table 2). The high effect size of time period was an indication of a significant climate change signal translated into fire weather change. The higher effect size of scenario compared to GCM indicates that CO2 forcing scenarios contributed more to the fire weather changes than did the choice of GCM. However, the residual variation was about 50% for both models, indicating that factors other than weather (e.g. fuel, topography, and fire ignitions) are important.
Table 2. Effect size (%, see Methods) of global climate models (GCM), CO2 emission scenarios (SCN), and time period (TP) in mixed-effect models for the 95th percentile changes and median ratios of spread days considering GCM, SCN, and TP as fixed factors, and fire zone (FZ) as random factor.
| Factor | Median ratio | 95PCT shift |
|---|---|---|
| SCN | 11.6 | 12.8 |
| GCM | 3.2 | 4.1 |
| TP | 11.6 | 12.3 |
| SCN:GCM | 2.4 | 2.1 |
| SCN:TP | 13.4 | 13.2 |
| GCM:TP | 5.2 | 5.2 |
| SCN:GCM:TP | 2.4 | 1.5 |
| Residuals | 50.1 | 48.7 |
4. Discussion
Anticipating future fire regimes across Canada has been an area of active research for a quarter of a century (e.g. Flannigan and Van Wagner 1991, Flannigan et al 2005, Balshi et al 2009, Flannigan et al 2009a, Flannigan et al 2009b, de Groot et al 2013, Boulanger et al 2014). The most recent generation of GCMs indicate a warmer (3.8 °C–4.6 °C) and mostly wetter fire-season climate in Canada (14 fire zones with 2%–22% more precipitation and 2 fire zones with 1%–2% less precipitation) by the 2080s (appendix E, table S1). However, increases in temperature can compensate for or override the effects of increasing precipitation on fuel flammability (Flannigan et al 2016). Thus, we found a decrease in the number of days with DMC <20, indicating fewer fire-ending events, in all fire zones (appendix E, table S2) by the 2080s.
One of the major challenges has been to determine how changes in fire climate will translate into fire activity (Wang et al 2014). Using the most recent generation of GCMs, weather station observations, MODIS hotspot data, and the national fire database of Canada, this study has demonstrated a way to estimate daily fire weather patterns under climate change and has quantified their influence on an important aspect of fire potential: the number of days of significant spread that are likely to occur during a fire. Our results suggest that climate change over the next century may have significant impacts on fire spread days in almost all parts of Canada's forested landmass; the number of fire spread days could experience a 2-to-3-fold increase under a high CO2 forcing scenario in eastern Canada, and a more than 50% increase in western Canada, where the fire potential is already high. Our results also indicate an increase in the frequency of seasons with a large number of spread days (more extreme extremes); further exploration of the influence of extreme events constitutes a future research question of great interest.
The future daily fire weather projections used in this study were derived from monthly anomalies and are thus conceptually similar to the approach developed by Abatzoglou and Kolden (2013). The method preserves the seasonal distribution of fire-weather variables from the baseline data, especially with respect to precipitation. In other words, the variation in the timing or precipitation events in the future is representative of the observed data, rather than being fully generated from physical processes. This may have constrained the variance expected in the future under climate change, but still captures changes in the frequency of fire-conducive daily weather. Further work is needed to compare our results to those derived from more sophisticated datasets—as they become available— and especially to explore the influence of changes in the temporal distribution of precipitation on burning period length and the number of spread days.
The future spread day distributions estimated in this study are critical to understanding fire regime changes they are also critical inputs to fire risk modeling and mapping (e.g. Parisien et al 2013), which has become a more pressing management concern given major fire damages in recent years (e.g. Parisien 2016, Flannigan et al 2016). Because fire size increases as a power function of time (McArthur 1968,Van Wagner 1969), seemingly small changes in the absolute number of spread days may have an important influence on future fire activity. These increases are particularly important in zones with higher baseline spread days. Recent examples of large increases in fire size over a small number of spread days include the 2013 Eastmain fire in Québec (Erni et al 2016) and the 2016 Fort McMurray fire in Alberta (Parisien 2016).
Although this study is the first to assess changes in future fire spread days based on daily fire weather data, projections of future fire regimes based on monthly data were recently performed using the same zonation system (Boulanger et al 2014). In comparison, we found that the spatial patterns of annual area burned (AAB) and changes in fire occurrence from Boulanger et al (2014) were almost the inverse of the change in spatial pattern of median spread days from this study, where we found the greatest increase in fire activity was predicted in the west and southeast zones (figure 4). That study's projections are, however, similar to the pattern we found in the 95th percentile changes (figure 5), which could be interpreted as a surrogate for the increase in size of the largest fires in each fire zone. We assume that temporal weather data resolution (i.e. daily vs. monthly) is the major cause for this discrepancy, although it must be noted that the two studies had several differences: the metric of fire activity, the GCMs used, and the prediction methods. Therefore, further exploration would be needed to demonstrate that the discrepancy is chiefly a factor of temporal data resolution. Logically, we can assume that increases in the number of spread days would result in larger fires, which should contribute to a larger annual area burned; however, area burned also depends on spatio-temporal patterns of fire ignitions, amount and configuration of flammable vegetation, and fire suppression effort (Parisien et al 2013, Wang et al 2016).
As demonstrated in earlier work, the conversion between realized and potential spread-day distributions is a critical step in improving predictions of future fire activity (Wang et al 2014, Harris et al 2016, Young et al 2016). This conversion is based on historical fire and weather observations in each fire zone and the historical relationship between potential and realized spread days. Linking potential and realized spread days may overestimate the maximum number of realized spread days if the linkage functions are not well fitted (Wang et al 2014), i.e. the predicted maximum number of realized spread days in the future will be unrealistically high. Comparing predicted and observed maximum realized spread days for the baseline period, we found close correspondence (appendix B). However, if adjustments are needed to limit the maximum realized spread day (RSD) values, we recommend using the ratio between the maximum RSD obtained from fire growth data and observation-based potential spread days (PSD). Alternatively, the ratio between the high percentiles (e.g. 95th percentile) might also represent a reasonable estimate of the rate of change in the maximum RSD when a very long-lasting fire is considered an outlier.
Further work is needed to improve methods to estimate fire spread days under a changing climate. Potential (i.e. weather-based) spread days may be overestimated because of our relatively poor understanding of fire survival, which was limited in this study with a simple moisture index threshold. Historical spread-day distributions are also likely confounded by fire management in some zones with intensive fire suppression, and it is uncertain whether this effect will increase, decrease, or remain stable (Magnussen and Taylor 2012). Furthermore, the PSD-RSD relationship encompasses multiple factors, including landscape features (i.e. topography), day length, fuel distribution, spatio-temporal patterns of fire ignition, and fire suppression. In this study, we made the assumption that this relationship remains static under climate change, even though some of the factors involved in this relationship, such as fuel distribution and fire ignitions will likely be affected. For example a warmer moister atmosphere may result in more lighting activity. Indeed Wotton et al (2010) projected an increase in fire ignitions of 75%–140% by the end of the century. While it was beyond the scope of this study, a better understanding of how future changes in these factors and will affect the relationship between potential and realized spread days is crucial in improving predictions of future fire regimes.
Conclusion
Wildland fire can have a tremendous influence on ecosystem composition, pattern, and function of fire-prone and fire-adapted ecosystems, but it can also be a threat to public safety, forest communities, timber values and infrastructure upon which people depend. Wildland-urban interface fires can result in evacuations, health impacts due to smoke, property loss, loss of employment and business income, and even deaths (Beverly and Bothwell 2011). Therefore, understanding and predicting wildfire and the symptomatic ways in which they spread in landscapes is crucial in fire risk assessment, fuel treatment planning, and fire suppression operations, especially in areas when community and values are at risk. Although further research is required to fully assess the predictive gains in projecting fire activity using daily (rather than monthly, annual, or multi-decadal) data, the method proposed here, at least in concept, better captures the temporal variability that is inherent to large wildfires burning in northern forests. As such, the results from this study deepen our understanding of future fire and will help inform and improve how we live and work in a fire-prone landscape in a changing climate.
Acknowledgments
We are grateful to Yan Boulanger for sharing his homogeneous fire zones, to Evan DeLancey for helping processing the future daily fire weather data, and to Sean Parks for sharing the fire progression R script.
Footnotes
- 6
NASA MCD14ML product, Collection 5, Version 1, available at: https://fsapps.nwcg.gov/afm/gisdata.php.