
Abstract
Groundwater exploitation is a major cause of land subsidence, which in coastal areas poses a flood inundation hazard that is compounded by the threat of sea-level rise (SLR). In the lower Mekong Delta, most of which lies <2 m above sea level, over-exploitation is inducing widespread hydraulic head (i.e., groundwater level) declines. The average rate of head decline is ∼0.3 m yr−1, based on time-series data from 79 nested monitoring wells at 18 locations. The consequent compaction of sedimentary layers at these locations is calculated to be causing land subsidence at an average rate of 1.6 cm yr−1. We further measure recent subsidence rates (annual average, 2006–10) throughout the Delta, by analysis of interferometric synthetic aperture radar (InSAR), using 78 ALOS PALSAR interferograms. InSAR-based subsidence rates are 1) consistent with compaction-based rates calculated at monitoring wells, and 2) ∼1–4 cm yr−1 over large (1000s of km2) regions. Ours are the first mapped estimates of Delta-wide land subsidence due to groundwater pumping. If pumping continues at present rates, ∼0.88 m (0.35–1.4 m) of land subsidence is expected by 2050. Anticipated SLR of ∼0.10 m (0.07–0.14 m) by 2050 will compound flood inundation potential. Our results suggest that by mid-century portions of the Mekong Delta will likely experience ∼1 m (0.42–1.54 m) of additional inundation hazard.
Export citation and abstract BibTeX RIS

Content from this work may be used under the terms of the Creative Commons Attribution 3.0 licence. Any further distribution of this work must maintain attribution to the author(s) and the title of the work, journal citation and DOI.
1. Introduction
In the Mekong Delta ('Delta'), shared by Cambodia and Vietnam, groundwater exploitation has increased dramatically in recent decades. Up from a limited number before the 1960s, today more than one million wells access groundwater for domestic, agricultural, and industrial needs, causing hydraulic heads (i.e., groundwater levels) to steadily decline in many aquifers over extensive regions (Wagner et al 2012). Over-exploitation of groundwater exposes a densely settled population of >20 million living in the Delta to a variety of hazards associated with naturally occurring arsenic contamination (Erban et al 2013), subsurface saline intrusion (e.g., Bear et al 1999), land subsidence (e.g., Poland 1984) and potential damage to infrastructure, as well as increases in the depth and duration of annual flooding. Most of the Delta lies within 2 m of current sea level and is highly vulnerable to the additive effects of regional pumping-induced land subsidence and sea-level rise (SLR) due to global climate change.
Pumping-induced land subsidence, observed in unconsolidated groundwater systems around the world (e.g., Poland 1984, Galloway and Burbey 2011), has occurred at rates that can greatly exceed SLR (global present mean: 0.32 cm yr−1, Church et al 2013). Famous coastal examples include Venice, Tokyo and Bangkok, portions of which have subsided in response to groundwater extraction at rates up to, respectively, 1.4 cm yr−1 (Tosi et al (2002)), 4 cm yr−1 (Hayashi et al 2009), and 12 cm yr−1 (Phien-wej et al 2006). In regions with extensive confined aquifers, removal of stored groundwater from within the sediment structure meets a significant portion of pumped demand. When groundwater is extracted, pore pressures are reduced and sedimentary layers undergo compaction that is manifested at the land surface as subsidence. Ground-based measurements of land subsidence can be made over small spatial scales, but remotely-sensed observations are essential for spatially comprehensive mapping of deformation over large regions.
Regional deformation of the land surface is often measured remotely using satellite-based synthetic aperture radar (SAR) imagery processed by interferometry (InSAR). InSAR quantifies a phase shift of radar waves backscattered by the Earth's surface between two satellite passes, which is a direct measurement of deformation during the elapsed time. InSAR-based investigations of land subsidence due to the extraction of groundwater (e.g., Galloway et al 1998, Hoffman et al 2001, Buckley 2003, Colesanti et al 2003, Chatterjee et al 2006, Chaussard et al 2013, Erban et al 2013, Higgins et al 2013) have been facilitated by the increasing availability of data from SAR instruments operating over different time periods and imaging at a variety of wavelengths (λ). To quantify recent land subsidence in the agriculture-dominated Delta, the L-Band PALSAR instrument (λ = 23.6 cm) aboard ALOS-1 (2006–11) offers the best data product, as the longer wavelength performs comparatively well in vegetated areas and promotes InSAR coherence over greater timespans between imaging dates, and many images are available for the Delta.
This study is the first to estimate rates of land subsidence due to groundwater exploitation in the majority of the lower Mekong Delta. We report annual average subsidence rates over the 2006–10 period of coincident groundwater monitoring and ALOS PALSAR data. We show that InSAR-based subsidence rates have spatial patterns consistent with measured declines in hydraulic heads (i.e., drawdown) at monitoring wells. Process-based geomechanical calculations that consider the drawdown and stratigraphy at these wells confirm the spatial trends and rates of subsidence detected by InSAR, which are an order of magnitude higher than present rates of SLR. These dual methods of analysis are presently the only available means to study regional land subsidence in this data-scarce setting. Our approach may serve as a model for subsidence investigations in other areas similar to the Mekong Delta, a number of which are also threatened by the combined impacts of pumping-induced subsidence and SLR, among other anthropogenic causes of increased inundation hazard (Syvitski et al 2009).
2. Data and methods
2.1. Analysis of land subsidence due to pumping-induced compaction
Hydraulic heads were measured monthly over the period 1995–2010 in 106 wells throughout the Vietnamese portion of the Delta by the Division of Water Resources Planning and Investigation for the South (DWRPIS) of Vietnam. Well logs documenting the elevation and thickness of each hydrogeologic layer (sandy aquifers, which are interbedded with thin clays, or continuous, thick confining clay units) at nested monitoring well locations were also provided by the DWRPIS. Most of the seven major exploited aquifers were monitored in each of 18 distributed well nests (see figure 1(A) for locations). We calculated the rate of drawdown for each well in these nests (79 total) using linear regression of the hydraulic head observations. Rates for unmonitored aquifers in a nest were interpolated from neighboring nest data for the same aquifer. Of the 18 nests, 15 overlap with the spatial and temporal coverage (2006–10) of the PALSAR imagery (labeled A–O in our figures). For each of these 15 nests, rates of drawdown for monitored wells (66 total), interpolated rates for unmonitored aquifers, and hydrogeologic layers are shown in the supporting information (SI).

Figure 1. (A) Maximum rate of hydraulic head decline (i.e., drawdown) among aquifers, interpolated from monitoring well data. Well locations are labeled alphabetically. (B). Compaction-based subsidence rates, interpolated from calculations at well locations. Subsidence is a function of both head decline and clay thickness. Dashed lines are interpreted outside of area of data coverage. (C). InSAR-based line of sight rates of land subsidence. Data © JAXA, METI 2011. All rates in panels A–C are annual averages over the period 2006–10.
Download figure:
Standard image High-resolution imageVertical compaction rates resulting from drawdown in each hydrogeologic layer were calculated according to the following expression for 1D consolidation of compressible porous media (Riley 1969):

where Δb is the change in layer thickness, b is the full thickness of the layer, Δh is the change in hydraulic head, or drawdown, and Ss is the layer's specific storage (1/L), a metric related to the compressibility of both the sediment and water that expresses the volume of water released from storage per unit volume of water-bearing layer per unit decline in hydraulic head. This equation assumes instantaneous equilibration of hydraulic heads in low permeability units, neglecting delays in drainage. Drawdown rates in a given aquifer were applied to that layer and the overlying confining layer. Specific storage (inelastic) was assumed to be constant within each layer but decrease with layer depth (midpoint) according to an exponential function (Ingebritsen et al 2006) due to natural consolidation occurring over geologic time. Values in the deepest layers are approximately half that of the near-surface values (5.5 × 10⁻⁵ m−1 for aquifer sands and 5.5 × 10⁻⁴ m−1 for confining clays). Elastic storage was not included since (1) its magnitude tends to be 20 to more than 100 times less than inelastic storage (Riley 1998), and (2) we are interested in annual average subsidence rates associated with the declining trend in hydraulic heads; seasonality is not considered. Summation of compaction rates in each layer at each monitoring nest location was used to estimate compaction-based, vertical land subsidence; horizontal deformation is typically much less significant and was assumed to be negligible (e.g., Bawden et al 2001, Hoffman and Zebker 2003).
2.2. InSAR-based subsidence rates
We obtained a total of 259 ALOS-1 PALSAR images representing nine scenes that cover most of the Delta. Scenes that mainly cover offshore areas and the northernmost portion of the Delta in Cambodia were not regularly imaged. From all available images, we culled a subset to meet the criteria, the rationale for which is discussed below, that a sizeable number of anniversary pairs (+3 days, due to the satellite's repeat period) could be formed for a given scene. A total of 121 images were retained in this subset for further processing, from which 78 interferograms were formed (see SI for additional details).
The core processing method used was interferometric stacking. The procedure determines the average phase shift of a stack of coregistered (geographically aligned) interferograms, reducing atmospheric errors, assumed to be correlated in space but not in time, by a factor of the square root of the number of interferograms in the stack (Zebker et al 1997, Strozzi et al 2001). Stacking is appropriate in this case because linear annual average subsidence rates are expected based on trends in aquifer drawdown that are linear on an annual basis despite seasonal oscillations (see SI). To minimize the influence of seasonal oscillations, we consider only anniversary interferograms. Such interferograms should capture a similar amount of deformation in each, since the drawdown rate is approximately constant over same-month annual intervals. InSAR-based subsidence rates at monitoring well locations were estimated using 0.5 km radius circles, or windows, of high-correlation (stack average >0.15, see SI for mapped InSAR correlation) pixels centered on each well nest. A window-weighting procedure (see SI) was employed to obtain representative vertical rates and standard deviations to estimate errors.
2.3. Absolute SLR
Changes in sea surface height are monitored globally by satellite altimetry. The absolute SLR determined from these measurements trends upward linearly over the period of record, 1993–2012, averaging 0.3 cm yr−1 (0.2–0.4 cm yr−1) in waters off of the Delta (Church et al 2013). We later compare this average rate directly with our annually-averaged InSAR-based subsidence rates.
3. Results
Hydraulic heads have declined significantly throughout much of the Mekong Delta in recent years. Monitoring wells indicate a drop of over 15 m at Ca Mau since the mid-90s, leading to a cone of depression now nearly 20 m below sea level datum. The current rate of hydraulic head decline among Delta wells averages 26 cm yr−1 (range: 9–78 cm yr−1), which has caused widespread regional drawdown in a ∼100 km-wide swath trending NE from Ca Mau towards Ho Chi Minh City (HCMC) (figure 1(A)). The magnitude of drawdown diminishes in wells with increasing proximity to the international border, owing to minimal groundwater extraction in Cambodia, reduced development density in northeastern areas of the Vietnamese Delta adjacent to Cambodia, and bedrock outcropping in the northwestern corner of the Delta. Subsidence rates from compaction-based calculations follow a similar pattern (figure 1(B)), modified by the highly variable thicknesses of compressible subsurface layers (see SI). Compaction-based subsidence rates average 1.6 cm yr−1 (range: 0.28–3.1 cm yr−1).
InSAR-based subsidence rates throughout the Delta are shown in figure 1(C) (colored overlay). The most conspicuous feature is a large subsidence bowl centered on HCMC in the northeast corner, where the highest rates (∼4 cm yr−1) are observed over the largest continuous area. Similarly high rates are observed in smaller areas centered on many of the Delta's major cities. Between these localized high subsidence areas, a large region of lower-rate subsidence, which appears in yellow, extends along a generally southwest–northeast (SW–NE) axis aligned with numerous urban areas and industrial corridors connecting the major pumping centers at Ca Mau and HCMC. InSAR-based subsidence patterns appear to largely coincide with the regional trends in pumping-induced compaction shown in figure 1(B), though they may also be influenced by mechanisms of land height change that are unrelated to pumping- e.g., natural consolidation or aggradation (see SI for additional discussion). These mechanisms, however, are not expected to be spatially correlated with pumping-induced compaction, suggesting that the effects of groundwater extraction dominate the deformation signal detected by InSAR.
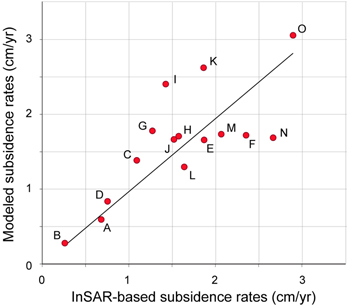
InSAR-based estimates agree well with compaction-based subsidence rates at monitoring locations (figure 2). A linear least-squares fit through the origin for the two estimates has a slope of nearly one (0.98) and a coefficient of determination, r2, of 0.51 (figure 2). The RMS error between rates estimated by the two approaches is 0.5 cm yr−1, with 10 of the 15 points falling within 0.5 cm yr−1 of the linear relationship relation shown. The average rate of InSAR-based subsidence at monitoring well locations is 1.6 cm yr−1. For the few locations where InSAR and compaction estimated rates are <1.0 cm yr−1, the rates are nearly identical (within ±0.1 cm yr−1). We explored the sensitivity of compaction to the spatial variability of specific storage values, Ss. An exact match to InSAR-based estimates would be produced if Ss values were individually adjusted by 60–160%, mean of ±20%, maintaining the 1 : 10 sand–clay ratio. This range is consistent with values reported for these sediment types (e.g., Domenico and Mifflin 1965, Cleveland et al 1992, Burbey 2003). Although storage properties undoubtedly vary among well locations, our results are based on uniform values as we have no map of measured Ss for this region.
Figure 2. Fit between subsidence rates determined by InSAR and hydrogeologically-based methods. Equation for linear fit is y = 0.98x, with r2 = 0.51.
Download figure:
Standard image High-resolution image
Deviations in the relation between subsidence estimates based on InSAR versus compaction modeling stem from various sources of uncertainty. For the InSAR-based estimates, deviations may result from spatio-temporal variability in surface scattering properties, which had errors ranging from 0.5 to 1.0 cm yr−1. They may also result from other locally-influential processes affecting land surface height not considered here. For the compaction-based estimates, deviations likely arise from the fact that simple uniform storage properties were used for each hydrogeologic layer and may also result from neglected time delays in the compaction of thick, low permeability layers. Given that drawdown began more than a decade before our period of analysis, however, delayed drainage likely has been on-going at all well locations, its magnitude varying spatially. Both estimates may be subject to errors due to ignoring elastic deformation of the aquifer system, though we expect such errors to be minor given (1) our treatment of the data, which sought to remove seasonal influences, and (2) the much greater magnitude of inelastic storage. Existing SAR and hydraulic data did not permit more detailed consideration for these factors.
In general, Delta subsidence rates exceed the SLR rate by an order of magnitude, depending on the location where subsidence is occurring and which projected rate of SLR is adopted. Assuming continuation to 2050 of the recent rates of subsidence (∼1–4 cm yr−1 based on mapped InSAR) and the range of average absolute SLR rates (0.2–0.4 cm yr−1, Church et al 2013), a conservative estimated range for additional potential inundation depth in the Delta is 0.4–1.6 m.
4. Discussion
Our analysis suggests that land subsidence is occurring throughout much of the Vietnamese side of the Mekong Delta. Such deformation is typical of this type of aquifer system when over-exploited. The highest rates of subsidence are found along a SW–NE trending axis in the heavily-pumped central Delta, with lower rates fringing this region, as seen in the spatial patterns of both the InSAR and sediment compaction-based results (figures 1(B) and (C)). Subsidence rates determined by these two methods are correlated over the full range of values at monitoring well locations (figure 2). The magnitude of pumping-induced subsidence is considerably greater than SLR, and the extent is especially significant in this low-relief landscape already prone to widespread annual flooding: modest deformation due to human activities can change flooding conditions over large areas. Extensive subsidence further confirms that aquifer exploitation is excessive and may have other unintended consequences for groundwater quality. Over-pumping may induce saline intrusion and/or exacerbate arsenic contamination in antecedently high-quality fossil groundwater reserves (Mukherjee et al 2011, Winkel et al 2011, Erban et al 2013).
Our results are particularly significant given that the Delta landscape is especially challenging to study using InSAR. Signal quality is greatly affected by spatio-temporally variable surface conditions. Scattering properties change throughout the year in the large portion of the region that is dedicated to paddy, alternately inundated or vegetated during one of up to three rice-cropping seasons. Much of the Delta is radar-dark during multi-month annual flooding driven by the Southeast Asian monsoon. In addition to these climatically driven effects, the changing atmospheric water vapor mass further imposes spatially and temporally variable radar phase delays, referred to generally as atmospheric effects (Zebker et al 1997).
Interestingly, the same characteristics that obscure the SAR signal in much of the landscape have shaped development of the Delta in ways that also make it amenable to InSAR. Widespread, repeated inundation and agriculture-based land use has driven demand for dry land and dry season irrigation, leading to the development of an extensive canal and levee network. This network, along with natural levees lining the main river system, concentrates human settlements and associated stable surfaces (e.g., buildings, roads, and packed clay levees), creating radar-bright, well-correlated areas throughout the delta. In addition, measurements made on the network of development, elevated above the floodplain, are not affected by sedimentation, which could interfere with detection of subsidence rates. Human modifications to the built-up land surface may confound InSAR interpretation locally, but at the regional scale, the network of development renders these measurements more reliable.
The combination of InSAR- and compaction-based estimates of subsidence in the Delta is uniquely valuable in this data-limited context. The scale and density of results are unmatched by any other presently available technique; even ground-based measurements of subsidence, if they existed, would be insufficient to observe the extensive, low-rate deformation detected by InSAR. The imaging capability of the L-band ALOS PALSAR mission is, in large part, responsible for the quality of these estimates. In the absence of ground-based subsidence data, InSAR results have been confirmed by simple accounting of geomechanical calculations using drawdown and stratigraphic information. Land subsidence patterns and rates may guide future management of the Delta aquifer system, and the dual-estimation approach used here is potentially valuable in similarly under-studied environments subject to the compounding impacts of pumping-induced subsidence and SLR.
Acknowledgments
We wish to thank the Department of Water Resources Planning and Investigation for the South of Vietnam (DWRPIS), the Japanese Aerospace Exploration Agency (JAXA), Japanese Ministry of Economy, Trade and Industry (METI) and the Alaska Science Facility (ASF) for providing data used in this work. We gratefully acknowledge the UPS Endowment Fund and the Global Freshwater Initiative of the Woods Institute for the Environment at Stanford. This work is supported by the National Science Foundation under grant EAR‐1313518 to Stanford University. Any opinions, findings, and conclusions or recommendations expressed in this material are those of the authors and do not necessarily reflect the views of the National Science Foundation.