

Abstract
Water and land resources are under increasing pressure in many parts of the globe. Diet change has been suggested as a measure to contribute to adequate food security for the growing population. This paper assesses the impact of diet change on the blue and green water footprints of food consumption. We first compare the water consumption of the current diets with that of a scenario where dietary guidelines are followed. Then, we assess these footprints by applying four scenarios in which we gradually limit the amount of protein from animal products to 50%, 25%, 12.5% and finally 0% of the total protein intake. We find that the current water use at the global scale would be sufficient to secure a recommended diet and worldwide energy intake. Reducing the animal product contribution in the diet would decrease global green water consumption by 6%, 11%, 15% and 21% within the four applied scenarios, while for blue water, the reductions would be 4%, 6%, 9% and 14%. In Latin America, Europe, Central and Eastern Asia and Sub-Saharan Africa, diet change mainly reduces green water use, while in the Middle East region, North America, Australia and Oceania, both blue and green water footprints decrease considerably. At the same time, in South and Southeast Asia, diet change does not result in decreased water use. Our results show that reducing animal products in the human diet offers the potential to save water resources, up to the amount currently required to feed 1.8 billion additional people globally; however, our results show that the adjustments should be considered on a local level.
Export citation and abstract BibTeX RIS

Content from this work may be used under the terms of the Creative Commons Attribution 3.0 licence. Any further distribution of this work must maintain attribution to the author(s) and the title of the work, journal citation and DOI.
1. Introduction
There is widespread concern over the use of the world's water resources (Rockström et al 2009b). As the population grows, water scarcity increases in many parts of the world (Kummu et al 2010, Wada et al 2011), and the planetary boundary for consumptive freshwater use is rapidly approaching (Gerten et al 2013). It has been estimated that around a third of the world's population now lives in areas that suffer from physical water scarcity (Alcamo et al 2007, Islam et al 2007, Kummu et al 2010). Agriculture is by far the thirstiest water user, accounting for about 90% of total fresh water consumption globally (Oki and Kanae 2006). Scarce water resources increasingly limit sufficient food production, particularly in large parts of Africa and Asia (Fader et al 2013, Kummu et al 2014).
The pressure on limited water resources is likely to intensify in the future. The global population is expected to reach 9.6 billion by 2050, adding over 2 billion mouths to feed to the current population (UN 2013). It has been estimated that, with current food consumption trends, ensuring adequate nutrition for the future population would require doubling the food production by 2050 (IAASTD 2009, Kearney 2010). Along with the increasing agricultural demand for water, the changing climate could create additional pressure on water resources, as precipitation variability is projected to increase, and droughts and floods are likely to become more frequent (Coumou and Rahmstorf 2012, Hertel et al 2010).
Currently, about a quarter of all produced food is lost or wasted along the food supply chain (Kummu et al 2012). Halving these losses would provide food for 1 billion extra people–or limit the environmental burden of the current production. It has also been suggested that agricultural productivity could be further increased by, e.g., closing yield gaps with better crop and hydrological management and by improvements in crop genetics (Foley et al 2011, Godfray et al 2010, Falkenmark and Rockström 2004).
These measures, however, might be insufficient to secure the global food supply, which is distributed very unequally, both globally and locally (Kearney 2010, Tanumihardjo et al 2007, Tweeten 1999). Although a large population is still living with inadequate nutrition (Naylor 2011), the widespread problem of overeating and obesity also exists (Chopra et al 2002, Finucane et al 2011, WHO 2013). In many parts of the world, diets are changing toward higher energy and animal source food consumption (Porkka et al 2013). Animal products, particularly meat, are often said to be more resource-intensive than plant-based foods (Falkenmark and Lannerstad 2010, FAO 2006, González et al 2011, Hoekstra 2010).
The importance of diets for future food security and the sustainable use of natural resources has been recognised (Falkenmark and Lannerstad 2010, Foley et al 2011, Pimentel and Pimentel 2003, Rockström et al 2009a), and consumption of animal products has been found to have large environmental impacts (FAO 2006, Hoekstra and Chapagain 2007). Studies on the impact of diets on water resources exist for specific cities (Vanham and Bidoglio 2014b), countries (Liu and Savenije 2008, Vanham 2013) and regions (Renault and Wallender 2000, Vanham and Bidoglio 2014a, Vanham et al 2013), while other studies concentrate on specific foodstuffs or model diets (Baroni et al 2006, Marlow et al 2009, Reijnders and Soret 2003, Vanham and Bidoglio 2014b).
However, little is known about the effect of adjustments to current diets on global water resources. Ercin and Hoekstra (2014) compare the current consumption pattern with a high meat model diet and a meat-reduced diet with a maximum of 30% protein from animal sources, adapted from Erb et al (2009), in their scenario analysis; they find that changing consumption patterns can bring water footprints to sustainable levels. Their work concentrates on a regional level, however, and only one scenario is based on the existing food consumption. Another regional study by Springer and Duchin (2014) combines diet modification with agricultural technology development, also taking trade into account. They conclude that it is possible to find sustainable production and consumption patterns that satisfy the increasing demand indicated by population estimates for the year 2050.
Freshwater use and the cropland requirements of food products are highly dependent on site conditions, production methods and other factors with high spatial heterogeneity (Mekonnen and Hoekstra 2011a). Local diets are also strongly affected by both the availability of different food items and by local traditions and culture (Eastwood 2009). This, together with the extensively varying nutritional status and body mass index (BMI) distribution between the countries (Finucane et al 2011), would result in a high uncertainty of global estimates on the environmental effects of dietary changes without a country-by-country analysis.
This study attempts to deepen the understanding of the impact of diets on resource use by analysing the effect of changes in diets on consumptive water use at a country level and at a global extent. We first analysed the impact of modifying diets to fulfil the dietary guidelines by the World Health Organization (WHO), and then the effect of shifting from animal-based food products, especially meat, toward a more plant-based diet. In both analyses, we kept the diet composition as close to original as possible to retain the traditional and culturally acceptable food composition in each country. We analysed the corresponding changes in water use, with special emphasis on regional differences and on differences between how green water is used (i.e., naturally infiltrated rain, attached to soil particles and accessible by roots) and how blue water is used (i.e., freshwater in rivers, lakes, reservoirs and aquifers extracted for irrigation).
2. Materials and methods
We first analysed the current consumptive use of water resources for the global food supply, which is comprised of food intake and losses for each nation separately at the global scale (Original Diet, OD). Then, we adjusted the national food intake to follow dietary guidelines (Recommended Diet, RD), after which we reduced the contribution of animal products in four steps (A50, A25, A12.5 and A0). For each scenario, we assessed the use of 'blue' (i.e., freshwater in rivers and aquifers) and 'green' (i.e., naturally infiltrated rain, attached to soil particles and accessible by roots) water resources. We left 'grey' water (freshwater required to assimilate pollutants) and agricultural water use associated with non-food products out of the analysis.
2.1. Food supply data
We used food supply information from the FAO (United Nations Food and Agriculture Organization) food balance sheets (FAO 2013). To limit the effects of possible year-to-year variations, we used averages over the most recent three data years (2007–2009). The food supply figures provided were totals that included domestic production and net imports, adjusted for any changes in stocks (FAO 2001). For each country, we aggregated food products into 13 groups, of which eight were used in the diet adjustment calculations. These were vegetal product groups of cereals, fruits and vegetables, oil, oilseeds and roots and animal-based groups of eggs, meat and milk. Additionally, the food groups of fish, beverages, spices, stimulants and sugar were included in the calculations but were not used for the diet adjustment for various reasons (see section 2.2 Diet scenarios). The group composition can be found online (supplement table S1, available at stacks.iop.org/ERL/9/074016/mmedia). The data were available for 176 countries and for a global population of 6.6 billion people (97% of the total population). Harvest and post-harvest losses were derived for each country and food group from FAOSTAT (FAO 2013), while waste percentages for processing, distribution and consumption were derived from Gustavsson et al (2011) and Kummu et al (2012).
2.2. Diet scenarios
In the first phase of the diet adjustment, the 'Recommended Diet' (RD), we changed the food intake to conform to each country-specific average dietary energy requirement ADER (FAO 2012b) and to the WHO recommendation of macronutrient intake (WHO 2003), as described in table 1. In addition to the dietary recommendations, some constraints in diet change were considered in the diet adjustment. As many of the world's wild fisheries are already overexploited (FAO 2005), we constrained the consumption of fish to its current level. Whilst there is potential to increase aquaculture production (Tidwell and Allan 2001), the related environmental effects are complex (Bostock et al 2010), and the required water footprint data are not available; thus its assessment was left for further studies. For health reasons, additional alcoholic beverages or sugar were not allowed to increase the insufficient dietary energy intake in the diet adjustment. Moreover, per capita consumption of spices and stimulants was not changed, as we believe that these are not used to fulfil nutritional needs but rather are used for cultural and taste reasons.
Table 1. Recommendations for food macronutrient composition and limits on sugar and vegetables, applied to all scenarios. WHO 2003.
| Dietary factor | Recommendation |
|---|---|
| Total protein | 10–15% of energy |
| Total fat | 15–30% of energy |
| Total carbohydrate | 55–75% of energy |
| Free sugars | <10% of energy |
| Fruits and vegetables | min. 400 g day−1 |
Starting from the RD, we reduced the contribution of animal products to the diet in four steps (table 2), while still accounting for the dietary guidelines and for other limitations that were described before. In scenario A50, we limited the protein intake from all animal products to 50% and from meat to 16.7%. Consequently, animal protein consumption did not change much in countries where it was already low compared to the total protein intake, while animal protein was considerably replaced by protein from other food groups in countries where animal products were a major staple food. The limits for protein intake from animal products were then gradually decreased to zero in scenarios A25–A0 (table 2).
Table 2. Diet scenario optimisation constraints. RD stands for Recommended Diet, and A50-A0 stands for diets with limited animal protein content.
| SCENARIO | RD | A50 | A25 | A12.5 | A0 |
|---|---|---|---|---|---|
| Food intake [kcal/cap/day] | ADER |
ADER | ADER | ADER | ADER |
| Proteins [% of daily energy intake] | 10–15% | 10–15% | 10–15% | 10–15% | 10–15% |
| Fats [% of daily energy intake] | 15–30% | 15–30% | 15–30% | 15–30% | 15–30% |
| Vegetables- fruits and vegetables- oilseeds | ⩾400 g/cap/day | ⩾400 g/cap/day | ⩾400 g/cap/day | ⩾400 g/cap/day | ⩾400 g/cap/day |
| Animal products- eggs- meat- milk | min change |
⩽50% of prot | ⩽25% of prot | ⩽12.5% of prot | 0% |
| of which meat | min change | ⩽16.7% of prot | ⩽8.3% of prot | ⩽4.17% of prot | 0% |
| Fish |
No increase | No increase | No increase | No increase | No increase |
| Beverages |
No increase | No increase | No increase | No increase | No increase |
| Sugar [% of daily energy intake] | ⩽10% | ⩽10% | ⩽10% | ⩽10% | ⩽10% |
| Oilseeds Roots | min change | meat |
meat protein replacement | meat protein replacement | meat protein replacement |
| Other groups- cereals- oil | min change | min change | min change | min change | min change |
aADER, average dietary energy requirement, varies by country, ranging from 2053–2704 kcal/cap/day (source: FAO) bMin change refers to minimum change, i.e., aiming to keep the structure of the diet as close to the cultural diet as possible cGiven the over-fishing of many fish populations, we do not allow the fish consumption to increase dGiven the health problems related to the over-consumption of beverages, we do not allow the consumption of that group to increase eThe use of spices and stimulants was not allowed to increase over their original consumption, as they primarily satisfy needs other than nutrition fThe meat protein removed by the maximum limits is assigned to the oilseeds and the roots groups
To preserve a good amino acid composition and to avoid a nutritionally unsatisfactory diet, the protein removed from the meat group was substituted by protein from oilseeds and root crops. In contrast, the optimisation algorithm was allowed to freely compensate for animal protein reduction in the milk and egg groups. The optimisation code is provided in the Supplement for further experimentation.
2.3. Adjustment methodology
We used quadratic programming to calculate the changes in diet for each step. Although quadratic programming (Nocedal and Wright 2006) is an optimisation method, the goal was not to optimise the water consumption of a diet but to find a diet that would fulfil two criteria: i) meet the dietary objectives of each scenario (table 2) and ii) minimise the change in the diet, i.e., aim to retain the typical diet for each country. The original diet was assigned as the optimisation objective, and constraints were used to enforce the requirements of each scenario. Quadratic programming provided a virtual cost for any deviations from the objective function; therefore, the result closely followed the traditional, culturally acceptable diet while satisfying the nutritional constraints.
2.4. Calculating changes in water use
We estimated the consumptive water use of the diet in the different scenarios by multiplying the food supply (i.e., including food intake and losses) with water footprints of the crops (Mekonnen and Hoekstra 2011b) and with animal products (Mekonnen and Hoekstra 2010). Wherever possible, we used product-and country-specific values for the footprints, but if country-specific values were unavailable, global averages were used instead. The blue water consumed for pasture and grass irrigation was derived from the Global Crop Water Model GCWM (Siebert and Döll 2010) because this water use was not considered in the water footprints of animal feed calculated by (Mekonnen and Hoekstra 2010). We assigned the volume of water used for pasture and grass crop irrigation to the blue water footprints of beef and milk. Our approach does not take into account that it might be contradictory to the objectives of sustainable use of resources to constrain production of livestock commodities when it is based on the grazing of extensive pastureland, which is otherwise difficult or impossible to exploit by agriculture to produce human food.
We accounted for global food trade by aggregating exported blue and green water, which was calculated for each foodstuff and each exporting country, into a common pool. Imports of blue and green water were then assigned to specific countries in relation to imported and produced food group quantities, as similarly done by Kummu et al (2012). Food group exports and imports were derived from FAO commodity balance sheets (FAO 2013). Therefore, our methodology does not account for trade relations between specific countries, which also change over time. While it is already challenging to trace current and historical flows of green and blue water embodied in processed products and in livestock commodities between specific countries, import and export relationships would certainly be completely reorganized under large-scale diet changes. Modelling these potential changes in trade flows was out of the scope of this study. We find that the aggregated imports and exports better highlight the intrinsic water footprint effect of a national diet, without emphasising the volatile trade matrix between countries.
3. Results
All of the calculations were done at the national scale, but the results were additionally aggregated to the regional and global level. Countries were assigned to regions according to Kummu et al (2010), who adopted the regions from the UN (2000). In the following sections, the baseline situation with the original food supply figures (2007–2009) is briefly introduced first, followed by the results of shifting to the recommended diets and, further, to limited animal protein diets.
3.1. Original diets (2007–2009)
We found a large variability in national diets, which are in distinct agreement with the quite broadly defined WHO dietary recommendations. The largest differences to the guidelines were in vegetable consumption, but there were appreciable deviations in all of the other diet quality related aspects as well. Nevertheless, the world average diet was well balanced at 11% of the energy intake from protein (recommendation 10–15%) and 27% from fat (15–30%), and the total energy intake was 2446 kcal/cap/d (population weighed average ADER is 2357 kcal/cap/d) (table 3). Of the total protein intake, on average, one-third originated from animal-based foodstuffs (figure 1), which represented 17% of the total energy intake. Even the global average of fruit and vegetable consumption of 443 g/cap/d was higher than the recommended minimum of 400 g/cap/d. The baseline water footprints for the global food consumption were 2350 l/cap/d for green water and 388 l/cap/d for blue water, respectively (table 3). We found a large variation between the countries in the baseline dietary status in total food intake, as well as in the composition of the diet, as shown below.
Table 3. Diet characteristics and water footprint changes in two regions with different dietary energy sufficiency (see scenario descriptions in table 2). OD stands for Original Diet, RD stands for Recommended Diet and A0 stands for diet with no animal protein content (except fish).
| Decreasing food intake | Increasing food intake | ||
|---|---|---|---|
| (overeating) | (food intake deficiency) | Global | |
| Number of countries: | 102 | 74 | 176 |
| Number of people: | 4.3 billion | 2.3 billion | 6.6 billion |
| Original Diet (OD) | |||
| Dietary energy, kcal/cap/d | 2607 | 2138 | 2446 |
| ADER, population weighted average | 2408 | 2259 | 2357 |
| Blue water footprint, l/cap/d | 360 | 442 | 388 |
| Green water footprint, l/cap/d | 2563 | 1943 | 2350 |
| Protein content, g/cap/d (% of dietary energy) | 75.1 (11.5%) | 58.0 (10.3%) | 68.4 (11.2%) |
| Fat content, g/cap/d (% of dietary energy) | 85.1 (29.4%) | 50.7 (21.4%) | 73.3 (27.0%) |
| Changes from OD to RD | |||
| Dietary energy change, kcal/cap/d | −199 (−7.6%) | 121 (5.7%) | −89 (−3.6%) |
| Blue WFP change, l/cap/d | −23 (−6.3%) | 29 (6.6%) | −5 (−1.3%) |
| Green WFP change, l/cap/d | −144 (−5.6%) | 127 (6.6%) | −51 (−2.2%) |
| Protein content change, g/cap/d (resulting % of dietary energy) | −2.2 (12.9%) | 5.0 (10.7%) | −0.3 (11.7%) |
| Fat content change, g/cap/d (resulting % of dietary energy) | −12.6 (28.9%) | 1.3 (20.7%) | −7.8 (25.0%) |
| Changes from RD to A0 | |||
| Blue WFP change, l/cap/d | −64 (−19.0%) | −38 (−8.1%) | −55 (−14.4%) |
| Green WFP change, l/cap/d | −545 (−22.5%) | −349 (−16.8%) | −478 (−20.8%) |
| Protein content change, g/cap/d (resulting % of dietary energy) | −10.3 (10.8%) | −2.7 (10.3%) | −7.7 (10.4%) |
| Fat content change, g/cap/d (resulting % of dietary energy) | −28.9 (16.3%) | −12.6 (15.7%) | −23.3 (16.3%) |
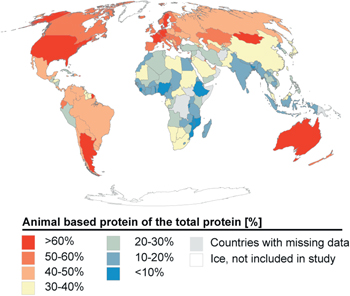
Figure 1. Contribution of animal-based protein (meat, milk, eggs) to the original diet, % of total protein.
Download figure:
Standard image High-resolution image3.2. Recommended diets for all
Adjusting diets to the recommendations (i.e., RD scenario) reduced global dietary energy consumption by 3.6%, which showed that the world food supply, even after losses, is more than adequate from the energy intake perspective. However, the distribution of food is far from even. Food intake decreased in 102 countries, with a total population of 4.3 billion because of the adjustment, whilst it increased in 74 countries with a total population of 2.3 billion (table 3). The average reduction of energy intake in the countries with a decreasing food intake was 199 kcal/cap/d, while in the countries with an increasing food intake, the required addition was 121 kcal/cap/d. The percentage of energy from protein increased globally from 11 to 12% (recommendation 10–15%), and the contribution of fat to the energy intake decreased from 27 to 25% (recommendation 15–30%). Very different adjustments were, however, required for individual countries (figures 2(B) and (C)).
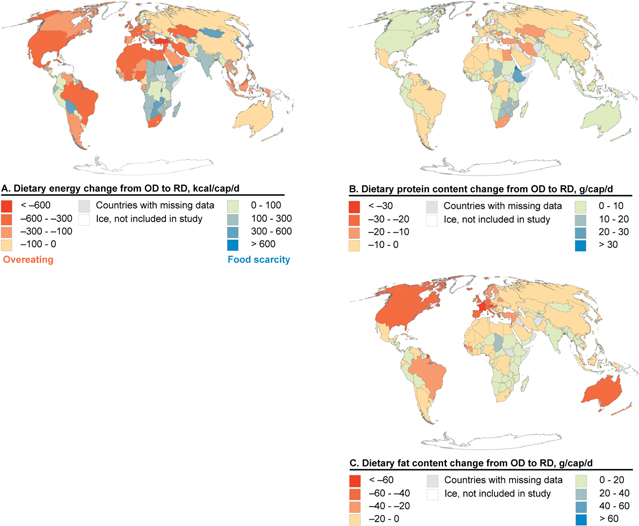
Figure 2. Changes in diet characteristics by adjustment from the Original Diet (OD) to the Recommended Diet (RD) (A). Change in daily dietary energy intake when adjusted to ADER (average dietary energy requirement). (B). Change in daily protein content when adjusted to conform to the WHO recommendation (10–15% of total energy). (C). Change in dietary fat content when adjusted to the WHO recommendation (15–30% of total energy).
Download figure:
Standard image High-resolution imageThe changes in global water footprints under the RD scenario (figure 3(A), 4(A) and (B)) followed the dietary adjustments: the global blue water footprint declined by 1%, and the green water footprint declined by 2% (table 4), with large differences between the countries (figures 4(A) and (B)). In terms of blue water, a slight increase was calculated for large parts of Africa, South and Southeast Asia and Western South America. The largest increases were obviously found for countries suffering from undernourishment. The largest decreases in blue water use were calculated for Kazakhstan, Portugal and Iran. In terms of green water, the changes were mostly rather modest. The notable increases were concentrated in Africa—especially toward the south—and in Bolivia, due to its need for an increased food supply. The largest decreases were observed in Niger and in Burkina Faso, where the shift from cereals towards fruits and vegetables were accountable for the change. Also, many countries around the Mediterranean, as well as Kazakhstan, showed a notable decrease in green water use (figure 4(B)).
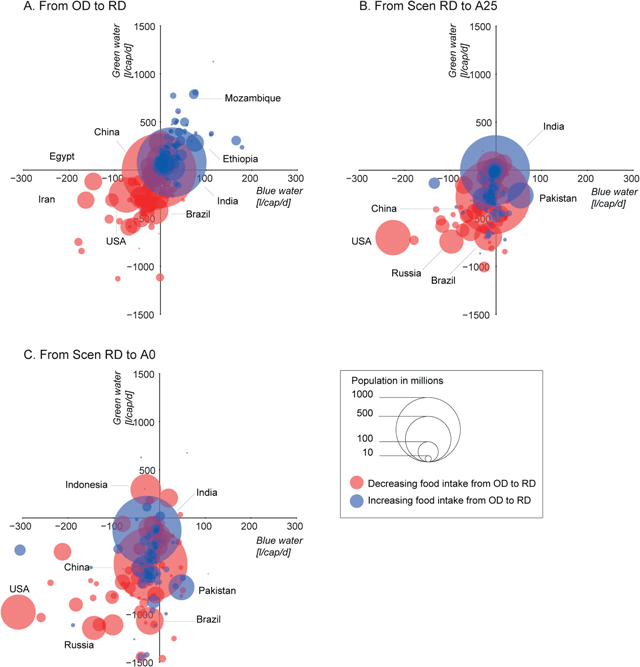
Figure 3. (A). Water footprint changes adjusted from the Original Diet (OD) to the Recommended Diet (RD). (B). Water footprint changes adjusted from RD to A25. (C). Water footprint changes adjusted from RD to A0 (see the scenario descriptions in table 2).
Download figure:
Standard image High-resolution image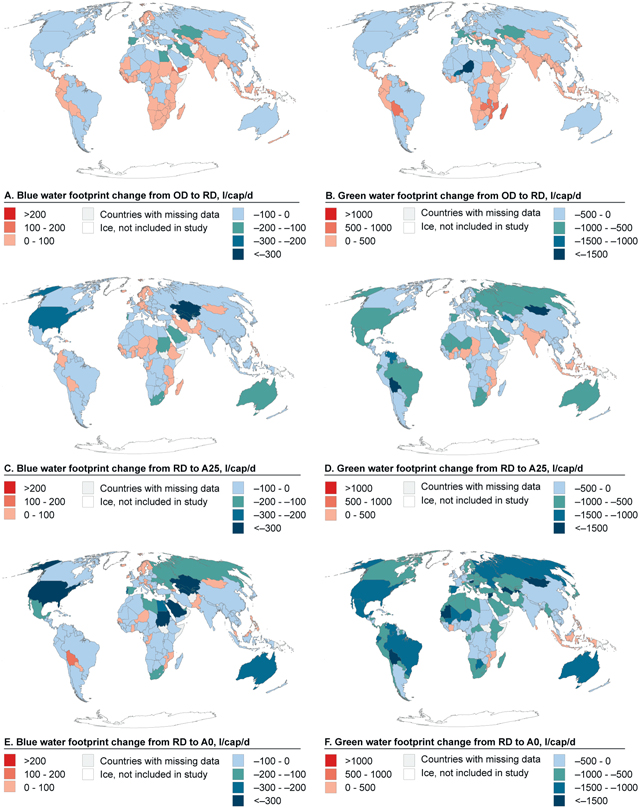
Figure 4. Changes of water footprints by country due to diet adjustments (see the scenario descriptions in table 2). (A): blue water footprint change from OD to RD; (B): green water footprint change from OD to RD; (C): blue water footprint change from RD to A25; (D): green water footprint change from RD to A25; (E): blue water footprint change from RD to A0; and (F): green water footprint change from RD to A0.
Download figure:
Standard image High-resolution imageTable 4. Global protein, energy and water use in the different scenarios (see scenario descriptions in table 2). OD stands for Original Diet, RD stands for Recommended Diet and A50-A0 to diets with limited animal protein content.
| OD | RD | A50 | A25 | A12.5 | A0 | |
|---|---|---|---|---|---|---|
| Animal-based protein (% of total) | 33.3% | 31.2% | 24.7% | 17.6% | 11.0% | 0% |
| Animal-based energy intake (% of total) | 16.6% | 16.3% | 12.6% | 8.5% | 5.2% | 0% |
| Blue water use (% difference to RD) | +1.3% | 0% | −3.8% | −6.4% | −8.9% | −14.4% |
| Green water use (% difference to RD) | +2.2% | 0% | −6.0% | −11.0% | −15.1% | −20.8% |
3.3. Four scenarios with reduced animal protein content
In scenarios A50–A12.5, the reduction in blue water consumption was rather modest (−4% to −9%, table 4). Scenario A0, in which all animal products were removed from the diet, had a more appreciable effect: a 14% reduction (figures 5 and 6). The green water savings were larger than those for the blue water, e.g., reaching a reduction of 15% in A12.5 and 21% in A0 (figures 5 and 6, table 4).
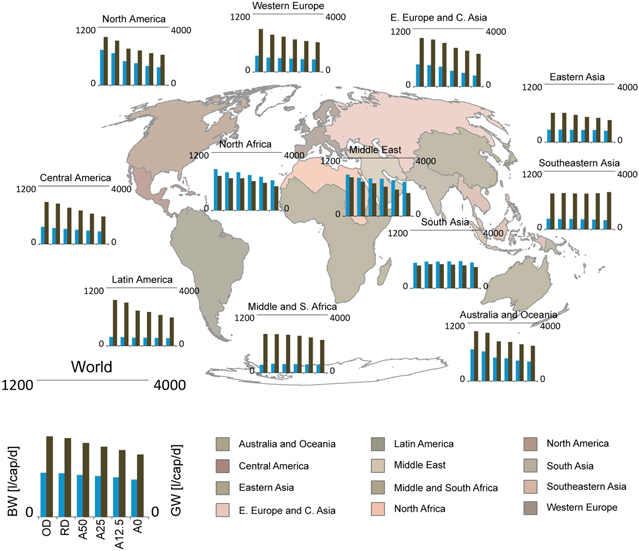
Figure 5. Global and regional green water footprint (GW; green bars) and blue water footprint (BW; blue bars) values [l/cap/d] for the Original Diet and over the five scenarios (RD-A0). Note different scales for green and blue water (see scenario descriptions in table 2).
Download figure:
Standard image High-resolution image
Figure 6. Composition of water footprints of different diet scenarios for the main food groups. (A):blue water; (B): green water. See scenario descriptions in table 2.
Download figure:
Standard image High-resolution imageThe differences in the contribution of animal products to the protein supply (figure 1) caused large differences in the change of water footprints between the regions (figure 5). In Southeast Asia and South Asia, as well as in Sub-Saharan Africa, the water savings by diet change were quite limited, and some parts of Asia even showed some increases when stricter limits were imposed. These areas already have low animal protein content in their original diet. In contrast, both blue and green water footprints decreased clearly across the scenarios in North America, Australia and Oceania. In these regions, the biggest decrement was from RD to A50, as the original diets were rich in animal protein, which was well over the limit of A50. In Latin America, Western Europe and Eastern Asia, mainly the green water footprint was reduced.
The effects of shifting away from animal-based diets on water footprints were much more notable at the country level than at the global scale (figures 3(B) and (C), figures 4(C)–(F)). In 140 countries, the blue water footprint was smaller in A0 than in RD (figures 3(C), 4(E)), while it increased in 36 countries. In 166 countries, the green water footprints decreased between RD and A0 (figures 3(C), 4(F)), with increasing footprints in 10 countries.
The results allow the identification of two factors explaining the low reduction—or even the increase—of blue water footprints when animal protein in the diet was reduced. First, the high protein content of animal products requires a large amount of compensating vegetal products. The second explanation is the relatively high proportion of irrigated agricultural land used for the production of cereal crops (61%), while only 7.4% of the irrigated land is used for fodder and as pasture (FAO 2012a). While oilseeds and roots have a smaller blue water footprint per gram of protein than animal products (apart from fish), cereals—the largest protein source in most countries—have a higher one. The global averages for water footprints per gram of dietary protein are presented in supplement tables S2 and S3.
4. Discussion
We found that reducing animal product consumption would impact global green water use by reducing it up to 21%, while the effect on blue water use in food production would be slightly smaller, 14% at most. Our study considerably extends the current understanding of diet change impacts on water consumption on a global scale, as previous studies have been done at either the regional or national level (Vanham et al 2013, Renault and Wallender 2000, Ercin and Hoekstra 2014, Springer and Duchin 2014) or for only specific foodstuffs or diets (Baroni et al 2006, Marlow et al 2009, Reijnders and Soret 2003). Further, our findings provide complementary information on existing global estimates of diet change impacts on the global food supply (Foley et al 2011) and comparable information on, for example, food loss reduction on the global food supply (Kummu et al 2012).
4.1. Comparing water saving potential with other studies
Vanham et al (2013) conclude that a healthy European diet conforming to regional recommendations could save 3–30% in total water consumed for food production in Europe, while a lacto-ovo vegetarian diet would result in a savings of 27–41%, compared to current eating habits. Our results for Europe, without East European countries, are within their ranges; RD, with only dietary recommendations applied, decreased total water consumption by 13%, whilst A0 decreased the total water footprint by 30% compared to the Original Diet. It should be noted that healthy diet compositions by Vanham et al (2013) are designed with more attention to health effects and foodstuff availability than could be achieved by our minimal change methodology.
Springer and Duchin (2014) proposed that a dietary energy supply of 3000 kcal/cap/d, and limiting protein from animal products to 20%, would be sustainable goals in developed countries. Ercin and Hoekstra (2014) also determined diet change to be an important component of a sustainable future. The scenarios in these two papers combine a number of factors, and while the results point at the same direction as those of this study, the effect of dietary change alone cannot be accurately compared.
Renault and Wallender (2000) compare the American diet to diets with reduced animal product content. They found that a diet with a 50% reduction in animal products would reduce total water use by 37%. Our A25, with a slightly higher animal product reduction, provided a savings of 25% for the US. With regard to a lacto-ovo vegetarian diet, Renault and Wallender (2000) found a 52% reduction of water use. This is higher than the 35% water footprint reduction of our A0, even though we removed all of the animal products except fish.
Our results can also be compared with other suggested actions to increase food availability or to reduce the environmental burden of food production. By adjusting diets to the recommended energy intake and composition, total water footprints would be reduced from 2738 l/cap/day to 2682 l/cap/day, while a diet without meat, milk and eggs would reduce the global mean water footprint further to 2149 l/cap/day. The use of current volumes of water with a lower dietary water footprint would allow the production of more food to feed an additional 136 million people (RD scenario) or even 1.8 billion people (A0 scenario). This would, however, require that similar improvements of efficiencies are possible for other resources used in food production, as well the avoidance of improvements in water use and in the increased food supply, which would cause an additional environmental burden with regard to other resources (e.g., crop nutrients, land).
Kummu et al (2012) found that halving losses and waste within the food supply chain (Kummu et al 2012) could reduce cropland area by 11% and blue water use for food production by 12%, or it could allow the production of food for one billion extra people. Our scenario, A25, represents a case where the protein intake from animal-based foodstuff is decreased by 47% (see table 4). This would lead to a reduction of green water use by 11%, comparable with the impacts of halving food losses (Kummu et al 2012). As green water availability depends on the hydrological cycle, its use is, in the end, a measure of cropland use. In terms of blue water, savings similar to those of halving food losses would require total abstinence from animal products (i.e., scenario A0, 14% decrease). Further, Foley et al (2011) estimated that shifting away from animal-based foods could add up to 49% to the global food supply without expanding croplands. This is a maximum savings potential that assumes full abstinence from animal products and no qualitative diet optimisation. Foley et al (2011) also noted that some amount of animal-based foods in diets provide benefits, and they suggest moderating their use instead of abandoning them. Our results can be viewed as quantifying some of the impacts of the moderation suggested by Foley et al (2011), while also taking dietary requirements into account.
Differences in resource savings between our study and the others presented are due, at least in part, to the fact that our analysis was based on diets conforming to the WHO nutritional recommendations. Not only did we scale the energy intake to a locally recommended value, but we also shifted the balance between food item groups to represent a qualitatively acceptable diet. This improvement had a cost in terms of water resources, as without it, water savings in scenario A0 would have been 4 percentage points higher for green and 1 percentage point higher for blue water. Moreover, our approach was based on existing dietary habits and assumed the smallest changes possible to reach the scenario criteria (table 2). We also took food losses and waste into account in our calculations. Further, we included the irrigation (i.e., blue water use) of pasture and grass feed, which are not taken into account in other studies based on the same water footprint data (Mekonnen and Hoekstra 2010). Without this additional water use, blue water reduction would be negligible in A50 and A25, and even full abstinence from animal protein would only save 7% blue water. Therefore, our approach resulted in an increased understanding of the practical potential for worldwide water savings by dietary choices.
4.2. Diet change—solution to water scarcity?
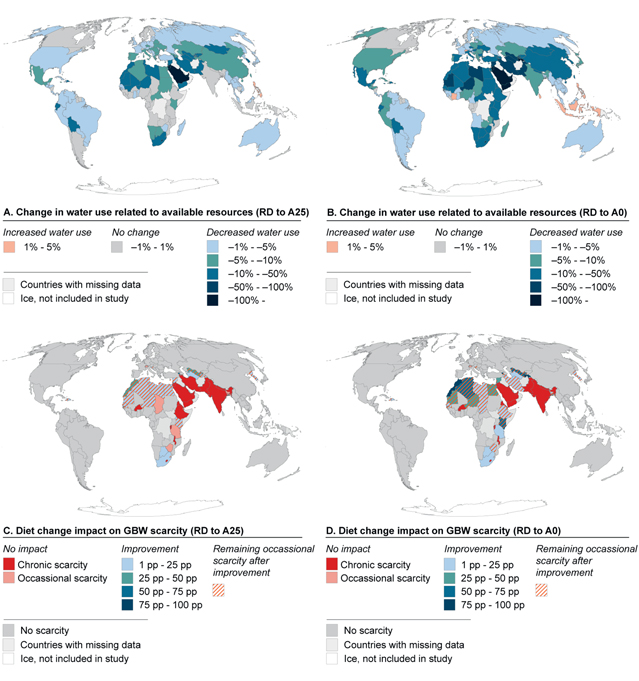
The relative importance of water savings with diet change strongly depends on the available water resources of a specific country. To quantify this, we compared the water use change of scenarios A25 and A0 (in relation to the RD scenario) to available green-blue water (GBW) resources (Kummu et al 2014) at the country level. The largest relative savings from diet change were achieved on water scarce areas in the Middle East (up to 371% in A25 and up to 559% in A0), Africa (34% and 79%), Central and East Asia (40% and 74%) and in some Latin American countries (17% and 25%) (figures 7(A) and (B)).
Figure 7. Diet change impact on available water resources and on green-blue water (GBW) scarcity. (A): Change in water use (green + blue) in relation to available water resources from RD (Recommended Diet) to A25 (animal protein limited to 25% of total protein). (B): Change in water use in relation to water resources from RD to A0 (animal protein limited to 0% of total protein). (C): Diet change impact on GBW scarcity (percentage points decrease in years with scarcity) from RD to A25. Chronic scarcity represents the situation when the country is under GBW scarcity every year, while occasional scarcity refers to situations when scarcity occurs in 1%–99% of the years (see more in Kummu et al 2014). (D): Diet change impact on GBW scarcity from RD to A0.
Download figure:
Standard image High-resolution image
We further assessed the potential of diet change to alleviate GBW scarcity by calculating its impacts on the frequency of GBW scarcity, calculated by (Kummu et al 2014), who based their calculations on the method developed by Gerten et al (2011). Although our RD diet differs somewhat from the reference diet by Kummu et al (2014), we assumed that the relative changes in water use could be applied to their GBW scarcity results. It should also be noted that the approach by Kummu et al (2014) assumes a scenario where all food is produced locally, whereas in our approach, food trade is accounted for. We present the results in percentage points, representing the decrease in the percentage of years with water scarcity (figures 7(C) and (D)). The impact is greatest in Africa, although even there, diet change alone is not sufficient to completely eliminate the GBW scarcity. In total, the A25 scenario removed the GBW scarcity from 67 million people and reduced the frequency from 376 million people, whilst for the A0 scenario, these were 168 million and 637 million, respectively.
4.3. Impact of reduced fat and proteins
The savings in water consumption come from several factors. The total dietary energy consumption was kept constant between the scenarios A50–A0, but the nutritional composition was allowed to change within the range of WHO recommendations (see table 1).
This resulted in the protein and fat content of the food intake decreasing (11% and 36%, respectively, for A0 vs RD) when the use of animal products was restricted. This shifts the consumption towards carbohydrates that, in practice, provide the rest of the food energy. To quantify the impact of reduced fat and proteins, we generated the diets of the A50–A0 scenarios as well, which included constant protein and fat content but was still within the optimisation constraints. This was not possible for all of the countries; however, by pushing the optimisation as far as was practical without manual intervention, a global increase of 7% in green water use was observed in A0. With blue water, the difference was minimal: under +1%.
It can thus be said that the water savings we observed were partly realised because animal products were replaced from the energy perspective, and protein content was not preserved. Nevertheless, the scenarios follow the dietary recommendations used; and while for some countries, the calculated food composition may not be completely practical, the results offer a meaningful insight into the potential of decreasing water consumption in food production without sacrificing nutritional needs.
4.4. Limitations and the way forward
In this analysis, we concentrated on the impacts of different diets on water use, but there are many factors that affect the practicality of replacing the products of one food group with those of another. For example, soil and fertiliser requirements may differ from one group to another. Greenhouse gas emissions of different foods is another factor to be considered, although according to studies (Pradhan et al 2013, Smith et al 2013), a shift towards diets with less animal products would be beneficial also from this point of view.
We acknowledge that there may be overwhelming obstacles in changing the food production chains, as well as convincing consumers to suddenly and drastically change their eating habits. This is why the existing consumption patterns within each food item group were kept intact when shifting the intake between them. Moreover, this article merely concentrates on estimating the potential to reduce water use by changing diets, without assessing the social or technical aspects of it.
We assumed throughout that agricultural practices would remain unchanged, which means that water footprints of different food item groups per mass unit would remain similar, even though total production amounts might change. This is not necessarily true. For example, if an increasing amount of a specific agricultural product is needed, the production may spread to less favourable areas that are not able to sustain the crop or livestock with rainwater, which would increase blue water consumption. It is important to notice that the increase in blue water consumption in many countries in our scenarios is not due to this factor, as it is currently unaccounted for—it is simply the result of a shift between the food groups. With regard to animal-based food, we assumed that the ratio of different types of production systems stays constant throughout the scenarios. As water footprints of grazing livestock are often larger than those of animals kept in an industrial setting (Mekonnen and Hoekstra 2012), there is the potential for resource optimisation in future studies.
If water and cropland savings are sought, the practical steps should be considered carefully. Permanent meadows and pastures that mainly provide feed for grazing livestock account for almost 70% of the world's agricultural land (FAO 2013), but they are not necessarily readily converted for crop production or other uses. Therefore, constraining animal protein production in these areas may not produce concrete resource savings and might even increase the pressure on crop production and thus resources. From this perspective, only livestock fed using directly human-edible crops or feed competing with them for agricultural land should be targeted. On the other hand, the total area used for agricultural production is also important. As pristine natural ecosystems are still being phased out by agriculture (DeFries et al 2010), the efficiency of production in terms of cropland area should be improved (Godfray et al 2010, Tilman et al 2001).
Further, the effect of diet changes on global trade patterns might have unexpected environmental and economic consequences. Foodstuffs replacing meat protein may not be practical to produce in the current meat exporting countries. This restructuring of the global food system would deserve serious attention not only from a natural resource and nutritional perspective, but also from the perspectives of employment, the security of supply and self-sufficiency.
Limiting animal-based food content often helps to decrease agricultural sprawl, but as we have shown, the amount of resources required to produce an acceptable diet are not the same everywhere. This, together with the varying availability of those resources, makes the building blocks for sustainable food composition—whether domestically produced or imported—inherently local. A step forward would be to assess how food production could be optimised in each country, or even globally, from an available resources point of view.
5. Conclusions
Limiting animal product consumption is frequently suggested as one of the methods to alleviate water scarcity. Alternative protein sources with lower water footprints have been assessed, but these studies often concentrate on the resource use of the ingredients, omitting diet composition. Our results indicate that limiting the consumption of animal products and following even simple dietary guidelines would considerably decrease the agricultural green water footprint and thus the cropland demand, while the savings in blue water use would be notable but somewhat smaller. However, we found a large variation in the national results, and even increased blue water use in some countries.
This coarsely specified diet modification alone would, therefore, be insufficient to provide an optimal solution for global water scarcity and food security. However, together with other actions, such as reduction in food loss and waste, diet change would be a notable option to tackle these challenges. As the availability of resources and the impacts of diet change on these resources vary greatly across the globe, recommendations aimed at reducing environmental impact and optimising resources in food production must be considered at a regional and, preferably, at an even more local scale instead of pursuing global generalisations.
Acknowledgements
This work was funded by the Maa- ja vesitekniikan tuki ry, the postdoctoral funds and core funds of Aalto University, the Finnish Cultural Foundation and the Academy of Finland funded project SCART (grant no. 267463). We thank our colleagues at Aalto University for their support and helpful comments. Moreover, the comments and suggestions of Dr Davy Vanham are very much acknowledged. We are grateful for the thoughtful comments and suggestions of the editor and of the two reviewers.