
Abstract
The impact of solar variations on particle formation and cloud condensation nuclei (CCN), a critical step for one of the possible solar indirect climate forcing pathways, is studied here with a global aerosol model optimized for simulating detailed particle formation and growth processes. The effect of temperature change in enhancing the solar cycle CCN signal is investigated for the first time. Our global simulations indicate that a decrease in ionization rate associated with galactic cosmic ray flux change from solar minimum to solar maximum reduces annual mean nucleation rates, number concentration of condensation nuclei larger than 10 nm (CN10), and number concentrations of CCN at water supersaturation ratio of 0.8% (CCN0.8) and 0.2% (CCN0.2) in the lower troposphere by 6.8%, 1.36%, 0.74%, and 0.43%, respectively. The inclusion of 0.2 °C temperature increase enhances the CCN solar cycle signals by around 50%. The annual mean solar cycle CCN signals have large spatial and seasonal variations: (1) stronger in the lower troposphere where warm clouds are formed, (2) about 50% larger in the northern hemisphere than in the southern hemisphere, and (3) about a factor of two larger during the corresponding hemispheric summer seasons. The effect of solar cycle perturbation on CCN0.2 based on present study is generally higher than those reported in several previous studies, up to around one order of magnitude.
Export citation and abstract BibTeX RIS

Content from this work may be used under the terms of the Creative Commons Attribution 3.0 licence. Any further distribution of this work must maintain attribution to the author(s) and the title of the work, journal citation and DOI.
1. Introduction
The Sun supplies most of the energy for the Earth's atmospheric and climate system. There is no doubt that links exist between solar variability and terrestrial climate on century, decade, and shorter time scales (e.g., Reid 2000, Gray et al 2010). However, the effect of measured ∼0.1% level of the long-term total solar irradiance (TSI) variations on climate (i.e., solar direct effect) is generally considered to be too small to account for the observed changes in the Earth's climate. Foukal et al (2006) showed that a TSI variation of at least 3 times larger is required to produce a climate variation of the amplitude suggested by the seventeenth century cooling (Little Ice Age, when the mean temperature was colder by 1 °C). Detailed fits of global and hemispherical temperatures since the mid-19th century with empirical models involving the enhanced greenhouse effect and solar variability require an amplification of irradiance effect by a factor of >2.5 to quantitatively explain the observed global temperature change (e.g., Kelly and Wigley 1992, Lockwood 2001). The necessity of amplifying TSI variation by a factor of around 3 to explain the amplitude of the 11-year solar signature on the temperature record has also been noted (Douglass and Clader 2002, Scafetta and West 2006). Based on variations in the oceanic heat content derived from three independent data sets, Shaviv (2008) found the total radiative forcing associated with solar cycle variations is about 5–7 times larger than just those associated with the TSI variations. The correlation between observed historical solar and climate changes along with the need to amplify the solar irradiance effects to explain observed phenomena may imply the existence of indirect solar forcing which is yet to be accounted for. In order to clearly define the consequences of human activity on climate and accurately predict the climate change on decadal and longer time scales, potential indirect impacts of solar activity on the Earth's climate have to be identified, formulated, and included in the global models.
Several mechanisms for the amplification of the solar variability have been proposed in the literature, including: (1) via ultraviolet (UV) induced changes in stratospheric ozone, heating rate, and planetary wave propagation (i.e., UV–ozone hypothesis) (e.g., Hines 1974, Haigh 1999, Shindell et al 1999), (2) via ionosphere–earth current density induced changes in cloud microphysics (i.e., current density–cloud hypothesis) (e.g., Tinsley and Deen 1991, Harrison and Ambaum 2013), and (3) via solar variation induced changes in condensation nuclei (CN) formation, cloud condensation nuclei (CCN) abundance, and cloud properties (i.e., Sun–CN–CCN–Cloud–Climate hypothesis) (e.g., Dickinson 1975, Eddy 1976, Svensmark and Friis-Christensen 1997, Yu and Turco 2001). We focus this study on a critical issue associated with the third mechanism, i.e., the magnitude of solar variations in modifying particle formation rate and CCN population in the Earth's atmosphere.
Previous global modeling studies indicate that the impacts of solar variation induced modulation of galactic cosmic ray (GCR) flux on aerosols and clouds are overall small but have large variations and are sensitive to the assumptions of secondary particle nucleation and growth processes, primary particle emissions, and the global aerosol models used (Pierce and Adams 2009, Snow-Kropla et al 2011, Kazil et al 2012, Yu et al 2012). Here we seek to assess how much solar variation may affect CCN abundance using a different global aerosol model (GEOS-Chem/APM) that is optimized to resolve detailed particle formation and growth processes and is well validated against various measurements of particle number concentrations. In addition, we propose a new process that enhances the impact of solar cycle variation on global CCN abundance via the dependence of nucleation rate on temperature. The seasonal variations of the impacts are investigated. A comparison of present results with previous studies is also presented.
2. Sun–CN–CCN–Cloud–Climate hypothesis: theoretical description and physics
Clouds play a key role in the energy budget of Earth's surface and lower atmosphere. Small modifications of the amount, distribution, or radiative properties of clouds can have significant impacts on the climate. Tropospheric aerosols impact climate indirectly by acting as CCN and affecting cloud properties and precipitation. The aerosol indirect radiative forcing is largely determined by the number abundance of particles that can act as CCN. At a given water supersaturation ratio, CCN number concentrations depend on the number size distribution and composition of atmospheric particles. Field measurements show clearly that the number concentrations of cloud drops increase with increasing total aerosol number concentrations (e.g., Ramanathan et al 2001). Nucleation frequently observed throughout the troposphere is an important source of global particles. Although the size of freshly nucleated CN is typically only a few nanometers, a substantial fraction of them can grow further and reach CCN size (Yu and Luo 2009). Particle nucleation rates are sensitive to temperature (T), relative humidity (RH), precursor gas concentration, and surface area of pre-existing particles. The ion nucleation rates also depend on ionization rates (Q) (Yu 2010). Any systematic changes in these parameters can influence nucleation and hence aerosol abundance which may have important climatic implications.
Figure 1 shows schematically one of possible mechanisms amplifying the effect of solar variability through solar–CN–CCN–cloud–climate processes. Solar activity increase (from solar minimum to solar maximum) reduces GCR flux and hence Q but increases TSI and hence T. Both Q decrease and T increase associated with solar activity reduce particle formation rate (Yu 2010) and thus CN and CCN concentrations in the low troposphere. Through aerosol indirect effects, the reduction in CCN tends to decrease cloud droplet number concentrations and increase radius of cloud droplets, causing a reduction in cloud albedo and an enhancement in precipitation which reduces cloud lifetime and thus enhance cloud cover. The decrease of both cloud albedo and cloud cover associated with solar activity increase reduces the cloud cooling effect and thus increase Earth's temperature. The dependence of nucleation rate on temperature also defines a positive feedback process that may enhance the influence.
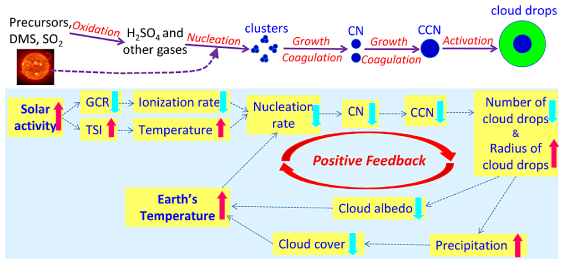
Figure 1. A schematic illustration of a mechanism amplifying the effect of solar variability through the influence of GCR ionization and temperature on particle formation and a positive nucleation feedback (enhanced solar activity → more TSI and less GCR → reduced nucleation and aerosol abundance → less aerosol cooling → increased temperature).
Download figure:
Standard image High-resolution imageThrough analysis of surface temperature data (1959–2004), Camp and Tung (2007) reported a solar cycle amplitude of 0.2 °C in global surface temperature but Lean and Rind (2008) and Sloan and Wolfendale (2011) showed a much smaller amplitude. In a series of diagnostic thermal budget studies of sea surface temperate and ocean heat storage, White et al (2003) and White (2006) showed that the temperature anomalies during the 11-year solar cycle increased upward, from ∼0.15 °C in the tropical lower troposphere to ∼0.25 °C in the tropical upper troposphere and ∼0.8 °C in the tropical lower stratosphere. In one of cases presented below, 0.2 °C is added to the temperature in the whole atmosphere (as a reference perturbation) to assess the possible effect of higher temperature on particle formation rate and number concentrations during solar maximum year.
3. Global modeling with GEOS-Chem/APM
In order to isolate solar variation effects and confidently assess the significance of solar variation induced changes in new particle formation and CCN abundance, a global aerosol model that can treat detailed particle microphysical processes—especially nucleation and growth—is essential. Yu and Luo (2009) incorporated an advanced particle microphysics (APM) model into GEOS-Chem, a global 3D model of atmospheric composition driven by assimilated meteorological data from the NASA Goddard Earth Observing System 5 (GEOS-5) (e.g., Bey et al 2001). The GEOS-Chem model has been developed and used by many research groups and contains a number of state-of-the-art modules treating various chemical and aerosol processes with up-to-date key emission inventories (for details, see the model webpage http://geos-chem.org/). The APM model in GEOS-Chem is optimized to accurately simulate the formation of secondary particles and their growth to CCN sizes, using very high size resolution for particles in the size range of 1.2–120 nm (Yu and Luo 2009) and considering explicitly the kinetic condensation of aged low volatile secondary organic gases (Yu 2011). Our previous validation studies indicate that the GEOS-Chem/APM predicted total particle and CCN number concentrations agree well with a comprehensive set of land-, ship-, and aircraft-based measurements (Yu and Luo 2009, Yu et al 2010, 2012).
The results presented below are based on a one-year simulation (10/2005–12/2006, with the first 3 months as spin-up) using GEOS-Chem v8-03-02 + APM, with nucleation rates predicted by the IMN mechanism (Yu 2010) and the kinetic condensation of low volatile secondary organic gases from successive oxidation aging taken into account (Yu 2011). The horizontal resolution is 2° × 2.5° and there are 47 vertical layers in the model (surface to 0.01 hPa). The global ionization rates due to cosmic rays are calculated based on the schemes given in Usoskin and Kovaltsov (2006) and the contribution of radioactive materials from soil to ionization rates is parameterized based on the profiles given in Reiter (1992). To study solar variation effects, three runs were inter-compared; the first one is the baseline case assuming ionization rate corresponding to a solar minimum year with maximum Q (Case Qmax); the second one is the same as the Case Qmax except that ionization rates corresponding to a solar maximum year were used (Case Qmin); and the third one is the same as the Case Qmin except, for the nucleation rate calculation, 0.2 °C is added to the temperature in the whole atmosphere to account for the higher temperature during solar maximum year (Case QminT0.2). We would like to emphasize that the effects of Q and T changes are limited to the calculations of nucleation rates only so that we can isolate the impact of Q and T changes during a typical solar cycle on particle number concentrations.
The impacts of Q changes from solar minimum (Case Qmax) to solar maximum (Cases Qmin and QminT0.2) on particle formation rates and number concentrations in the lower troposphere (LT) where warm clouds form (∼0–3 km) are presented in table 1 and figure 2. For comparisons, corresponding results averaged in the whole troposphere (WT) and those available from several previous studies are also given in table 1. The solar modulation of Q is calculated with the model of Usoskin and Kovaltsov (2006) which has been used in several previous studies (Pierce and Adams 2009, Snow-Kropla et al 2011, Yu et al 2012). It should be pointed out that there exists difference in the modeled and measured cosmic ray change across the solar cycle, with the modeled values based on Usoskin and Kovaltsov (2006) apparently greater (e.g., Sloan et al 2011). According to Usoskin and Kovaltsov (2006), the decrease of Q from Qmax year to Qmin year ranges from ∼5% in the tropical boundary layer (BL) to ∼15% in the BL at high altitudes and up to ∼30% in the upper troposphere. Based on the GEOS-Chem simulations, such a decrease in Q reduces nucleation rates in a large part of LT, with global average reduction of 6.8% (table 1). The decrease in the global mean CN3, CN10, CCN0.8, CCN0.4, and CCN0.2, associated with Q decrease only from solar minimum (Qmax) to maximum (Qmin), are 1.91%, 1.36%, 0.74%, 0.54%, and 0.43%, respectively (table 1). The inclusion of the impact of 0.2 °C temperature increase (figure 1) (i.e., Case Qmax to Case QminT0.2) leads to LT CN3, CN10, CCN0.8, CCN0.4, and CCN0.2 reduction of 2.74%, 1.95%, 1.13%, 0.84%, and 0.67%, respectively. The temperature effect enhances the CCN solar cycle signals by around 50%. The signals of solar cycle perturbation decrease as particle sizes increase, which is a result of particle coagulation and competition for condensable gases. The effect of solar cycle perturbation on CCN0.2 based on the present study is about a factor of 5–10 larger than those based on Pierce and Adams (2009) and Snow-Kropla et al (2011). The CN3 signal of the present study for Qmax → QminT0.2 cases is about 60% higher than that of Kazil et al (2012) but is close for Qmax → Qmin cases. No global mean CCN perturbation values were given in Kazil et al (2012). Compared to Yu et al (2012) which was based on a global climate model with modal aerosol approach, CCN0.2 change in the present study is close but CN10 is much bigger. These differences are likely a result of different model representation of aerosol microphysics and assumptions.
Table 1. Globally and annually averaged nucleation rate (J, in # cm−3 s−1), number concentrations (in # cm−3) of condensation nuclei larger than 3 nm (CN3) and 10 nm (CN10), CCN at water supersaturation of 0.8% (CCN0.8), 0.4% (CCN0.4), and 0.2% (CCN0.2) in the lower troposphere (LT, averaged within lowest 18 model layers, surface to ∼3 km) and whole troposphere (WT, averaged within lowest 31 model layers, surface to ∼12 km) for three cases (Qmax, Qmin, and QminT0.2, as defined in the text), as well as the corresponding changes from Qmax to Qmin and Qmax to QminT0.2.
| Present studies | Other studies | ||||||
|---|---|---|---|---|---|---|---|
| Qmax | Qmin | QminT0.2 | Qmax → Qmin change | Qmax → QminT0.2 change | Qmax → Qmin change | ||
| J | LT | 0.0234 | 0.0218 | 0.0213 | −6.8% | −9.0% | |
| WT | 0.0292 | 0.0284 | 0.0281 | −2.9% | −3.7% | ||
| CN3 | LT | 793.0 | 777.9 | 771.3 | −1.91% | −2.74% | |
| WT | 742.7 | 736.7 | 733.9 | −0.82% | −1.18% | −0.73% |
|
| CN10 | LT | 603.4 | 595.2 | 591.6 | −1.36% | −1.95% | |
| WT | 421.7 | 418.5 | 417.3 | −0.75% | −1.03% | −0.25% |
|
| CCN0.8 | LT | 339.7 | 337.1 | 335.8 | −0.74% | −1.13% | |
| WT | 175.0 | 174.0 | 173.6 | −0.53% | −0.79% | ||
| CCN0.4 | LT | 233.4 | 232.2 | 231.5 | −0.54% | −0.84% | |
| WT | 107.5 | 107.1 | 106.8 | −0.42% | −0.65% | ||
| CCN0.2 | LT | 164.3 | 163.6 | 163.2 | −0.43% | −0.67% | |
| WT | 69.1 | 68.9 | 68.7 | −0.38% | −0.59% | −0.08% |
|
aPierce and Adams (2009). bBaseline case of Snow-Kropla et al (2011). cKazil et al (2012). dYu et al (2012).

Figure 2. Impacts of changes in ionization rates and temperature during a solar cycle (from solar minimum to solar maximum, Case Qmax → Case QminT0.2) on annual mean (a) nucleation rate, (b) condensation nuclei larger than 3 nm (CN3), (c) CCN at water supersaturation ratio of 0.8% (CCN0.8, representative of convective clouds), and (d) CCN at water supersaturation ratio of 0.2% (CCN0.2, representative of stratus clouds) in the lower troposphere (0–3 km above the surface, layers 1–18 in the model). The results are based on GEOS-Chem/APM at 2° × 2.5° horizontal resolution for year 2006.
Download figure:
Standard image High-resolution imageIt is apparent from table 1 that the average solar cycle signals are stronger in the LT than in the WT. The difference is about a factor of two for nucleation rates and small particles (CN3 and CN10), but is less significant for larger particles (∼40% for CCN0.2 and ∼10% for CCN0.2). The main reason of the altitude-dependent strength of solar cycle signals is that the new particle formation in the upper troposphere is limited by the concentrations of precursor gases rather than ionization rates and temperature. The difference becomes smaller for larger particles because most of these particles locate in the LT. As far as the Sun–CN–CCN–Cloud–Climate hypothesis is concerned, LT is more relevant as warm clouds are subjective to the influence of CCN change while ice clouds in the upper troposphere are affected more by ice nuclei instead of CCN.
The impacts of GCR and TSI changes and associated temperature feedback processes on LT CCN abundance have large spatial (figure 2) and seasonal (figure 3) variations. The annual mean CCN signals in the northern hemisphere (NH) are about 50% larger than those in the southern hemisphere (SH). CCN solar cycle signals are relatively weaker in the tropical and southern ocean regions. In middle and high latitudes, solar cycle signals in CCN are about a factor of two larger during the corresponding summer seasons (JJA for NH and DJF for SH). The zonally averaged perturbations to CCN0.8 and CCN0.2 in JJA reach 1.8% and 1.2%, respectively, around 50°N from Case Qmax to Case QminT0.2. The regions and seasons of stronger solar signals are associated with the higher concentrations of precursor gases, mainly sulfuric acid gas and low volatile secondary organic gases (Yu and Luo 2010, Yu 2011), which increase the growth rate of nucleated particles and the probability of these nucleated particles to become CCN. The large spatiotemporal variations of CCN solar cycle signals imply that the response of cloud properties, if discernible, to the potential solar cycle forcing may vary with locations and seasons. The magnitude of such a response depends also on the maximum water supersaturation ratios during the cloud development, as our study indicates that the variations of CCN0.8 (corresponding to convective clouds) in the LT during a solar cycle is about 70% larger than those of CCN0.2 (corresponding to stratus clouds). To study how change in CCN during a solar cycle may affect cloud albedo, precipitation, cloud lifetime, and cloud cover, a global climate model considering robust aerosol–cloud interaction processes for both stratus and convective clouds is needed.

Figure 3. Annually and seasonally averaged zonal mean relative changes of CCN0.8 and CCN0.2 in the lower troposphere (0–3 km above the surface): (a) due to ionization rate change (Qmax → Qmin) only; (b) due to both Q and T changes (Qmax → QminT0.2). DJF (December, January, February), MAM (March, April, May), JJA (June, July, August), and SON (September, October, November) refer to winter, spring, summer, and fall seasons, respectively.
Download figure:
Standard image High-resolution image
4. Summary and discussion
The measured 0.1% level of the long-term TSI variations on Earth's climate (i.e., solar direct climatic effect) is too small to account for the apparent correlation between observed historical solar variations and climate changes, and several mechanisms amplifying the solar variation impacts have been proposed in the literature. Here we seek to assess how much solar variation may affect CCN abundance through the impacts of GCR and temperature changes on new particle formation, using a global aerosol model (GEOS-Chem/APM) optimized for simulating detailed particle formation and growth processes. Based on the GEOS-Chem/APM simulations, a decrease in ionization rate associated with GCR flux change from solar minimum to solar maximum reduces global mean nucleation rates CN3, CN10, CCN0.8, CCN0.4, and CCN0.2 in the lower troposphere (0–3 km) by 6.8%, 1.91%, 1.36%, 0.74%, 0.54%, and 0.43%, respectively. The inclusion of the impact of 0.2 °C temperature increase enhances the CCN solar cycle signals by around 50%. The annual mean solar cycle CCN signals have large spatial and seasonal variations, about 50% larger than in the northern hemisphere than in the southern hemisphere and about a factor of two larger during the corresponding summer seasons. The average solar cycle signals are stronger in the lower troposphere where warm clouds are formed. The regions and seasons of stronger solar signals are associated with the higher concentrations of precursor gases which increase the growth rate of nucleated particles and the probability of these nucleated particles to become CCN. The effect of solar cycle perturbation on CCN0.2 based on the present study is generally higher than those reported in several previous studies, up to one order of magnitude.
Clouds play a key role in the energy budget of Earth's surface and lower atmosphere. Small modifications of the amount, distribution, or radiative properties of clouds can have significant impacts on the climate. To study the impacts of a 0.5%–1% change in CCN during a solar cycle on cloud albedo, precipitation, cloud lifetime, and cloud cover, a global climate model considering robust aerosol–cloud interaction processes is needed. It should be noted that 0.5%–1% change in CCN during a solar cycle shown here only considers the effect of ionization rate and temperature change on new particle formation. During a solar cycle, changes of other parameters such as UV and TSI flux may also impact chemistry and microphysics, which may influence the magnitude of the solar indirect forcing. Further research is needed to better quantify the impact of solar activities on Earth's climate.
Acknowledgments
This study is supported by NASA under grant NNX11AQ72G and NSF under grant AGS-0942106.