
Abstract
Power utility companies in the United Kingdom are using imported wood pellets from the southern region of the United States for electricity generation to meet the legally binding mandate of sourcing 15% of the nation's total energy consumption from renewable sources by 2020. This study ascertains relative savings in greenhouse gas (GHG) emissions for a unit of electricity generated using imported wood pellet in the United Kingdom under 930 different scenarios: three woody feedstocks (logging residues, pulpwood, and logging residues and pulpwood combined), two forest management choices (intensive and non-intensive), 31 plantation rotation ages (year 10 to year 40 in steps of 1 year), and five power plant capacities (20–100 MW in steps of 20 MW). Relative savings in GHG emissions with respect to a unit of electricity derived from fossil fuels in the United Kingdom range between 50% and 68% depending upon the capacity of power plant and rotation age. Relative savings in GHG emissions increase with higher power plant capacity. GHG emissions related to wood pellet production and transatlantic shipment of wood pellets typically contribute about 48% and 31% of total GHG emissions, respectively. Overall, use of imported wood pellets for electricity generation could help in reducing the United Kingdom's GHG emissions. We suggest that future research be directed to evaluation of the impacts of additional forest management practices, changing climate, and soil carbon on the overall savings in GHG emissions related to transatlantic wood pellet trade.
Export citation and abstract BibTeX RIS

Content from this work may be used under the terms of the Creative Commons Attribution 3.0 licence. Any further distribution of this work must maintain attribution to the author(s) and the title of the work, journal citation and DOI.
1. Introduction
Global demand for wood pellets is increasing as several power utility companies in the Europe are using or planning to utilize them as a feedstock for electricity generation [1]. It is expected that the utilization of wood pellets will help in meeting national mandates, where a certain percentage of total energy consumed within the country needs to come from various renewable energy sources, including biomass, by the end of 2020 [2, 3]. In recent years, the southern United States has become a major exporter of wood pellets to several European countries [1]. Exports of wood pellets from this region are forecasted to increase from 1.5 to 5.2 million metric tons between 2012 and 2015 [4].
Existing studies [5–7] demonstrate that the GHG intensity of a unit of electricity generated in European countries using imported wood pellets from the United States and Canada is about 65%–80% lower than the GHG intensity of a unit of grid electricity depending upon whether natural gas or wood residues were used to dry wood pellets in a wood pellet plant. These studies typically assume that the feedstock needed for manufacturing of wood pellets was sourced from a nearby forest area or a wood processing facility which was located at a fixed distance from the wood pellet plant (table 1).
Table 1. Distances traveled to source required feedstock for manufacturing of wood pellets.
| Serial no. | Details and distances | References |
|---|---|---|
| 1 | Wood is transported to a wood pellet plant from forested area (81 km) | [5] |
| 2 | Wood is transported to a sawmill from forestlands (110 km) | [6] |
| Sawmill residues are transported to a wood pellet plant (27 km) | ||
| 3 | Wood is transported to a sawmill (75 km) | [7] |
| Wood is transported to a chip mill (50 km) | ||
| Sawmill residues are transported to a wood pellet plant (0 km) | ||
| Wood chips are transported to a wood pellet plant (75 km) |
This is a limiting assumption for three main reasons. First, several harvest tracts are needed to supply required wood to a nearby wood pellet plant on an annual basis depending upon the capacity of the wood pellet plant; second, wood is immediately transported from a harvested tract to a wood pellet plant by loggers to meet the daily needs of the wood pellet plant and therefore, distance between each harvested tract and a wood pellet plant must be summed for ascertaining GHG emissions related with the transportation of required wood for wood pellets production; and third, harvested tracts are distributed across a landscape and chances that all harvested tracts are located at a fixed distance from a wood pellet plant are practically nil. These points are particularly valid for the southern United States as 87% of forestland is privately owned in this region [8], considerable variability exists among forestland owners about the objectives of forest management [9], and forestlands are part of a heterogeneous landscape where competing land uses coexist [10].
Furthermore, existing studies consider only one harvest cycle while determining GHG savings of electricity generated from imported wood pellets in Europe. This raises concerns among environmentalists and other stakeholders [11]. Again, this is a limiting assumption as forestland owners repeatedly use their forestlands for raising plantations especially in the southern United States. Therefore, average annual quantities of feedstocks available over time instead of quantities of feedstocks available at the time of harvest should be considered for determining GHG savings of electricity generated using imported wood pellets.
This study combines a simulation-based landscape approach with life-cycle assessment [12, 13] to ascertain relative savings in GHG emissions when imported wood pellets from the southern United States are used as a feedstock for electricity generation at a power plant located in Selby, United Kingdom [14]. The largest coal-fired power plant in the United Kingdom is situated at this location. Recently, the management of this power plant decided to generate about 1000 MW of electricity using imported wood pellets from the southern United States [14].
The following seven steps were part of the transatlantic wood pellet trade supply chain: (a) production of woody feedstocks; (b) transportation of woody feedstocks from harvested tracts to a wood pellet plant using log-trucks; (c) manufacturing of wood pellets at a wood pellet plant; (d) transportation of wood pellets from a wood pellet plant to New Orleans Seaport in the United States using railroads; (e) transatlantic shipment of wood pellets from New Orleans Seaport in the United States to Immingham Seaport in the United Kingdom; (f) transportation of wood pellets from Immingham Seaport in the United Kingdom to Selby, United Kingdom using railroads; and (g) burning of wood pellets to generate electricity at a power plant located in Selby, United Kingdom. The functional unit selected for this study was a unit of electricity generated from wood pellets at the power plant located at Selby, United Kingdom. Individual GHG emissions for each step present in the supply chain were summed up and then divided by the total electricity generated at the power plant to estimate GHG intensity of electricity generated using imported wood pellets in the United Kingdom. This GHG intensity was compared with the average GHG intensity of a unit of grid electricity derived from fossil fuels in the United Kingdom to determine relative savings in GHG emissions.
2. Methods
This study assumed that biomass obtained from slash pine (Pinus elliottii) plantations was used for manufacturing wood pellets. Slash pine is a popular commercial forest species of the southern United States. In 2007, longleaf-slash pine occupied about 5.2 million hectares in this region [8]. This species also reflects general constitution of southern forest resources where pine forests (planted and natural) occupy about 32% of total forestland [8]. This study also assumed that the annual quantity of wood pellets needed by the power plant was sourced from a wood pellet plant located in the southern United States. This assumption is valid for two reasons. First, the capacity of wood pellet plants is rising in the southern United States. For example, German Pellets announced a plan to build a new wood pellet plant with an annual capacity of one million metric tons at Urania, Louisiana [15]; and second, several European power utilities are opening their own wood pellet plants in the southern United States to ensure consistent supplies of wood pellets for their power plants located in Europe [16].
A total of 930 different scenarios were selected for this study: three feedstocks (logging residues only, pulpwood only, and logging residues and pulpwood combined), two forest management choices (intensive and non-intensive), 31 rotation ages (year 10 to year 40 in steps of 1 year), and five power plant capacities (20–100 MW in steps of 20 MW). Unlike non-intensive forest management, herbicides (at plantation establishment year) and fertilizers (at 2nd and 12th year of plantation) were applied under intensive forest management. Utilization of pulpwood for manufacturing of wood pellets was considered as evidence suggests that pulpwood is increasingly being utilized for manufacturing of wood pellets to meet rising export demand [17]. Total availability of timber products at a harvest age was divided by the harvest age itself to determine average annual availability of timber products over time. This was done to consider the impact of multiple harvest cycles at a given rotation age on the availability of feedstocks. Biogenic GHG emissions related to burning of bark and wood pellets were not considered under the assumption that harvested tracts were immediately planted after harvest. This assumption is valid as this study uses average annual availability of feedstocks for wood pellet production. This study does not consider above- and below-ground carbon sequestered on forestlands assuming that a forestland owner will continue to follow the same rotation age.
Procedures adopted for determining GHG emissions of all the steps present within the supply chain of transatlantic wood pellets trade are explained below. All distances used in this study are approximate.
2.1. Production of woody feedstocks
A growth and yield model of slash pine was used to estimate availability of three timber products: sawtimber, chip-n-saw, and pulpwood, from a hectare of plantation under intensive and non-intensive forest management choices [18]. Theavailability of logging residues at a harvest age was calculated as the difference between total biomass available in harvested logs and total biomass present in sawtimber, chip-n-saw, and pulpwood at the stand level plus 20% of all biomass present in sawtimber, chip-n-saw, and pulpwood at the same harvest age [19]. The additional 20% biomass was added as a proxy for biomass available in branches and tree tops [19]. Total GHG emission related to plantation management under intensive forest management choice was 4803 kg CO2e ha−1 when the harvest age was equal to or greater than 12 years4. It was 2431 kg CO2e ha−1 when the harvest age was 10 and 11 years [5]5. For non-intensive forest management choice, total GHG emission was 2200 kg CO2e ha−1 for the selected range of harvest ages [5]6. An updated value of nitrous oxide emissions was used based on GREET [20]. These GHG emissions were divided by the harvest age and then allocated to available timber products by the percentage weight contributed by each timber product towards the combined weight of timber products available at that harvest age. Percentages were based on average annual availability of timber products. Collection efficiency of logging residues was taken as 70% only [21]. No GHG emissions were allocated to logging residues when only pulpwood was used as a feedstock under the assumption that logging residues were left in field when not used as a feedstock.
2.2. Transportation of selected feedstocks
The annual quantity of wood pellets required (WPreq in Mg yr−1) by the power plant was estimated using equation (1):

where P is the capacity of the power plant in MW, CF is the power plant capacity factor in percentage, CV WP is the calorific value of wood pellets in MJ kg−1, and CE is the percentage efficiency of converting heat into electricity. For CF, a value of 66.9% based on the average capacity utilization of the power sector in the United Kingdom was used [22]. For CE, steam cycle conversion efficiencies for 20, 40, 60, 80, and 100 MW power plants were taken as 23.4%, 26.9%, 29.1%, 30.6%, and 31.7%, respectively [23]. For CV WP, an average value of 18.5 MJ kg−1 was used [24]. Total quantity of green biomass required (GBreq in Mg yr−1) was estimated using equation (2):

where MCWP is the percentage moisture content of wood pellets on oven dry basis, MCSP is the percentage moisture content of slash pine on oven dry basis, and BK is the percentage of bark weight. The values of MCWP, MCSP, and BK were taken as 5% [5], 69% [25], and 18% [26], respectively.
This study assumed that the shape of a harvest tract was square. Total number of harvest tracts (HTtot) needed to supply required wood was calculated using equation (3):

where WA is woody feedstock available for wood pellet production (Mg ha−1 yr−1) and HTsize is the average harvest tract size in hectares. The average harvest tract size was 36.5 ha for the southern United States [27]. The value of HTtot was rounded to the nearest greater integer. The value of available feedstock was dependent on the type of timber products considered for wood pellet production, harvest age, and forest management choice.
This study assumed that the wood pellet plant was located in the center of a woodshed surrounded by contiguous harvest tracts of similar characteristics (species, age, forest management choice, and size). A woodshed was defined as an area from which wood was sourced for manufacturing of wood pellets by an owner of a wood pellet plant. The shape of the woodshed was assumed to be square as well. The side length of this woodshed (WSside), in terms of number of harvest tracts, was determined using equation (4):

The value of WSside was rounded to the nearest greater integer and then squared to ascertain total number of contiguous harvest tracts present in the woodshed. Then, Euclidian distances between the wood pellet plant and all other harvest tracts (WSside ∗ WSside − 1) present in the woodshed were estimated and multiplied by 1.35 individually [28]. This multiplication was necessary to consider the impact of local terrain on the distance between wood pellet plant and any harvest tract.
This study assumed that an owner of the wood pellet plant will attempt to reduce total distance traveled to transport required quantities of feedstocks from surrounding harvest tracts present in the woodshed. Therefore, an owner would follow the optimization rule given in equation (5) to select required number of harvested tracts out of all harvest tracts present in the woodshed:
where k = WSside ∗WSside − 1, Bi = WAi ∗ HTsize, and D is the distance of each harvest tract from the wood pellet plant located in the center of the woodshed. An algorithm programed in MS Excel© was used to implement equation (5).
Total biomass availability on a harvested tract was divided by the capacity of a log-truck (22.7 Mg) and rounded off (upward) to estimate total trips needed for transporting available feedstock from a harvested tract to a wood pellet plant. The distance between a harvested tract and wood pellet plant was multiplied with number of trips required and divided by the fuel economy of a loaded log-truck (1.91 km l−1) to estimate total diesel consumption. The same procedure was adopted to determine fuel consumption related to return trips. The fuel economy of a returning unloaded log-truck was taken as 2.34 km l−1. Total diesel consumption (loaded and unloaded log-truck) was added and multiplied with a GHG emission factor (2.68 kg CO2e l−1, [29]) to estimate GHG emissions related to transportation of biomass from a harvested tract to a wood pellet plant. This procedure was repeated for all harvested tracts. Finally, all GHG emissions were added to determine total GHG emissions related to the transportation of a feedstock to a wood pellet plant.
2.3. Manufacturing of wood pellets
Total quantities of wood pellets produced were multiplied with a GHG emission factor (155.7 g CO2e kg−1, [5]) to ascertain total GHG emissions related with wood pellet production. Non-biogenic GHG emissions related with bark burning at the wood pellet plant were also considered (34.4 g CO2e kg−1 of burned material, [30]).
2.4. Transportation of wood pellets in the United States
The average distance between a wood pellet plant and New Orleans Seaport in the United States was 150 km [14]. The product of total distance traveled and total biomass transported was multiplied with a GHG emission factor (0.022 kg CO2e Mg−1 km−1, [31]) to determine GHG emission related with the transportation of required wood pellets to New Orleans Seaport in the United States using railroads.
2.5. Transatlantic shipment of wood pellets
The average distance between New Orleans Seaport in the United States to Immingham Seaport in the United Kingdom was 11050 km [32]. The product of total distance traveled and total wood pellets transported was multiplied with a GHG emission factor (0.009 kg CO2e Mg−1 km−1, [33]) to ascertain GHG emissions related with the transatlantic shipment of wood pellets.
2.6. Transportation of wood pellets in the UK
The average distance between a power plant at Selby, United Kingdom and Immingham Seaport in the United Kingdom was 112 km [14]. The product of total distance traveled and total wood pellets transported was multiplied with a GHG emission factor (0.022 kg CO2e Mg−1 km−1, [33]) to determine GHG emissions related with the transportation of wood pellets using railroads.
2.7. Electricity generation
3. Results
The availability of logging residues was higher under intensive than non-intensive forest management. The availability of pulpwood was higher under intensive forest management only until the 15th year of plantation with respect to non-intensive forest management. However, the combined availability of both pulpwood and logging residues was greater under intensive than non-intensive forest management for all plantation ages considered (figure 1(a)). Average annual availability of pulpwood was higher at early plantation years and declined with an increase in plantation age (figure 1(b)). Average annual availability of logging residues initially increased with a rise in plantation age but started to decrease with a further rise in plantation age. The weight of logging residues relative to the total weight of all timber products stabilized at about 12% after the 12th year of plantation under both forest management choices (figure S1 available at stacks.iop.org/ERL/9/024007/mmedia). GHG emissions related with the production of woody feedstocks were higher under intensive than non-intensive forest management choice after the 12th year of plantation because of application of fertilizers at the same year under intensive forest management (figure S2 available at stacks.iop.org/ERL/9/024007/mmedia).

Figure 1. Availability of timber products with respect to plantation age. (a) shows quantities of timber products available at a harvest age. (b) shows average availability of timber products per year for a rotation age. Values in (b) are obtained after dividing values in (a) by the corresponding harvest age. Combined availability of pulpwood and logging residues is shown separately. Site index is about 21 m at 25th year of a slash pine plantation. Initial plantation density is 1235 seedlings ha−1.
Download figure:
Standard image High-resolution imageTotal electricity generated was proportional to the capacity of the power plant (table 2). Total wood and wood pellets needed to generate electricity were proportional to the power plant capacity as well (table 3). For a given power plant capacity, total number of harvested tracts was inversely proportional to the average annual feedstock availability per unit forestland—a function of rotation age, forest management choice, and feedstock type considered for manufacturing of wood pellets (figure S3 available at stacks.iop.org/ERL/9/024007/mmedia). For instance, total number of harvested tracts for scenarios when only pulpwood was used as a feedstock was higher under intensive than non-intensive forest management choice from the 16th year of rotation age because the average annual availability of pulpwood was lower under intensive than non-intensive forest management choice after the 15th year of plantation. Total number of trips needed to transport feedstocks from a harvested tract to wood pellet plant decreased with a decline in feedstock availability per unit forestland (figure S4 available at stacks.iop.org/ERL/9/024007/mmedia). These trips remained the same across different power plant capacities.
Table 2. Total electricity generated at a power plant. Reported numbers are based on the numerator in equation (1).
| Power plant capacity (MW) → | 20 | 40 | 60 | 80 | 100 |
|---|---|---|---|---|---|
| Electricity generated (million kWh yr−1) | 117.2 | 234.4 | 351.6 | 468.8 | 586.0 |
We found that an owner of the wood pellet plant procured required quantities of feedstocks only from those harvested tracts which were located in the vicinity of the wood pellet plant starting from the nearest harvest tract. The distance of the last harvested tract from the wood pellet plant is shown in figure S5 (available at stacks.iop.org/ERL/9/024007/mmedia). Harvested tracts were arranged in a circular shape around the wood pellet plant. The radius of the procurement area was inversely proportional to the average annual feedstock availability per unit forestland and directly proportional to the quantities of wood pellets manufactured (figure S5 available at stacks.iop.org/ERL/9/024007/mmedia). Total distance covered to transport feedstocks to a wood pellet plant increased with an increase in the power plant capacity (figure 2). Total distance traveled to source sufficient feedstock was directly dependent on feedstock availability per unit forestland area mediated by the required number of trips. Total distance traveled to source required wood was inherently variable in nature and much larger than previously published estimates [5–7].
Table 3. Quantities of required wood and wood pellets. Reported numbers are based on equations (1) and (2).
| Power plant capacity (MW) → | 20 | 40 | 60 | 80 | 100 |
|---|---|---|---|---|---|
| Wood pellets (1000 Mg yr−1) | 97.5 | 169.1 | 235.4 | 298.6 | 359.7 |
| Wood (green, 1000 Mg yr−1) | 190.9 | 331.1 | 460.9 | 584.7 | 704.3 |

Figure 2. Total distance covered to source required feedstock from surrounding harvested tracts. Extra distance covered to transport excess feedstock from the last harvested tract is not considered. LR: logging residues; PW: pulpwood; intensive: intensive forest management; and non-intensive: non-intensive forest management.
Download figure:
Standard image High-resolution imageTotal GHG emissions increased with an increase in power plant capacity (figure 3). Total GHG emissions were lowest when both pulpwood and logging residues were used as a feedstock for wood pellet production for a given power plant capacity because of higher feedstock availability per unit forestland area relative to a situation when only pulpwood or only logging residues were used for wood pellet production. Similarly, total GHG emissions under non-intensive forest management choice were typically lower than intensive forest management choice. This was mostly because of higher allocation of GHG emissions at the time of wood production to feedstocks under intensive than non-intensive forest management. This higher allocation compensated any reduction in GHG emissions due to a decrease in number of harvested tracts needed to source sufficient wood or total distance covered to source sufficient quantities of feedstock for wood pellet production.
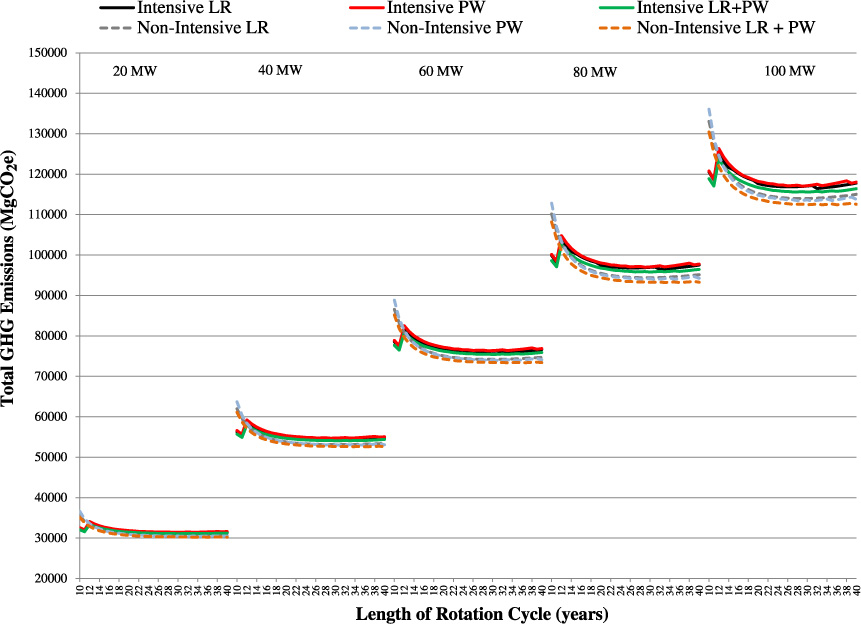
Figure 3. Total GHG emissions related with transatlantic wood pellet trade. Emissions from any extra distance covered to transport excess feedstock from the last harvested tract are not considered. The same is true for GHG emissions related to any excess forestland area present in the last harvested tract. LR: logging residues; PW: pulpwood; intensive: intensive forest management; and non-intensive: non-intensive forest management.
Download figure:
Standard image High-resolution imageContribution of five out of seven steps present within the supply chain of transatlantic wood pellet trade towards total GHG emission remained constant independent of harvest age, forest management choice, and feedstock type considered for wood pellet production for a given power plant capacity (table 4). However, GHG emissions related with steps wood production and transportation of wood to a wood pellet plant were dependent on rotation age, forest management choice, and feedstock type used for wood pellet production, and therefore were primarily responsible for any variability in total GHG emissions for a given power plant capacity (figure 4). GHG emissions arising from wood pellet production contributed most significantly towards total emissions (about 48%), followed by transatlantic transportation of wood pellets (about 31%) and burning of wood pellets (about 10%). The contribution of GHG emissions related to transportation of required feedstock from harvested tracts to a wood pellet plant was only about 1%–3%. GHG emissions related to feedstock production were at least three times higher than GHG emissions related to transportation of required feedstocks to a wood pellet plant. Additionally, GHG emissions related to feedstock production decreased smoothly with an increase in harvest age contrary to GHG emissions related to transportation of feedstocks to a wood pellet plant. Therefore, distribution of total GHG emission was relatively smooth without any noticeable variability between any two consecutive harvest ages.
Table 4. GHG emissions of steps present in the supply chain of transatlantic wood pellet trade. Reported numbers are based steps explained in the methods section starting from equation (3) onwards.
| Power plant capacity (MW) → | 20 | 40 | 60 | 80 | 100 |
|---|---|---|---|---|---|
| Steps present in the supply chain (1000 Mg CO2e) ↓ | |||||
| Manufacturing of wood pellets | 15.3 | 26.5 | 36.9 | 46.8 | 56.4 |
| Transportation of wood pellets using railroads in United States | 0.3 | 0.6 | 0.8 | 1.1 | 1.3 |
| Transatlantic shipment of wood pellets | 9.7 | 16.8 | 23.4 | 29.7 | 35.8 |
| Transportation of wood pellets using railroads in United Kingdom | 0.2 | 0.4 | 0.6 | 0.7 | 0.9 |
| Burning of wood pellets at Selby, United Kingdom | 3.4 | 5.8 | 8.1 | 10.3 | 12.4 |
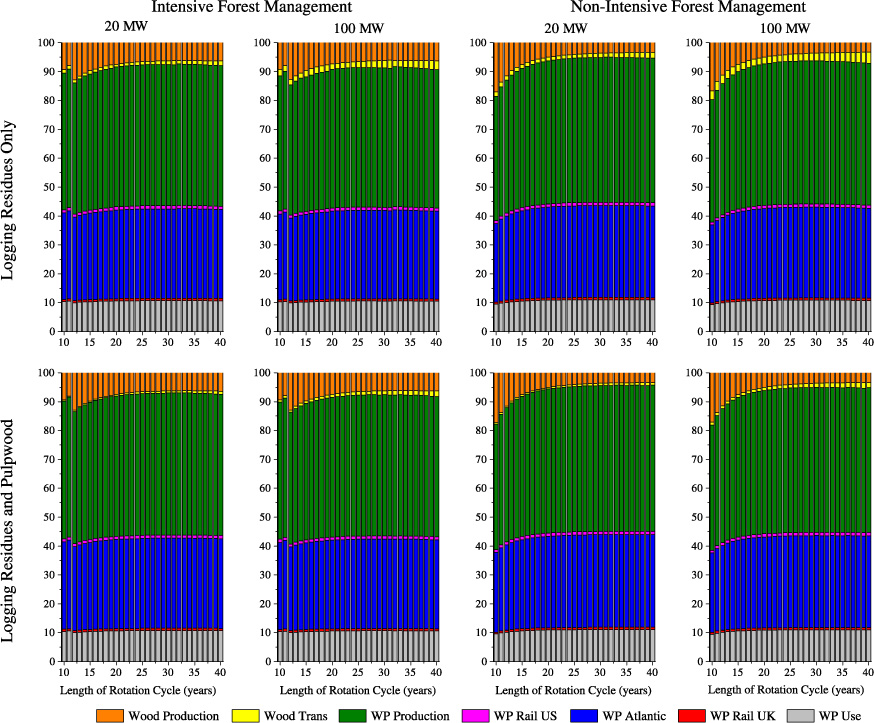
Figure 4. Relative contribution (percentage) of different steps present within the supply chain of transatlantic wood pellet trade towards total GHG emission.
Download figure:
Standard image High-resolution image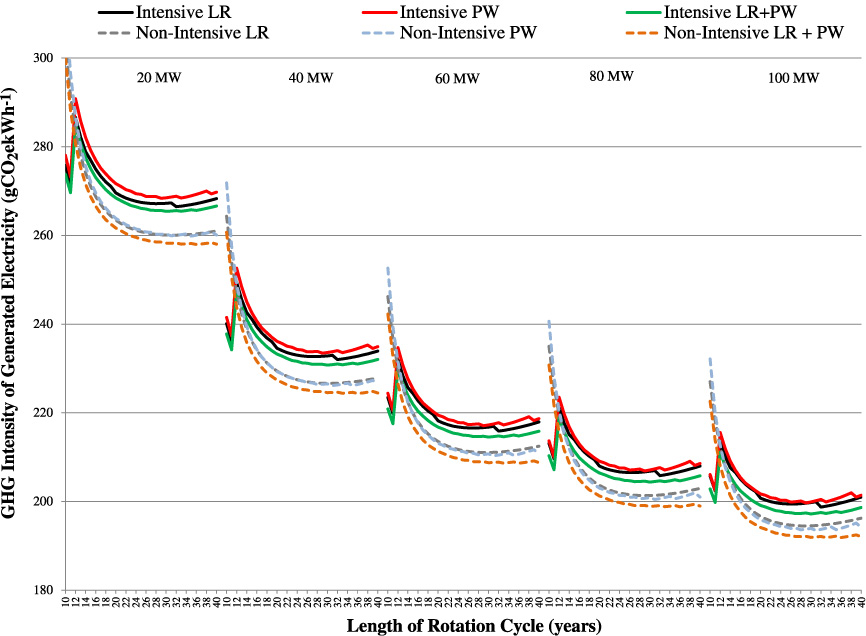
Figure 5. GHG intensity of a unit of generated electricity at Selby, United Kingdom. LR: logging residues; PW: pulpwood; intensive: intensive forest management; and non-intensive: non-intensive forest management.
Download figure:
Standard image High-resolution image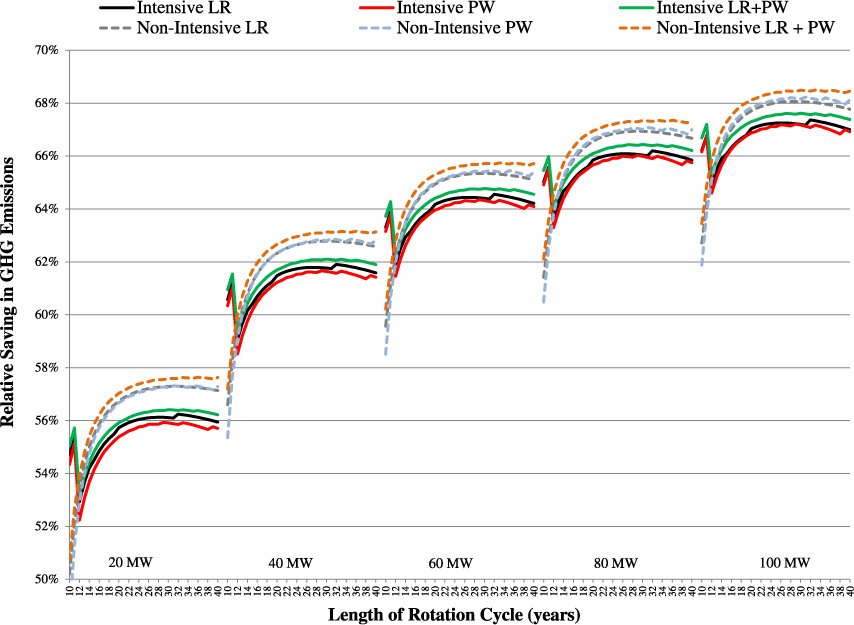
Figure 6. Relative savings in GHG emissions with respect to grid electricity derived from fossil fuels. LR: logging residues; PW: pulpwood; intensive: intensive forest management; and non-intensive: non-intensive forest management.
Download figure:
Standard image High-resolution image
A comparison of GHG intensities of electricity generated from imported wood pellets (figure 5) and the United Kingdom's current mix of fossil fuel-based grid electricity revealed that relative savings in GHG emissions increased with a rise in power plant capacity (figure 6). This contradicts a general belief that high capacity wood pellet plants should not be promoted in the United Kingdom and elsewhere as they do not provide any GHG benefits [11]. Figure 6 also shows that relative savings in GHG emissions start to flatten out with a rise in the capacity of a power plant responding to the behavior of conversion efficiency which initially increases at an increasing rate but then flattens out with a further rise in the power plant capacity [23].
4. Discussions and conclusions
This study extends our understanding about the impact of transatlantic wood pellet trade on the United Kingdom's electricity-related GHG emissions by combining a simulation-based approach with life-cycle assessment under realistic assumptions at landscape level. The GHG intensity of a unit of electricity generated using imported wood pellets in the United Kingdom is at least 50% lower than the GHG intensity of grid electricity derived from fossil fuels. Therefore, use of imported wood pellets from the southern United States for electricity generation could help in reducing GHG emissions in the United Kingdom.
Relative savings in GHG emissions were only higher by up to 2% for wood pellets manufactured using feedstocks obtained from non-intensive than intensive forest management choice especially when the age of non-intensively managed plantations was greater than 12 years. This implies that feedstock obtained from both intensive and non-intensively managed forest plantations can be used for manufacturing wood pellets to achieve reductions in GHG emissions without any significant drop in relative savings of GHG emissions. Additionally, relative savings in GHG emissions were almost similar irrespective of type of feedstock used for manufacturing of wood pellets. This implies that the use of logging residues along with other feedstocks for manufacturing of wood pellets in the southern United States and subsequent utilization of manufactured wood pellets for electricity generation in the United Kingdom could save a significant amount of GHG emissions.
Logging residues and pulpwood derived from mature plantations should be used as a feedstock to ensure highest savings in GHG emissions for any power plant capacity. However, relative savings in GHG emissions were at least 50% even at lower rotation ages. These results contradict a general belief that the use of wood pellets, manufactured from feedstocks (mostly pulpwood and logging residues) obtained from 10 to 15 year old pine plantations in the southern United States do not provide any GHG savings over electricity generated from fossil fuels in the United Kingdom [13]. Relative savings in GHG emissions increased with a rise in the capacity of power plant mostly because of higher conversion efficiencies of high capacity power plants. This further suggests that high capacity power plants will be much better for reducing GHG emissions than low capacity power plants.
The approach adopted in this study for determining total distance covered to source sufficient feedstock for wood pellet production assumes that forestland owners are willing to sell logging residues and pulpwood to an owner of wood pellet plant only. Additionally, this study assumes that all harvested tracts are similar in terms of planted species, plantation age, and located contiguously. Dynamics of sourcing required wood for manufacturing of wood pellets or any other wood-based product is much more complex at the landscape level. This study acknowledges this complexity and suggests that results of this study should be considered as a best case only. However, relative contribution of GHG emission related with the transportation of feedstocks is relatively small (<3%) towards overall GHG emissions. Therefore, it is very unlikely that relative percentage savings in GHG emissions will change a lot even after relaxing these assumptions.
In this study, the average annual feedstock yield remains constant. However, yields may change over time, which creates a need to analyze the impact of future changes in feedstock yields on overall GHG savings. Additionally, much insight would be gained from integrating the model developed in this study with market equilibrium models [34] to analyze the consequences of an increase in demand for feedstocks for wood pellet production on the rotation age. This is especially true as a change in rotation age could affect carbon benefits of transatlantic wood pellet trade [35]. Furthermore, it will be interesting to explore the potential of other technologies like combined heat and power [36] to determine GHG savings of wood pellets not only in Europe but in the United States as well. We have analyzed only two scenarios of biomass production in this study. Forestland owners practice multiple ways to manage their plantations. Thus, future research should consider the impact of multiple forest management practices on the relative savings in GHG emissions associated with transatlantic wood pellet trade. Finally, a better understanding of soil carbon behavior especially for short rotation cycles is also needed. We hope that findings of this study will help in guiding the debate on sustainability of wood-based bioenergy products at local, regional, national, and global levels. We also hope that this study will be able to guide future research appropriately.
Acknowledgments
Authors are thankful for the funding provided by Energy Biosciences Institute @ University of Illinois at Urbana-Champaign/University of California, Berkeley. Authors are thankful to Shawn Baker at Warnell School of Forestry and Natural Resources, University of Georgia for his help with data on log-trucks.
Footnotes
- 4
GHG emission related to site preparation, fertilizer application, and harvesting was 1127.4 kg ha−1, 2541.7 kg ha−1 and 1134.2 kg ha−1, respectively.
- 5
GHG emission related to site preparation, fertilizer application, and harvesting was 1127.4 kg ha−1, 170.3 kg ha−1 and 1134.2 kg ha−1, respectively.
- 6
GHG emission related to site preparation and harvesting was 1065.5 kg ha−1 and 1134.2 kg ha−1, respectively.