
Abstract
Worldwide demand for crops is increasing rapidly due to global population growth, increased biofuel production, and changing dietary preferences. Meeting these growing demands will be a substantial challenge that will tax the capability of our food system and prompt calls to dramatically boost global crop production. However, to increase food availability, we may also consider how the world's crops are allocated to different uses and whether it is possible to feed more people with current levels of crop production. Of particular interest are the uses of crops as animal feed and as biofuel feedstocks. Currently, 36% of the calories produced by the world's crops are being used for animal feed, and only 12% of those feed calories ultimately contribute to the human diet (as meat and other animal products). Additionally, human-edible calories used for biofuel production increased fourfold between the years 2000 and 2010, from 1% to 4%, representing a net reduction of available food globally. In this study, we re-examine agricultural productivity, going from using the standard definition of yield (in tonnes per hectare, or similar units) to using the number of people actually fed per hectare of cropland. We find that, given the current mix of crop uses, growing food exclusively for direct human consumption could, in principle, increase available food calories by as much as 70%, which could feed an additional 4 billion people (more than the projected 2–3 billion people arriving through population growth). Even small shifts in our allocation of crops to animal feed and biofuels could significantly increase global food availability, and could be an instrumental tool in meeting the challenges of ensuring global food security.
Export citation and abstract BibTeX RIS

Content from this work may be used under the terms of the Creative Commons Attribution 3.0 licence. Any further distribution of this work must maintain attribution to the author(s) and the title of the work, journal citation and DOI.
1. Introduction
Recent studies find that global crop demands will likely increase by 60–120% by the year 2050 (from baseline year 2005) [1, 2], depending on assumptions of population growth, income growth and dietary changes. This projected increase of global crop demand is partly due to a growing global population, but a larger driver is increasing global affluence and associated changes in diet [2]. As global incomes increase, diets typically shift from those comprised of mostly grains, to diets that contain a greater proportion of meat, dairy, and eggs [2–5]. This shift from plant-based diets to more intensive demand for animal products is termed the 'Livestock Revolution' [5], and it is estimated approximately 40% of the world's population will undergo this revolution to more animal consumption by the year 2050 [2]. In order to meet these demands, global livestock production systems are shifting from using mostly waste products, crop residues, and marginal lands to more industrial systems that require less land and use higher value feed crops [5, 6]. In developing countries with high rates of increasing animal product demands, a greater proportion of cereals are being directed to animals [7].
Increasing demand for meat and dairy is also of importance to the global environment because their production requires more land and other resources than plant-based foods [8–10]. In fact, livestock production is the single largest anthropogenic use of land. According to a 2011 analysis, 75% of all agricultural land (including crop and pasture land) is dedicated to animal production [11]. Livestock production is also responsible for other environmental impacts. Livestock production is estimated to be responsible for 18% of total greenhouse gas emissions [12], and animal products generally have a much higher water footprint than plant-based foods [13].
A central issue facing the global food system is that animal products often require far more calories to produce than they end up contributing to the food system [14, 15]. While efficiencies of feed-to-edible food conversions have increased over time [7, 16], the ratio of animal product calories to feed calories is, on average, still only about 10% [14, 17]. This suggests using human-edible crops to feed animals is an inefficient way to provide calories to humans.
In addition to growing meat and dairy demands, affluent nations are also directing a growing proportion of high-value feedstock to biofuel production. A great majority of biofuel feedstocks are human-edible, especially from maize in the United States and sugarcane in Brazil. In 2010 global biofuel production represented 2.7% of global fuel for road transportation (at 107 billion liters produced), which is more than a 450% increase from the year 2000 [18]. To produce these fuels the US and Brazil combined dedicated over 460 million tonnes of maize and sugarcane respectively to biofuel production in 2010, which is 6% of global crop production (by mass) [19].
In this study, we consider how different systems of crop production and crop use are interwoven to actually feed people around the world. Specifically, we map global patterns of crop production as well as crop allocation (for human consumed food, animal feed, biofuels, and other non-food products) to determine the amount of human-consumable calories produced across the world. By comparing crop production (in terms of tonnes of crop per hectare) to actual food delivery (in terms of calories of human-consumable product per hectare), we illustrate where tremendous inefficiencies in the global food system exist today—and where opportunities to enhance food security exist by changing dietary preferences and biofuel policies.
2. Methods
We map the global extent and productivity of 41 major agricultural crops (which account for >90% of total calorie production around the world) by using the EarthStat crop production data of Monfreda et al [20]. These data use a global compilation of census data and satellite images to depict geographic patterns of crop area and yields across the world on a 5' × 5' latitude–longitude grid (equivalent to roughly 9 km × 9 km on the equator). These Monfreda et al [20] data are 'circa 2000'. Most values are averaged from 1997 to 2003, except where data are missing [20].
2.1. Crop allocations
National-level crop allocations are determined by:
where crop allocationc,n represents the crop uses (subscript c) for a given nation (subscript n), and importing nations' allocationsc is a crop specific global average use of importing nations.
Crop allocationc,n statistics were derived using the Food and Agriculture Organization's (FAO) Food Balance Sheets and trade statistics [21], which report crop productionc,n,exportsc,n, and domestic allocationsc,n at the national level [21, 22]. We used these data for the years 1997–2003 (the same years as Monfreda et al [20]). To examine how crops were allocated—whether for human consumed food, animal feed, biofuels, or other non-food uses, relative proportions of crop production going to 'food', 'feed', 'processed' and 'other' were used for each crop in each nation (see supplementary information (SI) available at stacks.iop.org/ERL/8/034015/mmedia). These crop allocationc,n proportions were then multiplied by the crop production data of Monfreda et al [20].
Beyond the more straightforward calculations, we had to make a number of key assumptions. We assume that processed oil crop production separates the oils for human consumption or industrial uses, and the protein-dense cake or meal is directed to animal feed [23]. Crops allocated to biofuels were determined for major biofuel producing nations in the year 2000: United States, Brazil, Germany and France. In the year 2000, the United States and Brazil used maize and sugar cane as their respective biofuel feedstocks, whereas France and Germany used rapeseed for biodiesel production. Data on the magnitude of crop production used for biofuel production in 2000 were taken from the World Watch Institute [18]. For maize being directed to ethanol production in the United States, we assume 34% of the calories are redirected into 'Feed' as dried distillers' grains [24]. Likewise we assumed rapeseed meal, as a byproduct of biodiesel production in Europe, was directed to animal feed (see SI).
It is important to note that crop production within a given nation is not necessarily consumed domestically. In order to determine how exported crop production was allocated, we used FAO trade statistics to determine how importing nations allocate crops (importing nations' allocationsc) [22]. We then assumed exports were allocated based on these crop specific global average allocations for importing nations. Importing nations crop allocations were weighted by how much each nation was importing, and how they allocated each crop. In this way, we map food delivery per hectare of cropland, regardless of where the food is consumed.
2.2. Livestock feed conversions and calorie delivery
Crop use statistics were used to determine the number of calories delivered to the food system, which include food calories (which were used for direct human consumption), and feed calories after they were converted to meat, egg, and dairy calories. Crops that were used for other non-food uses (biofuels and other industrial uses) were not delivered to the food system. Produced crop calories and protein were determined from the crop caloric and protein contents which were derived by Tilman et al [2].
In our analysis, feed calories are converted to edible meat, egg and dairy calories using conversion efficiencies from the USDA [25], adapted from [16] (table 1). These livestock conversion efficiencies are an estimate of how many edible calories result from the conversion from feed calories, based on national-level livestock production statistics (reported data on 'cattle meat', 'chicken meat', 'pig meat', 'hen eggs', and 'cow's milk' were used) (see SI).
Table 1. Livestock conversion efficiencies in calories and protein. Feed to food calorie conversion efficiencies for milk, eggs, chicken, pork, and beef, are shown from left to right. Conversion efficiencies are modified from [16] (SI available at stacks.iop.org/ERL/8/034015/mmedia).
| Dairy | Eggs | Chicken | Pork | Beef | |
|---|---|---|---|---|---|
| Calorie conversion efficiency (%) | 40 | 22 | 12 | 10 | 3 |
| Protein conversion efficiency (%) | 43 | 35 | 40 | 10 | 5 |
Many commonly used feed-to-meat conversions, for example 12 kg of feed to 1 kg of beef, or 5 kg of feed to 1 kg of chicken, are in terms of kilograms of feed required per kilogram of live-weight gain [25]. However, not all of the live-weight of an animal is edible to humans. For example, on average only 60% of beef cattle live-weight is edible [26]. To determine the edible feed-to-edible meat calorie conversions, we utilize USDA feed to live-weight conversions [25], the proportion of animal live-weight that is carcass (also known as the 'dressed weight'), as well as data on the calorie content of animal carcasses [2, 26]. For example, the beef conversion efficiency used here uses a feed to live-weight conversion of 12.7 [25], and a dressing proportion of 0.6 gives us tonnes of feed per tonne of carcass weight by:  tonnes feed per tonne live-weight
  tonnes of live-weight per tonne of
  tonnes feed per tonne of carcass weight. This study estimates the inputs and outputs of livestock production on feed grains and does not account for the weight gains beef and dairy cattle obtain during their weaning and grass fed stages (see SI).
Our analysis only considers the production of meat and dairy production from animal feed; grazing systems for animal production are not evaluated here. Naturally, animal grazing introduces calories into the food system that did not originate in feed crops; accordingly, beef cattle grazing was accounted for by including only beef that was produced in landless or mixed crop–livestock systems [12]. Additionally, other ruminants (goats, sheep, etc) were not considered in this study, as they typically do not consume feed grains.
3. Results
3.1. Global crop allocations
We investigated crop allocations both in terms of calorie content and protein content. We find that on a global basis, crops grown for direct human consumption represent 67% of global crop production (by mass), 55% of global calorie production, and 40% of global plant protein production (table 2). Feed crops represent 24% of global crop production by mass. However since feed crops like maize, soybeans, and oil seed meal are dense in both calories and protein content, feed crops represent 36% of global calorie production and 53% of global plant protein production. Together crops used for industrial uses, including biofuels, make up 9% of crops by mass, 9% by calorie content, and 7% of total plant protein production (table 2).
Table 2. Global crop allocations. Crop allocations in terms of calories, protein and weights of 41 major crops combined are shown, as well as people fed per hectare on produced and delivered calories.
| Country | Crop use by calories/protein/weight (%) | People fed per hectare | |||||||||
|---|---|---|---|---|---|---|---|---|---|---|---|
| Food | Feed | Other use | Produced calories | Delivered calories | |||||||
| India | 89 | 77 | 92 | 6 | 18 | 4 | 5 | 5 | 4 | 6.5 | 5.9 |
| China | 58 | 50 | 67 | 33 | 42 | 26 | 9 | 8 | 7 | 13.5 | 8.4 |
| United States | 27 | 14 | 37 | 67 | 80 | 57 | 6 | 6 | 6 | 16.1 | 5.4 |
| Brazil | 45 | 16 | 39 | 41 | 79 | 14 | 14 | 5 | 27 | 10.6 | 5.2 |
| World | 55 | 40 | 67 | 36 | 53 | 24 | 9 | 7 | 9 | 10.1 | 6 |
Biofuel production alone represents ∼3% of crop production by weight and only 1% of calories produced (sugarcane is a heavy, water-dense crop) for the year 2000. However, biofuel production is estimated to have increased more than 450% (in terms of liters produced) between the year 2000 and 2010 [18], representing a significant shift of additional crops to non-food uses. Unfortunately, FAO statistics do not yet differentiate biofuels from other industrial crop uses, making it difficult to have systematic tracking of biofuel consumption of crops. However, looking at other sources for 2010 biofuel statistics, ethanol production from maize in the United States and sugarcane in Brazil alone now represents 6% of global crop production by mass and 4% of calorie production [19].
The allocation of crop production to different uses differs greatly by nation. To illustrate this we will discuss how crop allocations differ in four key countries: India, China, Brazil and the United States. Combined these countries represent 43% of the total cropland area, as well as 48% of global calorie production. India produces mostly wheat and rice, which are primarily used as food for direct consumption. During the study period India directed 89% of produced crop calories to food, and only 6% of crop calories (and 18% of produced plant protein) for animal feed, and the remaining 5% of produced calories (and plant protein) for other uses (table 2).
China was the world's top producers of rice in the year 2000, and used 82% of rice calories for direct human consumption. However, China was also the world's second largest producer of maize, a major feed crop. China allocated 77% of produced maize calories to animal feed. Overall, a third of produced calories in China went to animal feed, which is 42% of produced plant protein (table 2). Half of the plant protein produced in China was used for food, which represents 58% of produced calories.
Brazil has similar crop allocation patterns to China in terms of calories. 45% of crop calories are directed to food for direct consumption (table 2). Feed calories in Brazil represent 41% of produced calories, and the remaining 14% of calories were directed to biofuels and other uses. Brazil has drastically different crop use proportions than China with respect to the allocation of crop protein. This is due to the fact that more than half of Brazil's soybean production is directed to animal feed. Only 16% of the plant protein produced in Brazil is directed to food, and 79% of produced protein is directed to animal feed.
Like Brazil, the United States directs a majority of produced plant protein to animal feed, but in the United States animal feed also represents more than half of produced calories. During the study period the United States used 27% of crop calorie production for food, and only 14% of produced plant protein is used for food directly. More than half of crop production by mass in the United States is directed to animal feed, which represents 67% of produced calories and 80% of produced plant protein (table 2). In 2000, biofuels and other industrial uses accounted for 6% of calories, 6% by mass, and 6% by protein content. The United States is the leading producer of maize, which is the world's primary feed crop. However, maize usage is changing rapidly over time: from 2000 to 2010, a greater proportion of maize has been directed to maize ethanol production. In the US for example, maize ethanol production jumped from 6% of US maize production to 38% in the year 2010 [18, 19].
3.2. Calorie delivery and people fed per hectare
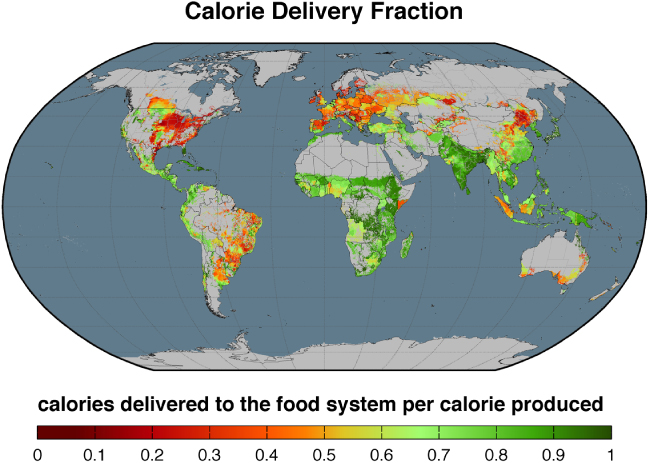
From the 41 crops analyzed in this study, 9.46 × 10¹⁵ calories available in plant form are produced by crops globally, of which 55% directly feed humans. However, 36% of these produced calories go to animal feed, of which 89% is lost, such that only 4% of crop-produced calories are available to humans in the form of animal products. Another 9% of crop-produced calories are used for industrial uses and biofuels and so completely lost from the food system. Including both human-edible crop calories and feed-produced animal calories, only 5.57 × 10¹⁵ (59% of the total produced) calories are delivered to the world's food system (figure 1). Therefore, 41% of the calories available from global crop production are lost to the food system.

Figure 1. Calorie delivery fraction per hectare. The proportions of produced calories that are delivered as food are shown.
Download figure:
Standard image High-resolution imagePut another way, shifting the crops used for feed and other uses towards direct human food consumption could increase calories in the food system by 3.89 × 10¹⁵ calories, from 5.57 × 10¹⁵ to 9.46 × 10¹⁵ calories, or a ∼70% increase. A quadrillion (1 × 10¹⁵) food calories is enough to feed just over 1 billion people a 2700 calories per day diet for a year (which is 985 500 calories per year) [1]. Therefore, shifting the crop calories used for feed and other uses to direct human consumption could potentially feed an additional ∼4 billion people.
These changes in calorie availability are mirrored by changes in the availability of protein in the food system through changes in global crop allocation. Of the total plant protein produced, only 49% is delivered as plant and animal protein to the food system. Therefore, shifting all crop production to direct human consumption could double protein availability. In the United States, only 14% of produced protein is used as food and 80% of protein is used as animal feed. Because of the high proportion of plant protein being used as animal feed, only 27% of plant protein produced in the US is available for consumption (as either plant or animal product).
Our results show that many of the most productive crops, such as maize and soybeans, are responsible for a high proportion of losses to the food system via livestock and biofuel production (figure 2). On a global basis, 74% of maize production goes to animal feed. Therefore most of the produced maize calories are lost to the feed to animal production conversion, and increasingly to ethanol production. Only 24% of the global maize calories produced are delivered to the food system as either plant or animal products (figure 2).

Figure 2. Calorie delivery and losses from major crops. Calories delivered are shown in green (this includes plant and animal calories) and calories that are lost to meat and dairy conversion as well as biofuels and other uses are shown in red.
Download figure:
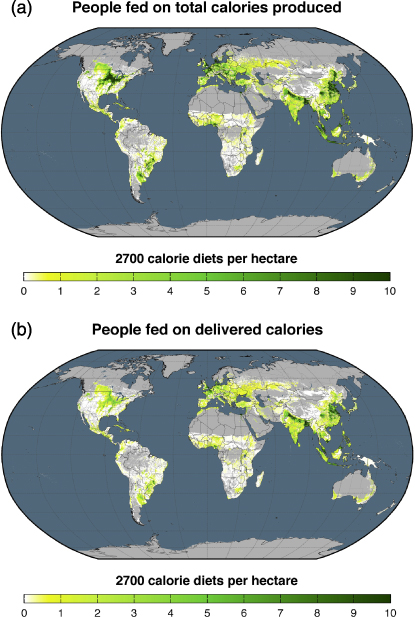
Standard image High-resolution imageFrom the calories delivered to the food system from cropland hectares, we calculate the number of people fed a nutritionally adequate 2700 calorie diet per day. We consider 41 crops on 947 million hectares of cropland and show that production of raw plant calories is adequate to feed 10.1 people ha−1 (figure 3(a)), but that calories delivered to the food system, after accounting for animal feed, biofuels and other non-food products, only feed 6 people per ha (figure 3(b)).
Figure 3. Calories produced per hectare (9.46 × 10¹⁵ calories total), divided by 2700 calorie per day diets (985 500 calories per year) are shown in (a). People fed per hectare from calories that are delivered to the food system (after feed-to-meat conversions, and biofuels and other uses are taken out) are shown in (b).
Download figure:
Standard image High-resolution image
Calorie delivery and people fed per hectare differ greatly between major crop producing nations (table 2). Because India dedicates land to mostly food crops and 89% of crop calories are used for direct human consumption, the calories produced on croplands and the calories delivered are similar: 90% of the calories produced in India are delivered to the food system. The number of people fed per cropland hectare on calories delivered on Indian croplands averages 5.9 people ha−1, a result of a 90% rate of calorie delivery to the food system. If all produced calories were delivered as food, this figure would rise slightly to 6.5 people ha−1. On delivered calories India is able to feed 5.9 people ha−1, which is about the global average of 6 people fed ha−1. This is a result of a high delivery fraction yet a low number of calories produced per hectare in India as compared to the global average.
China produces one fifth of the world's meat, egg and dairy calories, and almost half of the world's pig meat. China uses 58% of its crop calorie production for food and 33% for feed. Of the total calories produced in China, 62% are delivered to the food system. China feeds more people than India per cropland hectare with 8.4 people fed with delivered calories, albeit with a lower calorie delivery fraction of 62%. If all produced calories were food, that number would rise substantially to 13.5 people ha−1.
Brazil directs 46% of calorie production to human food and 41% to animal feed. Of the calories produced in Brazil, 50% are delivered to the food system. Therefore, Brazil could feed twice as many people per hectare. Croplands in Brazil could feed 10.6 people ha−1, but only feed 5.2 people. A high proportion of Brazil's calorie production goes to animal feed. Soybean production in Brazil accounted for 28% all calories produced, and over one-third of soybean production was exported to other nations. Calorie delivery reflects the number of calories delivered to the global food system per calorie produced on croplands, regardless of where they are consumed. In the case of soybeans produced in Brazil, if they are exported to another country and used as feed, those calorie losses are reflected on Brazilian croplands, not in the importing nations that use them.
The US uses 67% of total calorie production for animal feed. Because so much of the United States calorie production goes to animal feed, only 34% of the calories produced in the US are delivered to the food system. The US is the world's top producer of beef cattle, producing 22% of global beef supply. The number of domestically produced calories allocated to feed in the United States is 1.8 times the number allocated to feed in China. Yet when we look at the total of all meat, egg, and dairy calories produced, China produces 44% more than the United States [27]. However, because these numbers reflect allocation of only domestically produced feed crops, we are not fully capturing grain-fed livestock production in China. China's livestock production is more import dependent than the United States. This is especially the case for soybeans imported to China from Brazil [28]. For example, in 2000 45% of soybean supply in China was imported, and that proportion has increased over time to roughly 70% in 2009 [21].
The United States could feed almost three times as many people per cropland hectare on calories produced from major crops. US croplands feed 5.4 people ha−1 but could feed 16.1 people ha−1 if the current 34% efficiency rose to 100%. The US agricultural system alone could feed 1 billion additional people by shifting crop calories to direct human consumption.
3.3. Alternate diet scenarios
Shifting all crops currently allocated to animal feed back to human food implies that either the global population would stop consuming animal products, or else the only sources of animal products would be grass fed or wild caught. However, we also investigated different scenarios of diet shifts that could increase global calorie availability. Shifting grain-fed beef production equally to pork and chicken production could increase feed conversion efficiencies from 12% to 23%, which would increase global calorie delivery by 6% (or 3.52 × 10¹⁴ calories), representing 357 million additional people fed on a 2700 calorie per day diet. Alternatively, shifting all feed directed to meat production to the production of milk and eggs (or a lacto-ovo vegetarian diet) could increase feed conversion efficiencies to 35%, which would increase calorie delivery by 14% (or 8.04 × 10¹⁴ calories), representing 815 million additional people fed. In both cases the feed allocated to livestock production stays the same as it was during this study period, but more meat, egg, and dairy calories could be produced from this feed as a result of efficiency gains. Of course, reducing the consumption of meat and dairy can also have large impacts on calorie delivery. For example reducing the consumption of grain-fed animal products by 50% would increase calorie availability enough to feed an additional 2 billion people.
4. Discussion and conclusions
The pressures on the world's food system in the coming decades—from population growth, increased meat consumption, and increased demand for biofuels—will place a tremendous burden on the world's croplands. While many efforts to address food security have focused primarily on improving crop yields [29, 30], it is also possible to dramatically increase the availability of food in the world by shifting the allocation of our crops from animal feed and biofuels towards more direct means of feeding the human population.
This study's estimates of food availability are pre-waste, and waste significantly reduces food availability. A recent study estimates food waste accounts for up to a third of crop production [31]. It is important to note food calories that are not produced from croplands were not included in this study, and in many parts of the world can be significant sources of protein (notably grass fed goats and sheep, as well as marine derived food products). In addition, the feed calculations in this study were limited by the crops we had the nutritional contents for, which are human-edible crops. Grassy forage crops and crop residues were not accounted for in this study and would change the livestock conversion efficiencies. A conclusion that could be made from our findings is that without large amounts of supplementation from grasses and crop residues, we are able to produce 41% (4.11 × 10¹⁴ calories) of total livestock production (1.01 × 10¹⁵ calories). We caution that this is unrealistic. This study separates human-edible crops from other forages due to data limitations, but this split is hypothetical. Livestock production requires a mix of grassy forages, crop residues and human-edible feed crops.
A limitation of this study is that it treats plant and animal proteins equally, even though their proteins differ in bio-availability and amino acid content. Animal proteins contain all the amino acids not produced by the human body (which are essential amino acids). However, cereal crops as well as legumes can be combined to provide all of the essential amino acids for complete proteins [32]. In order to produce the appropriate amino acids in places currently directing much of their production to animal feed, the crops produced would likely need to change (i.e., more legumes). Future studies are needed to investigate how changing diets may impact agricultural landscapes.
In this study, we demonstrate that global calorie availability could be increased by as much as 70% (or 3.88 × 10¹⁵ calories) by shifting crops away from animal feed and biofuels to human consumption. To put this number of calories in perspective, we investigated the additional calories produced from yield increases alone for maize, wheat, and rice in recent decades, keeping cropland extent constant at 1965 levels [27]. We find the increased number of calories available from shifting crop allocations is approximately equal to the number of calories gained from yield increases for these three crops over the period from 1965 to 2009. Addressing future challenges to food security can thus be met by increasing both the supply of crop production and the way we manage global demands for crops, especially by making human consumption a top priority over animal feed and biofuels.
However, we face a world where the opposite may be happening. For example, the demand for meat and dairy is expected to increase by 68% for meat and 57% for dairy by 2030 [33]. In addition, biofuel production from food crops has increased sharply in recent years, which has directed more calories away from feed and human food. One recent study estimates feeding 9 billion people a Western diet with Western technologies would require almost twice the amount of cropland currently under cultivation [3]. Of particular concern is the environmental impact of developing new agricultural land [2]. In 1980s and 1990s, tropical forests were the source of over 80% new agricultural land [34]. Given that global population is increasing and diets are changing, the number of people fed per cropland hectare must increase in order to meet the challenges of food security and prevent further cropland expansion into tropical forests [11].
While shifting the use of crops as animal feed and biofuels would have tremendous benefits to global food security and the environment, there are numerous political and cultural obstacles to such a shift [35, 36]. However, in some places, a shift towards less meat-intensive diets is underway, primarily as a result of health concerns [37]. Many people in affluent nations consume more animal products than is nutritionally recommended [38]. Further, overconsumption of red meats is associated with many health problems like obesity [39], cardiovascular disease [40], and some cancers [41, 42]. Reducing meat consumption, or shifting meat consumption away from beef to poultry and pork has the potential to increase cropland food productivity and feed more people per hectare of cropland.
Acknowledgments
We would like to posthumously acknowledge to Christian Balzer for research insights and sharing caloric content data. We also thank David Tilman for sharing data and insightful suggestions. Finally, we would also like to thank Ryan C Littlewood, Graham K MacDonald, Kate A Brauman, Christine O'Connell, Matt Johnston, and Deepak Ray with interpretation and writing assistance.
Research support was provided by the Gordon and Betty Moore Foundation and previous funding from NASA's Interdisciplinary Earth Science program. We thank the University of Minnesota's Institute on the Environment for general institutional support. This work also benefited from contributions by General Mills, Mosaic, Cargill, Google, PepsiCo, and Kellogg to support stakeholder outreach and public engagement.