

Abstract
Due to its prevalence in modern infrastructure, concrete is experiencing the most rapid increase in consumption among globally common structural materials; however, the production of concrete results in approximately 8.6% of all anthropogenic CO2 emissions. Many methods have been developed to reduce the greenhouse gas emissions associated with the production of concrete. These methods range from the replacement of inefficient manufacturing equipment to alternative binders and the use of breakthrough technologies; nevertheless, many of these methods have barriers to implementation. In this research, we examine the extent to which the increased use of several currently implemented methods can reduce the greenhouse gas emissions in concrete material production without requiring new technologies, changes in production, or novel material use. This research shows that, through increased use of common supplementary cementitious materials, appropriate selection of proportions for cement replacement, and increased concrete design age, 24% of greenhouse gas emissions from global concrete production or 650 million tonnes (Mt) CO2-eq can be eliminated annually.
Export citation and abstract BibTeX RIS

Original content from this work may be used under the terms of the Creative Commons Attribution 3.0 licence. Any further distribution of this work must maintain attribution to the author(s) and the title of the work, journal citation and DOI.
Resource consumption
Population growth and changes in the world economy combined with technological and political change over the last 65 years have led to an increase in the percentage of the world's population living in urban areas, which rose from 30% to 54% [1]. In the next 35 years, 66% of the world's population is expected to reside in urban areas, which is an increase of 2.5 billion people [1]. These population shifts have led to a dramatic increase in both the quantity and scale of infrastructure [2, 3]. Internationally, the resultant rise in construction material demand has been driven by different factors: some countries are experiencing infrastructure that has lost functionality, whereas other countries are seeking to expand infrastructure [2]. In countries with developing economies, the consumption associated with expansion is exacerbated by the potential need to replace structures before they reach the end of their design life [3].
Of the most common globally used construction materials, concrete has experienced the most rapid growth in consumption over the past 50 years; its consumption has increased 2-fold relative to that of steel and is approximately 6 times higher than that of wood and wood-based products on a per capita basis [4–7]. Concrete, which is composed of several materials, including cement, water, granular rocks (aggregates), and, depending on the application, chemical admixtures and/or reinforcing fibers, is highly desirable because of its ease of production and low cost. Consequently, the world consumed approximately 3.8 Gt of cement, over 2 Gt of water used in concrete mixtures, and 17.5 Gt of aggregate in 2012, which total approximately 10 billion m3 of concrete (table 1).
Table 1. Global concrete and concrete constituent consumption Calculations of the presented values can be found in supplementary material section 4. Note: the totals reflect rounding and estimates associated with the import/export of cement and its constituents.
| Cementitious constituent consumption by type | ||||||||||
|---|---|---|---|---|---|---|---|---|---|---|
| Region | Hydraulic cement consumption (Mt) | Clinker (Mt) | Gypsum (Mt) | Limestone (Mt) | Ash (Mt) | Slag (Mt) | Other (Mt) | Design batch water (Mt) | Aggregates (Mt) | Concrete (106 m3) |
| Africa | 177 | 136 | 9 | 21 | 3 | 2 | 5 | 93 | 786 | 451.7 |
| Australia and New Zealand | 12 | 10 | 1 | 1 | 0 | 1 | 0 | 7 | 58 | 33.3 |
| Brazil | 72 | 49 | 3 | 5 | 2 | 10 | 3 | 37 | 307 | 177.4 |
| Canada | 10 | 8 | 0 | 0 | 0 | 1 | 0 | 6 | 50 | 28.3 |
| China | 2203 | 1605 | 102 | 176 | 100 | 186 | 35 | 1189 | 9915 | 5704.7 |
| CIS | 103 | 83 | 5 | 1 | 0 | 12 | 2 | 60 | 516 | 292.0 |
| Europe | 234 | 175 | 9 | 15 | 7 | 21 | 8 | 127 | 1063 | 610.4 |
| India | 268 | 192 | 12 | 1 | 48 | 14 | 2 | 157 | 1274 | 737.8 |
| Japan | 46 | 34 | 2 | 0 | 0 | 10 | 0 | 26 | 224 | 126.3 |
| Middle East | 191 | 156 | 9 | 11 | 2 | 7 | 7 | 106 | 907 | 516.7 |
| Rest of Americas | 108 | 76 | 4 | 10 | 1 | 8 | 9 | 55 | 456 | 264.1 |
| Rest of Asia and Oceania | 321 | 256 | 13 | 25 | 6 | 10 | 10 | 178 | 1510 | 861.5 |
| United States | 80 | 67 | 3 | 2 | 2 | 3 | 2 | 52 | 452 | 253.9 |
| Total | 3826 | 2846 | 171 | 270 | 171 | 284 | 84 | 2093 | 17 518 | 100 58.0 |
Cement production and greenhouse gas (GHG) emissions
Although there are many local, regional, and global impacts from the production of cement and concrete materials, the focus of this analysis is on greenhouse gas (GHG) emissions because of the typically high associated GHG emissions from the production of cement. Cement can contain a variety of constituents, including clinker (a kilned and quenched cementitious product), gypsum, and supplementary cementitious materials (SCMs) (the most commonly reported are fly ash, a byproduct from coal combustion, slag, a byproduct from steel refining, and naturally occurring materials, such as limestone or natural pozzolans [8]). Of these constituents, clinker is responsible for 65%–85% of the global cement mass (table 1) and 90%–98% of cement GHG emissions (figure 1). These high relative emissions are a function of two main components: (1) during the manufacturing of clinker, through a process called calcination, commonly available calcium carbonate (CaCO3) undergoes a reaction to produce calcium oxide (CaO) and emits carbon dioxide (CO2); and (2) during the formation of calcium silicates, the materials used to form clinker are heated to temperatures of approximately 1400 °C [3, 9], which requires large energy inputs and results in additional GHG emissions. Depending on the equipment efficiency, the kiln fuel and the energy mixes, as well as the other materials used in the production of cement, the GHG emissions associated with calcination can range from 45% to 60% of the total cement GHG emissions (supplementary material section 6).
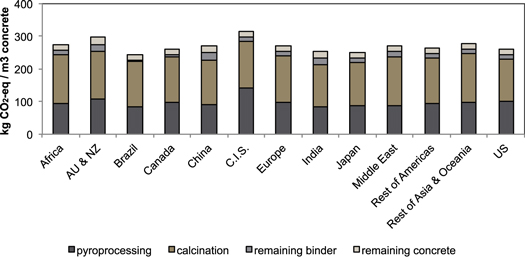
Figure 1. Greenhouse gas emissions from the production of concrete by cubic meter. Contributions from the two highest emitting components of concrete production (i.e., CO2 emissions from calcination and CO2-eq emissions from thermal energy use in cement production) are shown relative to the remaining emissions from cement production and the remaining greenhouse gas emissions from concrete production. (The calculation of values can be found in supplementary material sections 5 and 6). Note: C.I.S. is used as an abbreviation for the Commonwealth of Independent States.
Download figure:
Standard image High-resolution imageDepending on a regions' manufacturing technology, energy mix, SCM use, and concrete strength requirements, the production of 1 m3 of concrete produces varying amounts of GHG emissions. However, based on regional averages for production and demand, the arithmetic mean GHG emissions for the production of 1 m3 of concrete fall in a relatively tight range: from 240 to 320 kg CO2-eq/m3 (figure 1), with 90%–95% attributed to the production of cement. Although the emissions associated with the production of concrete and its constituents play a large role in the global warming potential per cubic meter of concrete in any given region, the overall consumption of concrete is the largest factor contributing to GHG emissions (figure 2). For example, using the assessment method presented in the supplementary material, despite the near average emissions per m3 of concrete produced (270 kg CO2-eq/m3), high levels of concrete consumption in China resulted in approximately 1.5 Gt of GHG emissions from concrete production in 2012. This value is over 84% greater than concrete-related GHG emissions in any other country or region in the world.
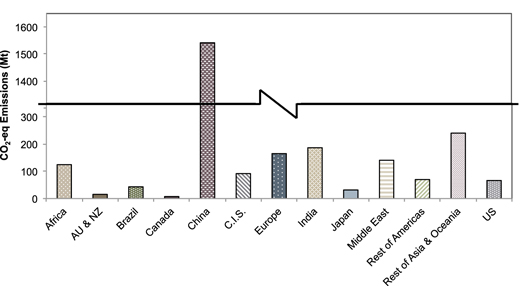
Figure 2. Cumulative greenhouse gas emissions from concrete manufacturing by region. Based on regional cement production technology, cement constituents, energy mixes, strength requirements, and consumption values, cumulative greenhouse gas emissions associated with manufacturing concrete by region is shown. (The calculation of values can be found in supplementary material sections 5 and 6). Note: C.I.S. is used as an abbreviation for the Commonwealth of Independent States.
Download figure:
Standard image High-resolution imageOpportunities for improvement
Because of the GHG emissions associated with concrete production, many methods have been investigated to reduce these impacts. Among the most common methods discussed for reducing GHG emissions are : (1) substitute raw materials in cement; (2) use alternative fuels in manufacturing; (3) improve kiln efficiency and electricity usage; and (4) develop carbon capture and storage [3, 10, 11]. In this vein, researchers have examined the role of mitigation strategies, such as alternative fuel sources or improved equipment efficiency, on CO2 emissions in cement production as well as inherent uncertainties or barriers to use (e.g., [12]). Similarly, Neuhoff et al [13] discussed several modes for CO2 emission mitigation in cement production, but coupled the discussion with a detailed analysis of financial and policy roles in implementation. Additionally, more detailed and localized assessments have been conducted on the role of different production methods on the CO2 emissions from cement production (e.g., [14]). While several researchers have examined mitigation methods for GHG emissions for the production of concrete (e.g., [15, 16]), to the best of the authors' knowledge, such studies have not been conducted at a global scale.
Although there are many approaches for potentially reducing the GHG emissions from concrete production, many of these methods have roadblocks to their implementation. Among these inhibitors to implementation are the following: the required monetary investment [17]; the future price of fuels and the ability to use certain fuels [3, 10]; the level of maturation of technologies [3, 10]; the viability and regional availability of SCMs; and the role of stakeholder participation beyond manufacturers [3].
Although barriers to implementation are inherent in most approaches to reduce the GHG emissions from the cement and concrete industries, it is possible to reduce the GHG emissions from concrete production in ways that would not require new production equipment, significant changes in design codes, further academic research or validation, or specialized training. In this research, three such methods are examined for their GHG emission mitigation potential. Through this study, abatement strategies for concrete are examined at a global scale, rather than local assessments or solely cement based approximations. This research takes into consideration world consumption of concrete, structural strength requirements, and availability of cementitious resources to characterize the role that currently accepted greenhouse gas emissions mitigation methods could have if they were implemented to a greater extent. To quantify the potential reduction in GHG emissions from concrete manufacturing in this research, the approximations for global concrete demand were made based on consumption statistics, strength requirements, and the reported technologies and energy mixes used in concrete manufacturing by region.
GHG emissions from concrete manufacturing were determined by conducting life-cycle assessments (LCAs), a method for evaluating the environmental effects associated with a material or product over its life cycle [18]. The LCAs were performed by incorporating relevant processes from raw material acquisition through production based on one cubic meter of concrete. Because of the prevalence in reporting on the use of fly ash, slag, and limestone as SCMs [8] and the availability in production or reserves of these materials, these SCMs were considered to be possible binder replacements at varying ratios. Potential mixture proportions in the analysis were determined based on the strength requirements and the current use of SCMs. Using the availability of resources such as aggregates, SCMs, and cement combined with regional energy mixes and the efficiency of manufacturing methods, the GHG emissions associated with the production of concrete were assessed globally based on 13 regions (details on regions are given in supplementary material section 1). For this research, all hydraulic cement was assumed to be used in the production of concrete as 95% of cement is reported to be used in concrete [3]. The impacts were weighted by regional use of different strength classes and scaled based on regional material consumption. This assessment method allowed for consideration of average regional production methods and demand as well as considerations for the role of GHG emissions from concrete constituents, transportation, and compressive strength. While this method does not account for all possible concrete mixtures, nor does it capture other material property requirements, it provides an initial baseline to assess GHG emissions and mitigation methods for global concrete production (for more details, see supplementary material section 5).
Based on these data, three mechanisms were evaluated for their potential to lower the GHG emissions from concrete production. The mechanisms considered are as follows: (1) the increased use of fly ash and slag, as well as increased use of limestone filler (at 20% and 35% replacement), as components of cementitious materials; (2) the ideal allocation of SCMs, knowing certain strength goals benefit from different levels of particular SCM use; and (3) the use of higher design ages, past the typical 28 d strength, to benefit from concrete strength development when possible. These methods for potential GHG emissions reduction were selected because they are based on currently used strategies [19, 20] that have not been implemented to their full abilities in terms of mitigation potential. Additionally, the methods selected do not require changes in production equipment or fuel sources, suggesting they could be rapidly implemented if accepted by decision-makers.
The first of these three mechanisms is based on the often-studied concept of reducing GHG emissions from concrete by reducing the quantity of clinker-based cement content. From assessments conducted on fly ash and slag production as well as their consumption, respectively, the quantities produced globally exceed consumption (see supplementary material section 4). Because these SCMs and limestone have gained acceptance for use in the concrete industry, the first improvement method considers the use of all produced fly ash and slag as potential cement replacement, which was modeled as each region using 8% more fly ash and 28% more slag. Additionally, up to 35% limestone use as clinker replacement for concrete mixtures not containing other SCMs was assessed. Although different regions produce varying levels of SCMs, this assessment assumed use of a uniform increase in replacement average to avoid issues with the regions that produce disproportionately high levels of SCMs.
As the second potential improvement method, the use of mixtures with an ideal distribution of SCM replacement to provide the lowest GHG emissions while maintaining each region's average consumption and strength requirements was examined. To conduct this assessment, representative concrete mixtures with varying SCM replacement levels were used. While keeping within the bounds of each region's average SCM consumption, ideal percent SCM replacement for each strength class was determined to meet design strength demands with the lowest GHG emissions.
Finally, the third improvement considered was an assessment of the influence of design age on potential GHG emission reductions, which was examined at three alternative design ages beyond the typical 28 d design age (i.e., 56, 90, and 180 d). By using higher design ages, the structural design methods do not have to be altered, but by allowing concrete strength development to occur with a higher concrete design age, potentially less cement is necessary to meet the concrete strength requirements in any given region (for more details, see supplementary material section 7). With lower clinker-based cement demand, lower GHG emissions per cubic meter of concrete production can potentially be achieved.
It must be noted that there are limitations to the assessments conducted. The increased use of SCMs investigated in this study was limited to fly ash, slag, and limestone because of the established acceptance of their use in hydraulic cement and readily available data. However, the baseline models used for current concrete production accounted for the use of other SCMs. While not assessed here, the methods in this research could be applied to increased use of SCMs such as natural pozzolans and calcined clays, as well as the potential to achieve better properties through ternary or quaternary blends (i.e., by using three or four types of cementitious materials in the concrete binder) [21]. Additionally, due to availability of data, only a fraction of all possible SCM replacement levels were considered. Also, the role of aging on changes in concrete strength were limited to the models based on the literature cited and could vary with different properties of concrete constituents. For greater details and a discussion of the uncertainty considerations for this research, see the supplementary material.
Potential benefits of changes considered
The assessment method presented of concrete production in 2012 indicates that direct emissions from concrete manufacturing represent 7.3% of all anthropogenic GHG emissions from energy and processes, 8.6% of all anthropogenic CO2 emissions, and 23% of industrial process and energy CO2 emissions (supplementary material section 9 and [22, 23]); when considering supply-chain inclusive emissions, this percentage will be higher [24]. These results were used as a baseline to perform an assessment of potential mitigation through implementing the mechanisms discussed. It must be noted that these results are dependent on the methods used for calculation, the mixtures used to calculate necessary rations of constituents to meet desired compressive strength, limitations in representative mixtures used, and available data (for more detail, see discussion in supplementary material section 8).
Implementing the three mechanisms to reduce global GHG emissions from concrete production resulted in different degrees of potential reduction (figure 3). The currently high use of fly ash has resulted in low excess annual production of this SCM, so a negligible reduction in GHG emissions was noted. With greater predicted unused production streams of slag in concrete, the use of all produced slag resulted in a reduction of 74 Mt of CO2-eq emissions (i.e., a little over 1% reduction). The increased use of limestone filler resulted in a decrease of 70 Mt at 20% replacement and 312 Mt of GHG emissions at 35% replacement. Considering the nonlinear additive properties of using each of the SCMs, the cumulative reductions can be 111 Mt of CO2-eq emissions or 326 CO2-eq emissions with 20% or 35% limestone replacement, respectively. The use of ideal mixture proportions, which maintain the required strength and meet regional consumption averages, resulted in a reduction of 119 Mt of GHG emissions. Higher design ages, which capitalize on concrete strength development as a function of time, typically allow for lower levels of cement to be used leading to potential reductions in GHG emissions. At a 56 d design age, a decrease in emissions by 119 Mt can be expected. At 90 and 180 d, reductions of 165 and 281 Mt have been projected, respectively. Although some designers may be disinclined to increase the time for concrete to reach the desired strength, this method may be applicable depending on the design scenario. For the analyzed regions, the greatest reduction contributions were typically achieved through the implementation of improvements in China, followed by the remaining Asia and Oceania region and India. If all of these measures were implemented, again accounting for the nonlinear additive properties of the considered measures, then the GHG emissions from concrete can be decreased by 24% based on 2012 consumption values. This reduction is equivalent to over 650 Mt of GHG emissions.

Figure 3. The influence of design alterations on the regional global warming potential associated with concrete production. The original emissions that are associated with concrete production for 2012 are shown, along with the three proposed methods for reducing emissions and the reduction in emissions using all three methods concurrently. The combination of all three methods assumes a design age of 180 d as well as use of fly ash, slag, and 35% limestone replacement. In the combination of methods, a lower relative reduction is found from using increased time and the ideal mixture proportions because of a greater quantity of the increased use of limestone, which influences the strength development of concrete. The percentage reductions from each method are shown (the calculation of the values can be found in supplementary material sections 7 and 9).
Download figure:
Standard image High-resolution image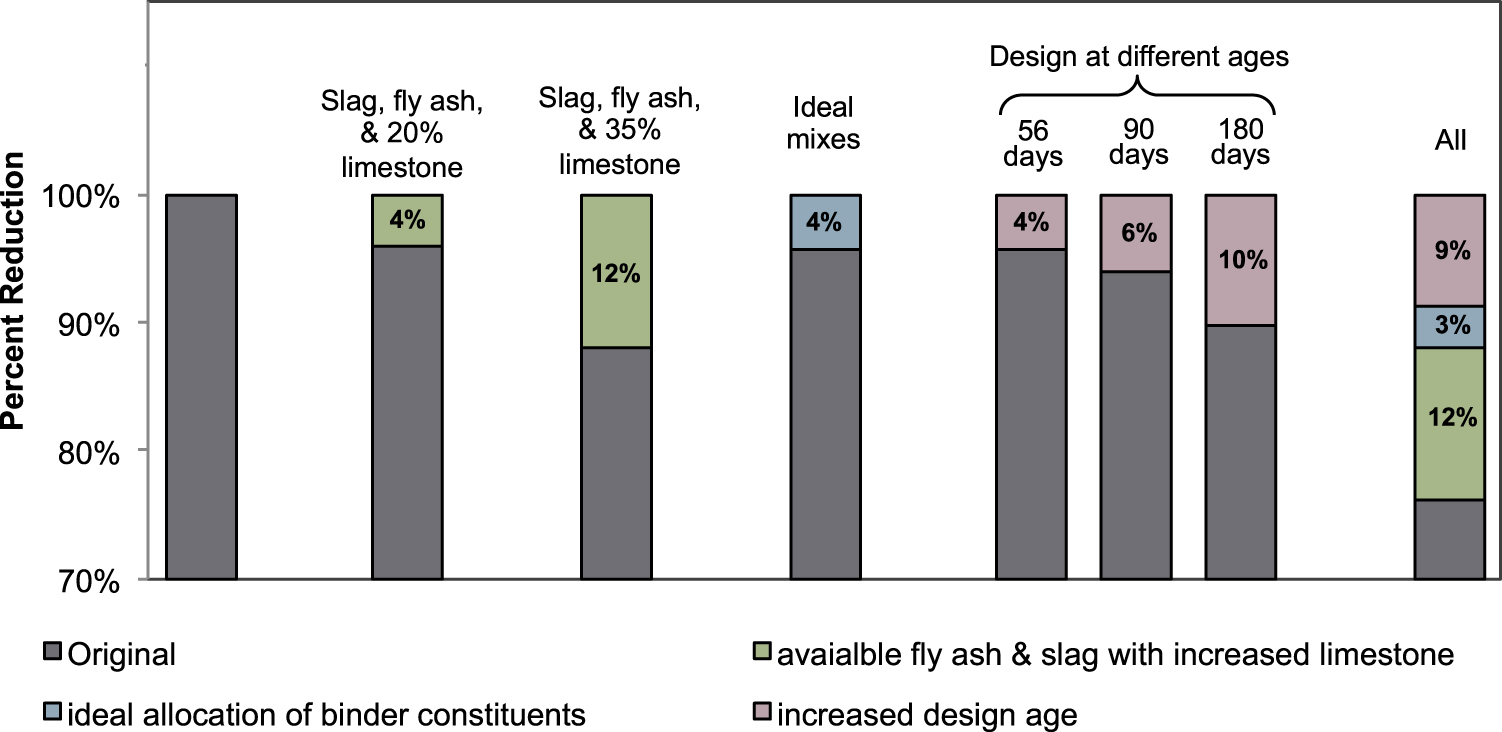
Opportunities for implementation
According to the findings, reduction in emissions from concrete production can be achieved with no changes in either technology or manufacturing methods or the use of novel concrete constituents. These methods can better inform policy decisions that surround cement and concrete use. The policies in the regions that are expanding their infrastructure have raised concern because of notably high concrete consumption [3, 25]. These regions can benefit from changes to typical practices that will accommodate future demands and offset high emissions [2]. The ability to implement different improvements is highly dependent on many factors, such as institutional systems, resource availability, geography and climate, as well as social and economic factors [17]. However, the simplicity of the methods proposed here can overcome many of the challenges faced by commonly proposed GHG emissions reduction methods because the classic production chains would not need to be altered. However, similar to many emissions reduction policies for cement and concrete, the cooperation among different stakeholders and consumer education can play a critical role in implementation [3, 20, 26, 27]. For example, a potential avenue to encourage some of the methods presented in this research is the role of carbon markets. In 2014, the average price of CO2 was $7/tonnes [22] and the emissions-to-cost ratio of cement in 2012 was approximately 8950 g CO2/$ cost [4] based on US data. When considering the carbon intensity of large markets such as China (671 g CO2/$ GDP in 2013 [28]) and the US (356 g CO2/$ GDP in 2013 [28]) and acknowledging the global emission caps required to limit the global temperature rise to 2 °C (33–73 g CO2/$ GDP [28] for new production cumulatively across industries), adjustments to the constituents and processing of concrete are excellent targets for increased mitigation. While some barriers to pass-through of carbon prices have been noted in some markets [13], the changes to cement and concrete production discussed in this research can be valuable methods to reach goals in this financially driven market in the future.
This research identifies three methods to reduce the emissions associated with concrete production globally. Because of the nature of the proposed methods, they can be executed globally with minimal barriers to implementation. Although the proposed methods are simple, if employed, their use can result in significant emission reductions from the concrete sector. To gain a sense of the role these mitigation strategies can have, one can examine emissions reductions for a grater period of time. Here we calculate such reductions using the projections of cement consumption [29, 30], a linear trend in annual global consumption, assuming the same ratios of materials are available annually, and no other improvements are considered. Based on this simplified assessment, the cumulative emissions that could be offset if all three methods were globally implemented in 2016 would be 23–28 Gt CO2-eq by 2051, which is equivalent to 60%–75% of all the processing and energy-related emissions from 2013 [22]. It is interesting to note that these improvements are not highly dependent on increasing use of fly ash and slag, both of which are byproducts of processes that may diminish under the pressure of emissions reduction measures; over 95% of the emissions reductions reported in this study could be achieved through increased limestone use, increased design age, and ideal mixture proportion selection.
Acknowledgments
SM gratefully acknowledges the support of the University of California President's Postdoctoral Fellowship Program. This work represents the views of the authors, not necessarily the view of the sponsor.