

Abstract
Increasing energy demands and the drive towards low carbon (C) energy sources has prompted a rapid increase in ground-mounted solar parks across the world. This represents a significant global land use change with implications for the hosting ecosystems that are poorly understood. In order to investigate the effects of a typical solar park on the microclimate and ecosystem processes, we measured soil and air microclimate, vegetation and greenhouse gas emissions for twelve months under photovoltaic (PV) arrays, in gaps between PV arrays and in control areas at a UK solar park sited on species-rich grassland. Our results show that the PV arrays caused seasonal and diurnal variation in air and soil microclimate. Specifically, during the summer we observed cooling, of up to 5.2 °C, and drying under the PV arrays compared with gap and control areas. In contrast, during the winter gap areas were up to 1.7 °C cooler compared with under the PV arrays and control areas. Further, the diurnal variation in both temperature and humidity during the summer was reduced under the PV arrays. We found microclimate and vegetation management explained differences in the above ground plant biomass and species diversity, with both lower under the PV arrays. Photosynthesis and net ecosystem exchange in spring and winter were also lower under the PV arrays, explained by microclimate, soil and vegetation metrics. These data are a starting point to develop understanding of the effects of solar parks in other climates, and provide evidence to support the optimisation of solar park design and management to maximise the delivery of ecosystem services from this growing land use.
Export citation and abstract BibTeX RIS

Original content from this work may be used under the terms of the Creative Commons Attribution 3.0 licence. Any further distribution of this work must maintain attribution to the author(s) and the title of the work, journal citation and DOI.
Introduction
Increasing energy demands and the need to move to low carbon (C) energy sources has promoted the development of renewable sources of energy (BP 2014). Solar photovoltaics (PV) has the greatest potential for power generation amongst all renewables, and the growth rate has accelerated in recent years and this trend is expected to continue (Pogson et al 2013, EPIA 2014, REN21 2014). A substantial proportion of PV comprise solar parks—arrays of ground-mounted PV modules, generally tilted toward the equator and arranged in rows with gaps between to prevent shading of the subsequent row. In Europe solar parks are most often located in converted arable and grasslands and represent a significant land use change given their relatively low energy density (MacKay 2013). Within the UK, Europe and globally land use change for ground-mounted solar PV in 2013 was approximately 15–79 km2, 204–1019 km2 and 554–2772 km2, respectively. Further expansion of large-scale solar parks are predicted in Europe and countries within 35° of the equator (DOE 2004, EPIA 2014, Europe 2015).
Solar parks may have consequences for microclimate, C cycling, biodiversity, water, soil erosion, air quality and ecosystem energy balances (Armstrong et al 2014, Hernandez et al 2014), yet there has been little research effort to quantify impacts. These impacts may occur at the regional scale (Millstein and Menon 2011), but the physical presence of PV arrays may also promote within solar park variation in climate and ecosystem function. The physical presence of solar parks will impact solar radiation fluxes (and thus temperature), wind speed and turbulence (and thus the exchange of biogenic gases and water vapour) and the distribution of precipitation within the solar park (Armstrong et al 2014). Given the climate regulation of ecosystem processes (Gu et al 2002, Flanagan and Johnson 2005, Bond-Lamberty and Thomson 2010), resolving the impacts of PV arrays on the soil and near surface climate within solar parks is essential. The spatial and temporal dynamics of solar park-induced microclimates on ecosystem processes is likely to be different to projected climate change. Consequently, given the complex nature of terrestrial C cycling (Heimann and Reichstein 2008), implications for plant–soil processes are unknown. Further, solar park management, in particular that relating to the vegetation (i.e. seeding, mowing, grazing and fertiliser addition), will be a strong determinant of ecosystem response.
The aim of this research was to investigate the effect of PV arrays on the microclimate and plant–soil processes as a result of differences in the microclimate and grassland management within a typical solar park. We hypothesised that: (1) PV arrays promote differences in both seasonal and diurnal variation in microclimate metrics and (2) differences in microclimate and vegetation management together explain variance in plant diversity, above-ground biomass, and ecosystem CO2 fluxes. We also discuss the potential implications of the variation in microclimate on some plant–soil ecosystem processes.
Materials and methods
This research was undertaken at Westmill Solar Park, UK (51 °37'03''N 01°38'45''W), a 5 MW capacity solar park with 36 PV array rows covering 12.1 ha installed in 2011 (figure 1(a)). The PV array rows were 4.4 m wide, had a gap between the rows of 11.2 m, faced south, and were at an angle of 30°. The footprint under the PV arrays was 2.9 ha, the gap area was 5.8 ha and the designated control area (that which was greater than 7 m from a PV array row in the N–S direction) was 3.4 ha. Prior to conversion to a solar park, the field site was arable cropland and was sown with a species-rich meadow mixture prior to construction. After construction there was very limited germination and therefore the gap and control areas were re-seeded with the same seed mix. For three years prior to the study the site was managed as permanent grassland with winter sheep grazing and mowing of ∼1.5 m wide strips in front of the PV arrays annually to prevent shading of the PV arrays (no sampling was undertaken in mown areas).
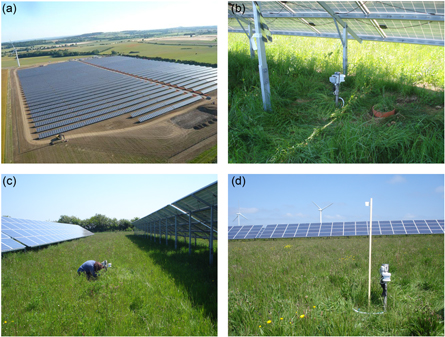
Figure 1. (a) Aerial photograph of Westmill Solar Park (photo courtesy of Neil B. Maw), (b) an under plot, (c) a gap plot and (d) a control plot.
Download figure:
Standard image High-resolution imageTo determine effects of the solar park on plant–soil properties and C cycling, measurements were made at twelve 1.5 m2 plots. Four of the plots were located in each of the three designated treatment areas: under the PV arrays, in the gaps between the PV arrays and in the control area, referred to as under, gap and control treatments (figure 1). The exact spatial location of the plots was randomly selected within the treatment areas and sheep exclusion fencing was erected. At each plot microclimate, soil properties, vegetation and greenhouse gas (GHG) metrics were measured.
Microclimate
At each plot soil and air microclimate metrics were sampled every minute and the average over each hour recorded from 27/06/13 13:00 to 27/06/14 12:00. At all plots, air (50 cm above the surface) and soil (10 cm below the surface) temperature, soil moisture (10 cm below the surface) and relative humidity (RH, 50 cm above the surface) were recorded (Tempcon, UK: HOBO Micro Station with S-TMB-M002, S-THB-M002 and S-SMD-M005). In addition, at one plot of each of the treatments, wind speed (150 cm above the surface), rainfall (120 cm above the surface) and photosynthetically active radiation (PAR, 130 cm above the surface) were recorded (Tempcon, UK: HOBO U30 data logger, S-LIA-M003, S-RGB-M002, S-WSA-M003, S-WDA-M003). At one under and one control plot, total and diffuse radiation were also recorded (Delta-T, UK: BF5 sunshine sensor and GP1 data logger, 130 cm above the surface); direct radiation was calculated by difference.
Absolute humidity (AH) and vapour pressure deficit (VPD) were derived from temperature, T, relative humidity, RH, and the saturated vapour pressure, es, following Ward and Trimble (2003):
Growing degree days (GDD) were calculated using a threshold of 5.5 °C (MetOffice 2015). Growing season length was calculated as the time period from the first five consecutive days above 5 °C after 1st March and the first five consecutive days below 5 °C after 1st July following a modified version of the Met Office (2015).
Soil properties
The soil from the A horizon at each plot (n = 12, four under the PV arrays, four in the gaps between the PV array rows and four in control areas) was analysed for total C and N, bulk density, particle size distribution and microbial C and N. Soil surface bulk density was determined from an oven dried (105 °C) 5.3 cm diameter, 10 cm long soil core (Carter and Gregorich 2007). Total C and N were determined on a 30 mg homogenised and oven dried (60 °C) subsample of a 5.3 cm diameter, 10 cm long core (LECO Truspec CN Analyser, USA) and C:N was calculated (Carter and Gregorich 2007). A 5 g sub sample of the same core was used to derive the median particle size by analysing the primary soil particle size distribution in triplicate using MasterSizer 2000MU laser diffraction particle sizer (Malvern, UK), after the organics had been removed using a modified version of Gale and Hoare (1991). Soil microbial biomass C and N were determined using an ethanol-free chloroform fumigation—potassium sulphate extraction procedure, as detailed in Ward et al (2007), using soil taken from each plot on 27/06/14 using a 5.5 cm diameter, 4.5 cm long core.
Vegetation
Species level percentage cover in each of the 30 cm diameter GHG collars (see below; n = 12, four under the PV arrays, four in the gaps between the PV array rows and four in control areas) was surveyed on 02/07/13, the number of species counted and the ratio of the number of non-grass to grass species calculated. Above-ground biomass was determined by harvesting all the vegetation from the GHG collars on 27/06/14 (after the last set of GHG measurements and at the time of peak biomass) and oven drying (60 °C) to constant weight.
Greenhouse gas fluxes
At each plot, GHG fluxes were monitored monthly from July 2013 to June 2014 using 30 cm diameter static chambers (Armstrong et al 2015). Net ecosystem exchange (NEE) and ecosystem respiration were measured using an EGM-4 infrared gas analyser (PP Systems, USA) attached to clear and opaque chambers, respectively. CH4 and N2O concentrations were determined from samples taken from opaque chambers and analysed in the laboratory using a Perkin Elmer Autosystem XL Gas Chromatograph (see Ward et al 2013). GHG concentrations were quality controlled and those affected by poor chamber seals, leaking vials or instrument malfunction removed. If the variation in CH4 and N2O concentrations in the field samples was less than two times the standard deviation of the standards the fluxes were considered to be below the limit of detection. Fluxes, as mg CO2–C, CH4–C or N2O mg m−2 h−1, were calculated following Levy et al (2012). CO2 assimilated through photosynthesis was estimated by subtracting ecosystem CO2 respiration from NEE.
Statistical analysis
All statistics were undertaken using Stata 13 (StataCorp 2013) and p values <0.05 deemed significant. Differences in soil properties (C, N, C:N, median particle size, bulk density, microbial biomass C, microbial biomass N and microbial biomass C:N), GDD and growing season length between the treatments were tested for significance using a one way ANOVA with a Bonferroni multiple comparison posthoc test. The GHG data were analysed using a repeated measures linear mixed model with treatment, date and their interactions as fixed effects and site as a random effect and the significance of treatment, date and their interaction and the dates on which there was a significant difference between the treatments determined. The models were run for CH4 and N2O with all the data (i.e. including that below the limit of detection) as the reduced dataset was too unbalanced for rigorous analysis. In order to establish the relative importance of biotic and abiotic controls over the GHG fluxes a two-step analysis was undertaken. Firstly, principal components analysis (PCA) was used to reduce dimensionality and avoid colinearity between the variables. The first three PCs and their interactions were entered into generalised linear models with a log link and Gaussian family to explain variation in respiration, calculated photosynthesis, NEE, CH4 and N2O. As the PCs are standardised the magnitude of the coefficients were used as an indication of effect size.
The seasonal variation in daily arithmetic average, minimum and maximum soil and air temperature, soil moisture, AH and VPD for each treatment were compared by fitting a linear mixed effects model with treatment, season (using day of the year sine and cosine functions) and their interactions as fixed effects and season and site as random effects. If the 95% confidence intervals from the fitted models did not overlap then the differences between the treatments were deemed significant.
Significant differences in the diurnal variation in daily arithmetic average soil and air temperature, soil moisture, AH and VPD between the treatments was determined using the same method as for seasonal variation but using the time of day sine and cosine functions. This was undertaken for each month separately to allow assessment of changing trends during the annual cycle. As sunrise and sunset times vary through the year, fraction of day was calculated, with sunrise as 0.0 (or 1.0), sunset as 0.5 and time linearly scaled between. The resulting fractions of day values were categorised into 24 pseudo-hourly bins and used in the analysis instead of time.
Least squares linear regression was used to determine the proportion of wind speed, rainfall, PAR, total, diffuse and direct radiation at the gap and under treatments compared with the control (using the gradient coefficient).
Results
In the following sections we outline the measured variation in microclimate, vegetation and soil properties, and greenhouse gas fluxes within the solar park.
Microclimate effects
There were clear differences in the microclimate due to the presence of the PV arrays at both seasonal and diurnal scales. From spring to autumn, soil under the PV arrays was significantly cooler (up to 5.2 °C daily average) compared to the control and gap treatments, with reductions of up to 3.5 °C and 7.6 °C for the daily minimum and maximum respectively (figures 2, S1 and table S1). These cooler average temperatures occurred throughout the diurnal cycle in spring and summer (figure 3). Also, the daily variation in air temperature was lower under the PV arrays; daily minimum and maximum temperatures were significantly warmer (up to 2.4 °C) and cooler (up to 6.0 °C) respectively, compared with control and gap treatments from spring to autumn (figures 2, S1 and table S1). These opposing trends resulted in no significant difference in the daily average air temperature; however, from April to September air was consistently cooler under the PV arrays during the day and warmer at night (figure 3).

Figure 2. Significant seasonal differences in the (a) daily average soil temperature, (b) daily maximum air temperature, (c) daily minimum AH and (d) daily maximum VPD between the control, gap and under treatments. The solid line represents the mean fitted by a linear mixed effects model and the dashed lines the 95% confidence intervals.
Download figure:
Standard image High-resolution image
Figure 3. Significant diurnal differences in daily average soil temperature during the summer (a) and winter (b), air temperature during the summer (c) and winter (d), VPD during the summer (e) and winter (f) and AH during the summer (g) and winter (h) between the control, gap and under treatments. The solid line represents the mean fitted by a linear mixed effects model and the dashed lines the 95% confidence intervals. Shading represents night time.
Download figure:
Standard image High-resolution imageFrom spring to autumn, the daily average VPD was up to 337 Pa lower, the daily minimum AHs and VPDs were higher (up to 1.3 g m−3 and 1009 Pa respectively) and the daily maximums lower (up to 5.6 g m−3 and 108 Pa respectively) (figure 2, table S1). In terms of the diurnal variation, from spring to autumn VPD was lower under the PV arrays during the day and higher during the night compared to gap and control areas (figure 3).
During autumn and winter the soil in the gap treatments was, on average, 1.7 °C cooler than the control and under treatments throughout the diurnal cycle (figures 3, S1, table S1). Air temperature in the gaps was also significantly cooler (up to 2.5 °C) during the day but not during the night compared with the control and under treatments figure 2, table S1).
Growing season length was the same for all treatments (6th March–19th November). However, the differences in air temperature led to significantly shorter annual GDDs under the PV arrays compared with the control treatment (2133 ± 22 °C; 2212 ± 32 °C 2186 ± 36 °C, for under, control and gap areas respectively). Microclimatic conditions under the PV arrays were significantly different to those of the control areas: PAR was 92% lower, with a greater proportion of diffuse radiation (90% compared to 79%); rainfall was on average three times higher; and the wind speed was only 14% of that in control areas, although the relationships were relatively weak (R2 = 0.61 and 0.46 respectively). PAR receipts and rainfall in the gaps were similar to the control areas (figure 4), however, the wind speed in the gaps was notably slower (63% on average, R2 = 0.88).
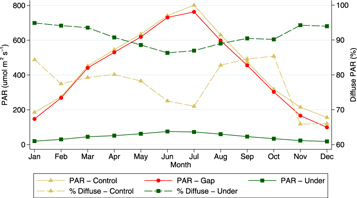
Figure 4. Average monthly day time PAR receipts (μmol m−2 s−1) at control, gap and under treatments and the proportion of diffuse radiation (%) at the control and under treatments.
Download figure:
Standard image High-resolution imageVegetation and soil properties
Total above-ground plant biomass was four times higher in the gap and control areas compared with under the PV arrays (table 1) where there were also significantly fewer species (table 1). With the exception of Achillea millefolium the control and gap areas were more dominated by forbs and legumes compared with under the PV arrays (table 1). Soil properties did not vary between the treatments.
Table 1. Differences in plant community composition and productivity in under, control and gap areas: percentage cover of plant species and bare ground, number of species, non-grass:grass, and above ground plant biomass (g dwt m−2) between the treatment plots (mean ± SD). Different letters denote a significant difference (p < 0.05) in the number of species, non-grass:grass and biomass between treatments.
| Species | Control | Gap | Under | |
|---|---|---|---|---|
| Forbs | Leucanthemum vulgare | 0.8 ± 1.5 | 2.0 ± 2.4 | 0.0 ± 0.0 |
| Plantago lanceolata | 7.5 ± 8.7 | 1.3 ± 2.5 | 0.0 ± 0.0 | |
| Achillea millefolium | 10.0 ± 8.2 | 18 ± 35.0 | 20.0 ± 26.0 | |
| Ranunculus acris | 0.8 ± 1.5 | 0.0 ± 0.0 | 0.0 ± 0.0 | |
| Legumes | Trifolium repens | 24.0 ± 10.0 | 9.8 ± 4.1 | 0.0 ± 0.0 |
| Lotus corniculatus | 1.3 ± 2.5 | 10.0 ± 17.0 | 0.0 ± 0.0 | |
| Onobrychis viciifolia | 1.0 ± 2.0 | 0.8 ± 1.5 | 0.0 ± 0.0 | |
| Grasses | Phleum pratense | 6.3 ± 7.5 | 21.0 ± 27.0 | 15.0 ± 7.1 |
| Poa spp. (pratensis or annua) | 24.0 ± 11.0 | 20.0 ± 15.0 | 41.0 ± 26.0 | |
| Brachypodium sylvaticum | 8.8 ± 12.0 | 0.0 ± 0.0 | 0.0 ± 0.0 | |
| Festuca rubra | 3.8 ± 4.8 | 1.3 ± 2.5 | 3.8 ± 7.5 | |
| Other | Dead/bare | 13.0 ± 2.9 | 16.0 ± 7.5 | 20.0 ± 10.0 |
| Number of species | 4.8 ± 1.0ab | 5.8 ± 2.2a | 2.8 ± 0.5b | |
| Non-grass:grass | 1.5 ± 0.5a | 1.6 ± 0.9ab | 0.3 ± 0.3b | |
| Biomass | 511.1 ± 102.8a | 599.5 ± 143.1a | 131.6 ± 46.5b | |
Greenhouse gas exchange
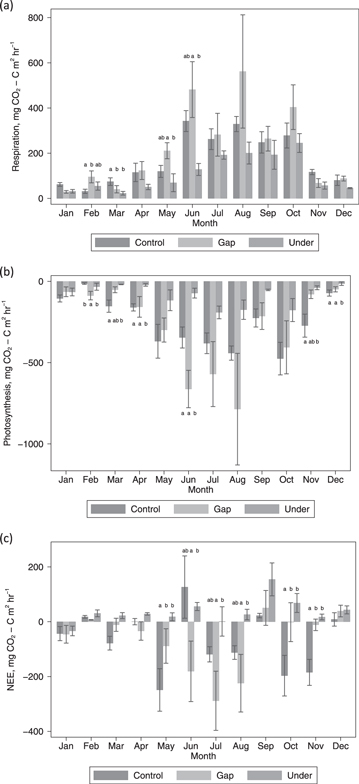
Ecosystem CO2 fluxes were greatest during the summer and lowest during the winter (figure 5). We found significant differences in ecosystem respiration, NEE and photosynthesis rates between the treatments and with sampling date (p < 0.05), with monthly differences in treatment effects for photosynthesis and NEE (treatment*date, p < 0.05). However, differences between treatments did not occur throughout the year and were not consistent across fluxes (figure 5). Ecosystem respiration only differed between treatments in the first six months of the year and was generally lower from under areas (figure 5). Under areas also exhibited lower rates of photosynthesis but the differences occurred throughout the year (figure 5). As indicated by NEE, control and gap areas tended to be a sink of CO2 whereas areas under the PV arrays were more often a source (figure 5). During the summer the gap areas were a significantly greater sink compared with under areas, but in spring and autumn control areas were a greater sink than both under and gap areas (figure 5).
Figure 5. Differences in average (a) ecosystem respiration, (b) photosynthesis and (c) NEE between control, gap and under treatments during the year. Error bars represent the standard error. Only data over the limit of detection are included. On a month-by-month basis, bars with different letters had a significantly different flux.
Download figure:
Standard image High-resolution image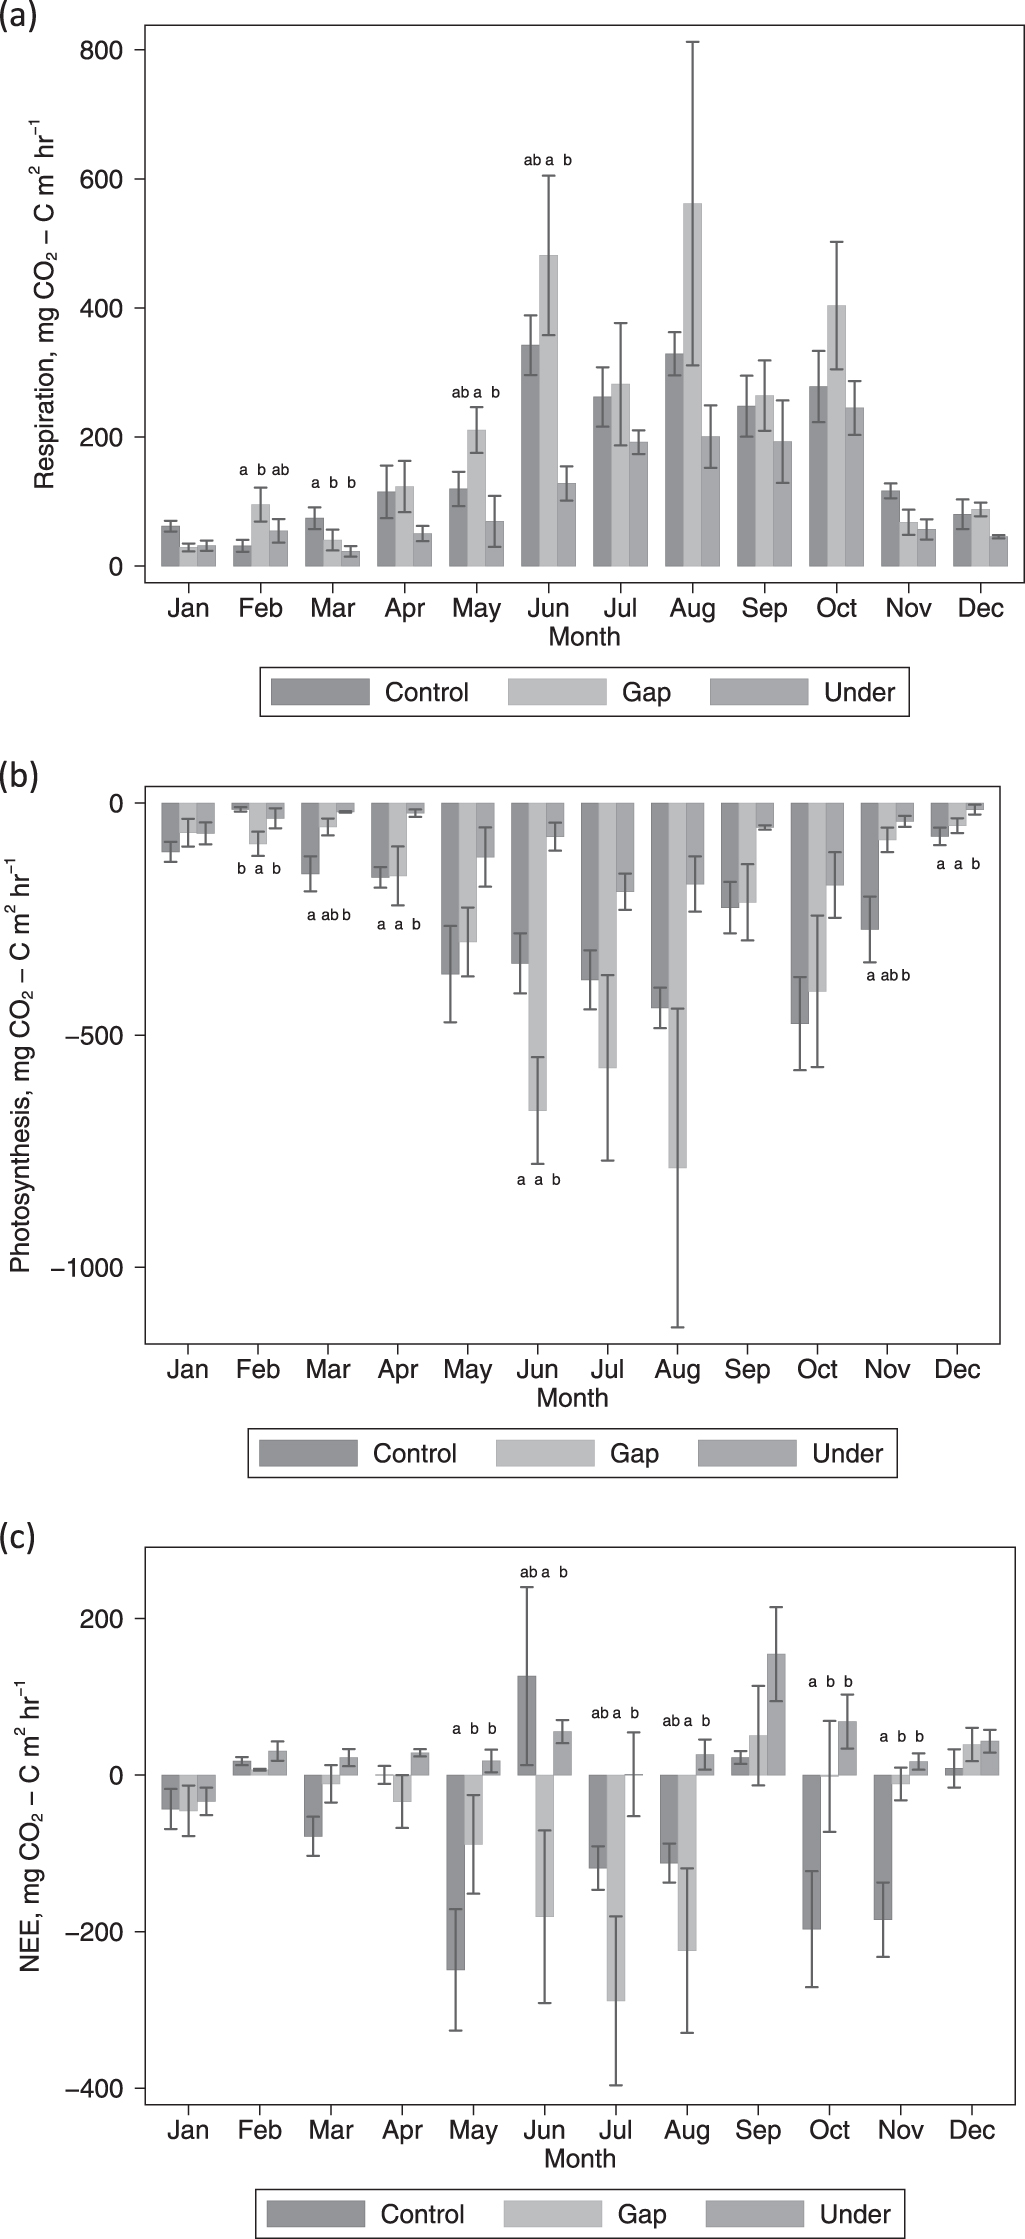
A PCA-GLM model was developed to determine the relative importance of biotic and abiotic metrics in explaining the variation in CO2 fluxes. PCA of all the microclimate, vegetation and soil metrics resulted in three PCs dominated by soil properties (except microbial biomass C:N), microclimate (except wind speed) and vegetation properties (including wind speed) respectively, as indicated by a correlation coefficient of > = 0.60 (table S2). Approximately 50% of the variation in ecosystem respiration and photosynthesis could be explained by the PCs, with most explained by the vegetation PC (table 2). A GLM model could not be fitted for NEE.
Table 2. The pseudo-R2 of the PCA-GLM models for ecosystem respiration and photosynthesis, with the correlation coefficients (measure of effect size) of the soil, climate, vegetation PCs and their interactions.
| PC | Respiration | Photosynthesis |
|---|---|---|
| Soil | NS | NS |
| Climate | 0.17 | 0.13 |
| Vegetation | −0.51 | −0.68 |
| Soil*climate | −0.03 | −0.03 |
| Soil*vegetation | −0.09 | −0.18 |
| Climate*vegetation | NS | NS |
| R2 | 0.51 | 0.44 |
Discussion
Our results show, for the first time, the seasonal and diurnal variation in microclimate within a solar park and vegetation response to both the induced-microclimate and vegetation management. First, we discuss the mechanisms causing the microclimatic variability within the solar park. Given climate is a recognised key driver of ecosystem function and service provision, including biodiversity, productivity, GHG emissions, soil C storage and crop yields (Zavaleta et al 2003, Wu et al 2011), we also hypothesise potential impacts on plant–soil ecosystem processes. We then discuss the differences in measured vegetation metrics and greenhouse gas emissions in light of both microclimatic and vegetation management impacts.
Potential ecosystem consequences of solar park-induced microclimates
Our first hypothesis, that solar parks promote seasonal and diurnal variation in microclimate, was supported. At the solar park soil temperature was cooler under the PV arrays during the summer and between the PV arrays during the winter (figure 2, table S1), attributable to the interception of shortwave radiation by the PV arrays (Weinstock and Appelbaum 2009). The shadow cast by the PV arrays varied from 1.72 m at the summer solstice (21/06/14) to 10.69 m on the winter solstice (21/12/14) (table S3 and figure S2). The cooling is likely to be significant in terms of ecosystem function with temperature differences of this magnitude (up to 5.2 °C) observed to alter many key plant–soil processes, from productivity to decomposition (Feng et al 2008, Wu et al 2012). However, within this study we focus on soil and air temperature, but plant processes and productivity are often more strongly correlated with plant temperature; differences in crop, soil and air temperature response has been observed under PV arrays (Marrou et al 2013).
During the winter, the cooler soil temperatures in the gaps (up to 1.7 °C daily average), but similar temperatures in the control and under areas, may be attributed to: the lower solar zenith angle during the winter reducing solar radiation received by the gap plots (table S3 and figure S2) (Weinstock and Appelbaum 2009); the smaller sky view (i.e. the fraction of sky visible) under the arrays reducing net longwave radiation loss (and thus heat) from the surface (Oke 1987); and the impact of the arrays on air turbulence and thus heat transfer and soil temperature. This is an interesting finding that requires further research to establish the causes. The magnitude of these temperature differences may have limited significance for plant–soil processes given the generally lower biological activity during the winter period. However, in areas where temperatures are close to plant–soil process thresholds, the impacts could be substantial. For example, in regions where warmer winter temperatures are slowing spring phenology (Yu et al 2010), where minimum temperatures affect vegetation survival (Kreyling 2010) or specific temperatures are required for seed dormancy and germination (Walck et al 2011).
Although the daily averages for air temperature did not vary between the treatments, under the PV arrays during the summer the diurnal variation in temperature was dampened, attributable to lower radiation receipts during the day and the reduced sky view minimising longwave radiation loss at night. Further, dew formation can be inhibited under PV arrays and thus temperatures may be higher compared to control and gap areas (evaporation of dew can reduce temperature) (Marrou et al 2013). Diurnal variation in temperature has direct and indirect impacts on plant–soil processes. For example, the reduced likelihood of frost occurrence under the PV arrays (given the warmer night time temperatures) could lead to greater risk of frost injury (Kreyling 2010); and there is some evidence that respiration may acclimate to night minimum temperatures (Covey-Crump et al 2002). Moreover, the dynamics between day and night temperatures also impact plant–soil processes, for example, asymmetric diurnal warming has led to a divergent response of vegetation growth and C sequestration in Northern Hemisphere vegetation (Peng et al 2013).
AH and VPD both varied significantly with treatment at the solar park, with the treatment effect varying seasonally and diurnally. Under the PV arrays, the lower daily maximum AH potentially indicates lower evapotranspiration rates, whilst lower daily average VPD under the PV arrays during the summer may indicate that transpiration rates were lower. This is consistent with the lower photosynthesis rates and plant biomass under the PV arrays.
PAR receipts were significantly lower under the PV arrays compared with control areas and this is reflected in the lower rates of photosynthesis and plant biomass under the PV arrays. Plants can be stressed by excessive radiation and can adapt and acclimatise to low PAR conditions, with shade plants reaching maximum photosynthesis rates at lower PAR levels (Lambers et al 2008). Consequently in higher radiation environments, such as Sub-Saharan Africa, reductions in PAR may increase productivity. In addition to affecting plant productivity, reduced PAR and the balance between direct and diffuse radiation can alter the processing of C, for example increasing soil C sequestration, within the plant–soil system (Mercado et al 2009, Bahn et al 2013).
Field observations revealed that the surprising result of higher precipitation under the PV arrays is due to rainfall flowing along the PV panel supporting frame and dripping into the rain gauge. This tendency for water to track along the supporting frame is supported by the soil moisture results; there were no significant differences with treatment.
Further to the direct impact of microclimate parameters on ecosystem processes, their interactions and indirect effects may also cause significant alterations to plant–soil processes. Some interactions, such as those between temperature and moisture have received much attention (Ise and Moorcroft 2006, Suseela et al 2012). However, others, such as the interaction between temperature and PAR are less well resolved but have been shown to be significant (Edwards et al 2004, Hartley et al 2007). The composite effect of reduced temperatures, increased humidity and shading, all factors observed under the PV arrays, have been shown to moderate plant response to macroclimatic warming as forest canopies close (De Frenne et al 2013). Consequently, resolution of the interactive and indirect effects of altered microclimatic conditions on plant–soil processes in solar parks requires further investigation.
Solar park effects on vegetation and greenhouse gas fluxes
Our second hypothesis that, differences in microclimate and vegetation management explain variance in plant diversity, above-ground biomass, and ecosystem CO2 fluxes was supported, with the areas under the PV arrays less diverse, dominated by grasses, and less productive compared with the control and gap areas. The re-seeding of the gap and control areas with a species-rich meadow mix after construction will have strongly influenced vegetation diversity, especially given the limited potential for seed dispersal as the field measurements were taken two years after seeding. However, the observed differences in microclimate between the treatments are of a magnitude known to affect vegetation composition and productivity (Zavaleta et al 2003, Wu et al 2011). Given the temperatures were similar during early spring, the lower diversity and domination of grasses under the PV arrays may have been influenced by grasses out-competing the forbs and legumes under the reduced PAR conditions. Further, the only non-grass species found under the PV arrays was Achillea millefolium, which is more shade tolerant than other forbs found at this site (Grime et al 2007). The lower biomass under the PV arrays also reflects reductions in the microclimatic drivers known to be positively associated with productivity: lower temperatures, VPD and radiation (Larcher 2003, Rogiers et al 2005).
GHG emissions are controlled by climate, vegetation and soil properties and the relative importance of these factors controls the response of plant–soil C cycling to environmental change (De Deyn et al 2008, Heimann and Reichstein 2008). Consequently, the observed differences in GHG fluxes between treatments may have been influenced by both the differences in vegetation due to the re-seeding of the gap and control areas and the varying microclimate between the treatments. The lack of consistent differences in CO2 fluxes between treatments throughout the year, despite temperature differences of a scale known to impact CO2 fluxes, indicates the ability of vegetation characteristics, both species composition and biomass, to compensate for climatic variability. When differences did occur, it was commonly the under areas that had lower flux rates, reflecting the lower biomass and lower temperatures. The PCA-GLM results indicated that vegetation metrics and wind speed (which governs CO2 exchange between the leaf and atmosphere Oke 1987) were more strongly correlated with CO2 fluxes than climate or soil factors. This indicates the pivotal role of vegetation, and thus the importance of vegetation management in the shorter term and vegetation change in response to the microclimate induced by the PV arrays in the longer term, in influencing C cycling at solar parks (Cornwell et al 2008, De Deyn et al 2008).
Our data highlights the potential significance of the impact of solar park-induced microclimates on ecosystem processes and quantifies the impact on some measures of ecosystem response (biomass, diversity and ecosystem CO2 fluxes). The microclimatic impacts need to be assessed for different climatic zones and solar park architectures to enable potential co-benefits, such as enhanced biodiversity or crop production, to be identified and any detrimental effects to be mitigated. Future research should establish the effects of the microclimatic impacts, focusing not only on the direct effects but also indirect and interactive effects, on ecosystem processes and plant physiological responses (Schlenker and Roberts 2009, Wan et al 2009, Wang et al 2014). Given thresholds in plant–soil processes, different microclimate metrics should be analysed, including averages, minimum and maximum temperatures (Jolly et al 2005, Craine et al 2012), along with seasonal variation, encapsulated by measures of growing season length, and diurnal variation (Piao et al 2007, Wan et al 2009).
Conclusion
Land use change for energy generation is accelerating, with the growth of solar parks predicted to continue globally. The effects of this growing land use change on plant–soil processes, which underpin key ecosystem services, is poorly understood. In this study we show that PV arrays can cause both seasonal and diurnal variation in the ground-level microclimate to a magnitude known to affect terrestrial C cycling. We also observed significant differences in above-ground biomass, plant diversity and ecosystem CO2 fluxes which were associated with the vegetation management and microclimate. Given the quantifiable differences in plant–soil C cycling presented here, we argue that there is a critical need for a systematic assessment of the impact of solar parks on ecosystem functioning and the potential to exploit the induced-microclimate effects for co-benefits. For example, the production of crops under PV arrays in locations where solar radiation receipts currently prevent it. Solar parks contribute to climate change mitigation by providing low carbon energy, but the wider environmental costs and benefits need to be taken into account, to ensure they are deployed sustainably.
Acknowledgments
Thanks to Adam Twine and Westmill Solar Co-operative for access to Westmill Solar Park and Emma Eastoe for help with the statistical analysis. AA acknowledges financial support from an Energy Lancaster Fellowship and a Lancaster University Early Career Small Grant. We thank the two anonymous reviewers for their comments.