

Abstract
Obtaining sufficient drinking water with acceptable quality under circumstances of lack, such as droughts, is a challenge in drought-prone areas of India. This study examined rural drinking water availability issues during a recent drought (2012) through 22 focus group discussions (FGDs) in a drought-prone catchment of India. Also, a small chemical water quality study was undertaken to evaluate the suitability of water for drinking purpose based on Bureau of Indian Standards (BIS). The drought that began in 2011 and further deteriorated water supplies in 2012 caused a rapid decline in reservoir storages and groundwater levels that led, in turn, to the failure of the public water supply systems in the Upper Bhima Catchment. Dried up and low-yield dug wells and borewells, tanker water deliveries from remote sources, untimely water deliveries, and degraded water quality were the major problems identified in the FGDs. In addition to severe drinking water scarcity during drought, the quality of the drinking water was found to be a major problem, and it apparently was neglected by local governments and users. Severe contamination of the drinking water with nitrate-nitrogen, ammonium-nitrogen, and chlorides was found in the analyzed drinking water samples. Hence, in addition to the water scarcity, the results of this study point to an immediate need to investigate the problem of contaminated drinking water sources while designing relief measures for drought-prone areas of India.
Export citation and abstract BibTeX RIS

Original content from this work may be used under the terms of the Creative Commons Attribution 3.0 licence. Any further distribution of this work must maintain attribution to the author(s) and the title of the work, journal citation and DOI.
1. Introduction
Water scarcity, which is broadly understood as the lack of access to adequate quantities of water for human and environmental uses, is considered to be one of the most important global risks for society [1, 2]. Global water demands are expected to increase in the future because of increasing populations, urbanization, and industrialization. In addition, aspects of climate change and anticipated increases in extreme weather events are expected to contribute to increases in the frequency, severity, and duration of droughts [3, 4], which can exacerbate water availability problems.
Developing countries are more vulnerable to drought than developed countries [5] and India is among the most vulnerable drought-prone countries in the world. About two-thirds of its area is drought-prone and per capita water availability is progressively decreasing as its population increases. The average annual per capita water availability was 1816 m3 in 2001, which decreased to 1545 m3 in 2011 [6]. The country is facing water stress and the demand for water is continuously increasing.
India's drinking water crisis has become severe over the past decade. Increasing demands on available water resources for intensive agricultural practices and industrial use, together with deteriorating water quality, constrain drinking water availability despite massive outlays for drinking water and sanitation infrastructure [7]. Although most of the water supply and sanitation schemes by India's government have penetrated into rural areas and covered many households (about 74% of rural householders are fully covered), many households (about 26%) had no drinking water facilities until 2009 [8]. Moreover, there are growing concerns about the sustainable use of groundwater and surface water with respect to emerging issues of inequity of water distribution and access. Although the government assures that drinking water is available in most rural areas, the quality of that water supply is a problem. Currently, a large proportion of India's rural communities is consuming water that does not meet the WHO drinking water quality standards [9].
Drought conditions may further worsen the drinking water availability situation in areas where water stress already exists and in areas prone to drought. Although droughts are being combatted with reactive measures and attention is being given to the quantity of water available to communities, the quality of the water is being neglected by local administrations. Lack of infrastructure and facilities to monitor and maintain adequate water quality is evident in most cases. Furthermore, in most of the villages, users are unaware of the quality of the water being supplied to them for drinking. Under drought conditions, the quality of water tends to be overlooked, and priority is given to quantity. Hence, it is essential to examine the quality of the drinking water used by those rural communities in drought-prone areas that lack a proper water supply infrastructure.
To design appropriate drought preparedness and mitigation strategies and to overcome the problems in the rural drinking water supply, it is crucial to understand the rural drinking water problems through data collected in field investigations. Accounting for public input is essential while dealing with issues of appropriateness, urgency, equity, and cultural awareness in drought planning [10]. However, limited studies have investigated rural drinking water problems with public participation in India's rural drought-prone areas (DPAs) [11–13]. In this context, this study examined the state of drought and water resources, rural public water delivery characteristics, and drinking water availability and quality problems during the 2012 drought. This study focused on a drought-prone catchment of India, The Upper Bhima Catchment, through public participation. The study posed the following three questions:
- 1.What was the state of water resources during the drought 2012 compared with normal year reservoir storages and groundwater levels?
- 2.What was the status of the public drinking water delivery system and what are the major issues as noted by the public during a year with normal rainfall compared to a year of drought?
- 3.Is there evidence of chemical water quality problems of the drinking water in drought-affected areas (referring to the BIS acceptable limits)?
In case of the third question, it should be noted that a small pot water sampling study was undertaken. However, there was no way to know if this was worse during the drought. The results of this study are expected to help policy makers and stakeholders gain familiarity with existing drinking water problems in drought-prone areas, and to help in designing appropriate strategies to overcome drinking water problems in rural DPAs.
2. Research design
2.1. Study area
A representative drought-prone catchment, the Upper Bhima Catchment in Southern Maharashtra State (figure 1), was used as the study site. The catchment area is about 46 000 km2. Pune, Solapur, and Ahmednagar districts cover about 75% of the catchment area and Satara, Sangali, Osmanabad, and Beed districts cover the rest [14]. The average annual rainfall in the catchment is 683 mm and recurring drought is one of the challenges faced by its rural communities. The distribution of rainfall is highly uneven across time and space. Rainfall in the catchment varies from 2000–6000 mm at the Western Ghats to 500–800 mm in the middle and lower catchment [15]. A detailed description of the study area is provided by Udmale et al [16, 17]. A study by Garg et al [18] estimates that 12.8% and 21% of normal year rainfall is captured by the reservoirs and groundwater reserves, respectively, 7% exported as runoff out of the basin and the rest (59.2%) used in evapotranspiration.
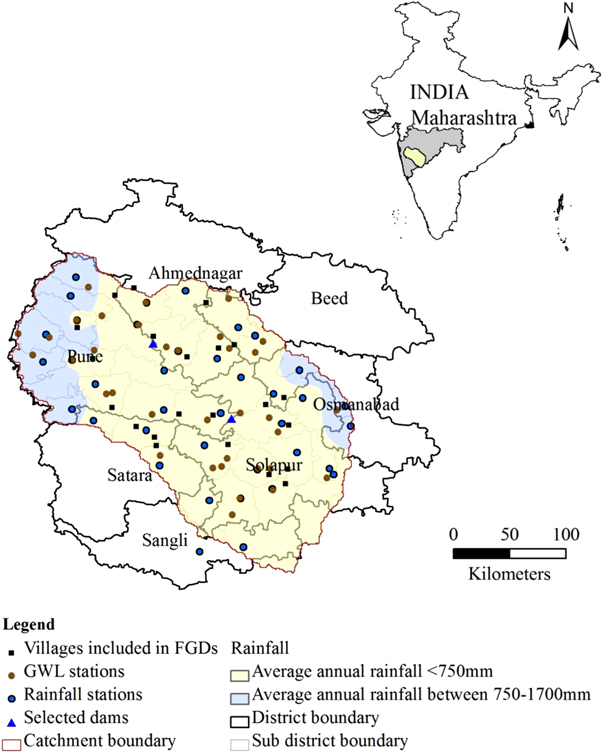
Figure 1. Location of the Upper Bhima Catchment and the selected villages in the study.
Download figure:
Standard image High-resolution imageThe catchment is situated in the Deccan Plateau, a large igneous province composed of Deccan Trap basalts. The population in the catchment heavily depends on basaltic aquifer water which helps to sustain the lives of about 16.7 million people (2011). The rural and urban populations were 8.8 and 7.9 million, respectively in the year 2011. They are predicted to increase to 11.3 and 12.5 million, respectively, with a total population of the catchment of 23.8 million by 2030 [14]. The groundwater resources of the basin are extensively utilized, with about 70% of the average annual recharge withdrawn for consumptive uses [19]. Before the year 1972, the use of groundwater in the State was relatively insignificant. However, due to the frequent occurrence of droughts, limitations of the availability of surface water, development of low-cost drilling devices, easy availability of institutional finance, and energization, etc has led to a proliferation of irrigation wells (dug wells and tube wells) in drought-prone areas [20].
2.2. Materials and methods
For this study, 22 villages were surveyed in 2013 (by a stratified systematic survey sampling technique) across the Upper Bhima Catchment (figure 1). The catchment area was divided into three strata-areas with less than 15% (low irrigated), between 15%–30% (medium irrigated) and more than 30% (highly irrigated) irrigation of the total cultivated area, considering average irrigation percentages over each sub-district. In the second stage, villages were selected by a probability proportional to size (PPS) sampling technique [16]. Focus group discussions (FGDs) were used for group interviewing (one group per village comprising 8 to 12 individuals). In most of the cases, a key informant or sarpanch (village leader or a local government member) was included in the FGDs to encourage efficient conversations. Other participants of FGDs were selected randomly. The FGDs were where data were collected on the village demographics, water supply characteristics, and the most important water problems during a year with normal rainfall (normal year) and in a year of drought. The summaries of the conversations in the FGDs were noted in 22 questionnaires. In addition to this, 18 drinking water samples were randomly collected, one from each village (one household per village, particularly from one of the households participated in the FGDs). The researcher requested that the selected household provided water for drinking, then collected a sample from the same water and noted its source. The samples were analyzed in a laboratory using ion chromatography [21] to determine the major concentrations of anions and cations and compared to the BIS standards and WHO drinking water quality guidelines. The primary and secondary data used in the study and their sources are shown in table 1.
Table 1. The primary and secondary data types and sources.
| Serial number | Data | Locations | Timescale | Source |
|---|---|---|---|---|
| 1 | Focus group discussions | 22 | May 2013 | Researcher |
| 2 | Drinking water samples | 18 | May 2013 | Researcher |
| 3 | Monthly and average annual rainfall | 37 sub-districts | 1998–15 | Dept. of Agriculture, Govt. of Maharashtra [22] |
| 4 | Monthly dam storage | Two irrigation projects | 2002–15 | Water Resources Dept. Govt. of Maharashtra [23] |
| 5 | Groundwater levels (pre- and post- monsoon) | 35 sub-districts | 2005–13 | Central Groundwater Board, Govt. of India [24] |
| 6 | Contaminated water sources | Seven districts | 2012–13 | Ministry of Drinking Water and Sanitation, Govt. of India [25] |
FGDs were conducted by the researcher in the local language of Marathi. The groups were clearly informed of the objectives of the questionnaire survey. We obtained their permission before the questionnaires were completed and used the information only when the participating group agreed. The names of the communities or villages in the survey were not shared to keep them confidential.
3. Results and discussion
3.1. Status of water resources during a drought
Between 1998 and 2015, the catchment experienced three major droughts (figures 2 and 3). There were droughts in 2002–2003, 2011–2012, and a recent drought 2014–15, all were moderately intense based on a rainfall deficiency between 25% and 50% of the long-term average for the overall area (the drought intensity varied at the local [sub-district] level) [16]. Most of the sub-districts experienced consecutive droughts in 2011 and 2012. The drought which began in 2011 lasted for five consecutive years until 2015 (except for a few sub-districts from the upper reaches of the catchment). The most direct effects of the droughts were decreased water levels of the surface water bodies. Figure 4 shows the percentage of live storage of projected storage capacity for representative major irrigation projects (Ghod and Bhima Ujjani) in the Upper Bhima Catchment. The water storage capacities in these major projects were the lowest (0% of live storage capacity) in May of 2012 and failed to recover due to the weak 2012 monsoon season. The water scarcity situation worsened during the 2012 post-monsoon (October and November), winter of 2012–2013 (December through to March), and the summer or pre-monsoon (April through to June) of 2013. The normal monsoon season (June through to September) of 2013 in the upper reaches of the catchment resulted in 100% live storage capacity of the Ghod and Bhima Ujjani dams in August and October of 2013, respectively. However, a recent monsoon in 2015 failed to recover to full storage in these reservoirs. As of 22 April 2016, the live storages in these reservoirs were 0%, resulting in the water scarcity situation similar to the drought of 2011–12. The total reservoir live storage of Maharashtra State as a whole was 17% as of April 2016. The same was 34% and 29% in April 2014 and 2015, respectively. This is evidence of present water scarcity mainly due to deficient rainfall in 2015. The situation will be worse if the monsoon of 2016 falls short of the long-term annual average.

Figure 2. Sub-district annual rainfall deviations from normal (50 years average) rainfall. In general, it can be seen that the most of the sub-district located in the catchment are experiencing consecutive drought in last five years (2011–2015).
Download figure:
Standard image High-resolution image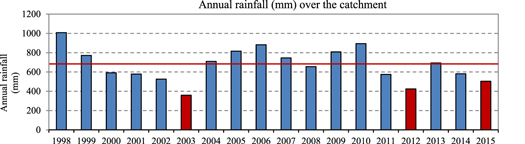
Figure 3. Annual rainfall averaged over the Upper Bhima Catchment for the period 1998–2015. Fifty years catchment average annual rainfall was 683 mm (shown by the horizontal dark red line). The dark red-filled bars show the annual rainfall deficiency between 25%–50% of the long-term average (classified as moderate drought years).
Download figure:
Standard image High-resolution image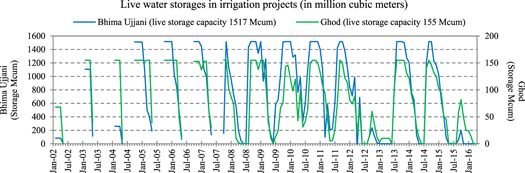
Figure 4. Live water storages in the representatives of major irrigation projects located in the Upper Bhima Catchment (2002–2015). The storage capacities are presented in millions of cubic meters (Mcum), shown in parentheses. About 4 Mcum and 110 Mcum water from these projects is reserved for domestic water supply. The live storages in both the reservoirs declined from their full storage status in October 2011 to zero storage in June 2013. As of April 2016 both the reservoirs reached 0% live storages.
Download figure:
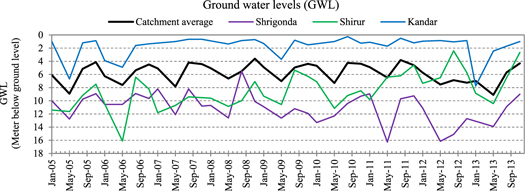
Standard image High-resolution imageTo combat the drought (2012) situation, groundwater was used in the catchment as a buffer. The heavy groundwater abstraction followed by low rainfall in subsequent years resulted in groundwater depletion. The average groundwater level (GWL) during the post-monsoon season (November) of 2010 was 4.37 m below ground level (bgl). By post-monsoon season of 2011, it had dropped to 4.59 m bgl, as shown in figure 5. This was a 0.22 m decrease from the previous year's post-monsoon GWL, caused by a 16% rainfall deficiency plus heavy abstraction. The situation worsened after a very weak monsoon season in 2012, in which there was a 38% rainfall deficiency compared to normal rainfall reported over the entire catchment. The average GWL for the post-monsoon season of 2012 was about 7.25 m bgl, which was a decrease of 2.88 m compared to the 2010 post-monsoon season. The average GWL was at its lowest (9.10 m bgl) in the 2013 pre-monsoon season (May) due to drought-driven heavy groundwater pumping during 2011 and 2012. On average, there was about a 4.73 m decrease in GWL reported for the period between November of 2010 and May of 2013. The rate of GWL decline was 16 cm/month (or 1.9 m/year) for the same period. This is evidence that the meteorological drought (rainfall) led to severe surface water and groundwater scarcity (hydrological drought) in the catchment, which subsequently affected the agricultural and domestic water supplies. The situation is representative of the drought-prone area of the state. It provides brief insights into the water scarcity situation in the state. The drought often results in chronic drinking water scarcity and various associated issues in these areas. The next subsection provides insights into the status of the public drinking water delivery system and the major issues as noted by the public during a year with normal rainfall compared to a year of drought (2012).
Figure 5. Groundwater levels in the Upper Bhima Catchment (2005–2013). The catchment average is obtained from 35 observation wells as shown in figure 1. It can be seen that the average catchment GWL declined by 4.73 m from November 2010 to May 2013 due to deficient rainfall in the monsoons of 2011 and 2012. The GWL data at other three observation wells (Shrigonda, Shirur, and Kandar) are shown as examples.
Download figure:
Standard image High-resolution image
3.2. Impacts of drought on the rural domestic water supply
According to the Census of India [26], about 45.63% of the households in the rural areas of the catchment were provided with tap water (from surface or groundwater resources) during normal years. About 26.61%, 14.78%, and 10.01% of these households were obtaining drinking water from dug wells, hand pumps, and/or borewells (groundwater), respectively. According to 2011 Census of India [26], more than 51% of rural households in the catchment depend on groundwater as a major source. Small percentages of the rural households were obtaining their water from rivers, canals, ponds, and so on. On average, about 45.38%, 36.58%, and 18.04% of the rural households were obtaining water from sources within their homes, near their homes, or far from their homes, respectively. Among the rural households, about 55% were relying on sources near or far away from the home, making them relatively more vulnerable to drought-driven water scarcity.
Table 2 compares village (sub-district) water supplies during normal years to drought years and some of the major problems that were reported in the FGDs. During normal years, none of the villages in the study experienced drinking water scarcity. However, the drought of 2011–2012 caused a rapid decrease in reservoir storage and groundwater levels resulting in failure of the public water supply systems. About 15 of the 22 villages reported drinking water scarcity due to this drought in the second consecutive year. The major source of domestic water during normal years was groundwater for 20 of the 22 villages; the other two villages used surface water resources. Furthermore, during the drought of 2011–2012, most of the dug wells and borewells either dried up or yielded much less water, which constrained access to groundwater and the number of villages relying on groundwater decreased from 20 during normal years to 11 during the drought. The rest of the villages were forced to use surface water from the dead storages of nearby reservoirs. Water was made available to affected areas by means of water delivery tanker trucks. Calcium hypochlorite (chlorine powder or bleach powder) was used to treat the drinking water at public water supply areas in 14 of the 22 villages, and just one village was provided with drinking water that was treated at a water treatment plant. Dried up or low-yield dug wells and borewells, tanker truck delivery from remote areas, untimely water delivery, and degraded water quality were the major problems reported in the FGDs.
Table 2. Public drinking water supply sources during normal and drought years and problems in the villages as reported in the FGDs (May of 2013).
| Normal year | Drought year | ||||
|---|---|---|---|---|---|
| Village number | Sub-district (District) | Public Source | Does water scarcity exist? | Public Source | Special remarks (reported drinking water problems in FGDs) |
| 1 | Shrigonda (Ahmednagar) | GW | Yes | SW | During drought, water from ponds is added to the public water well and distributed every five days by elevated tanks after treatment. |
| 2 | Shrigonda (Ahmednagar) | GW | Yes | GW | Most of the dug wells and borewells are dried up. Few borewells are yielding water for more than a few minutes per hour. |
| 3 | Parner (Ahmednagar) | GW | No | GW | The water is of poor quality. Many cases of kidney stone disease are reported in the village. |
| 4 | Junnar (Pune) | GW | Yes | GW | Dug well water is of degraded quality and salty to the taste. |
| 5 | Khed (Pune) | GW | No | GW | The Bhima River near the village is polluted from the direct disposal of untreated sewage water, which restricts the river water use for domestic purposes. |
| 6 | Haveli (Pune) | GW | Yes | SW | Tanker water supplies during droughts come from a river about 2 km from the village. |
| 7 | Saswad (Pune) | GW | No | GW | The water is salty to the taste. |
| 8 | Phaltan (Satara) | SW | No | SW | The water from dug wells and borewells is of poor quality and water from the irrigation canal (Neera right canal) is used for domestic purposes. |
| 9 | Phaltan (Satara) | SW | Yes | SW | In normal years, drinking water for 14 villages in the locality is treated and distributed by elevated tanks. In drought years, water is obtained by means of tankers and adequate water quality is not guaranteed. |
| 10 | Man (Satara) | GW | Yes | SW | The water from dug wells is of good quality. |
| 11 | Indapur (Pune) | GW | No | GW | The water is salty to the taste. |
| 12 | Indapur (Pune) | GW | Yes | SW | The groundwater is of good quality. During drought years, tanker water is from Ujjani Dam. |
| 13 | Malshiras (Solapur) | GW | Yes | SW | About one of five hand pumps in the village yields water. Tanker water is from the Bhima River. |
| 14 | Pandharpur (Solapur) | GW | Yes | SW | Canals, dug wells, and borewells are dried up from the drought. |
| 15 | Mangalvedha (Solapur) | GW | No | GW | Enough water is available for drinking during drought years due to regulated GW use limited to drinking. The local government forbids GW pumping for irrigation during drought years. |
| 16 | Mohol (Solapur) | GW | Yes | GW | The irrigation canal passes through the village, but low water storage in the reservoir keeps it dry. |
| 17 | Barshi (Solapur) | GW | Yes | GW | The groundwater is of good quality. However, only single bore wells yield water, and the rest of the wells in the village are running dry from the drought. |
| 18 | Parenda (Osmanabad) | GW | No | GW | Enough water is available for drinking during normal as well as drought years, but water deliveries do not follow a fixed schedule. |
| 19 | Madha (Solapur) | GW | Yes | SW | The water is salty to the taste. Bore wells are up to 600 feet in the village. |
| 20 | Ahmednagar | GW | Yes | SW | The tanker water during droughts is from Mula Dam, located about 23 km from the village. |
| (Ahmednagar) | |||||
| 21 | Karjat (Ahmednagar) | GW | Yes | SW | Tanker water during droughts is from Nimgaon Reservoir located about 30 km from the village. |
| 22 | Ashti (Beed) | GW | Yes | GW | The water is salty to the taste and does not quench thirst. |
Note: SW = surface water; GW = groundwater.
In response to the 2011–2012 drought, water was made available to severely affected areas by means of government and community water delivery tankers. As of May of 2013, about 13 794 villages and hamlets were provided with 5060 water delivery tankers in the drought-affected areas of Maharashtra. The total expenses incurred for the water supply mitigation measures (water tankers, repairs made to the existing water facilities, and construction of borewells in 2012–2013 was INR6.2 billion (US$114.2 million; US$1 = INR54.34 as of March 30, 2013) [27, 28]. More tankers were deployed in the severely than the mildly affected districts, such as Solapur, Beed, and Ahmednagar. Table 3 shows the characteristics of the village water delivery tankers assigned to the villages that participated in the FGDs. As of May 2013, about 12 of the 22 villages had tanker water deliveries to fulfill their domestic water needs. Few villages reported tanker water deliveries after the 2011 post-monsoon season, and few villages reported starting tanker water deliveries one month later (April of 2013). The tanker water supply was SW for ten villages and GW for two villages. The water was made available to the villages by means of tankers transporting the water from nearby reservoirs or rivers that had water in their dead storages. The tankers' distances to their sources ranged from two to 30 km from the designated villages. Tankers' carrying capacities ranged from 3000 to 12 000 liters per trip. The number of trips per day ranged from one to five. When the number of tankers, their capacities, the number of trips per day, and the villages' populations are accounted for, the volume of domestic water per person per day was estimated in the range of 5 liters (in village 13) to 27 liters (in village 10). UNICEF [29] recommends at least 20 liters per capita per day of safe water supply, whereas the Government of India recommends 40 liters per capita per day [30]. However, insufficient water supplies during droughts force the villages to obtain their water from remotely located, low-yield dug wells and borewells used for agricultural purposes in normal years. This is a time-consuming, cumbersome activity. Low availability, untimely and irregular deliveries, degraded quality, inequity in distribution, and so on were the major problems reported in the FGDs. Public satisfaction with tanker water delivery during droughts was reported as very low in a study by Udmale et al [16].
Table 3. Tanker water delivery characteristics of the villages that participated in the FGDs (May of 2013).
| Tanker water supply characteristics during drought | |||||||
|---|---|---|---|---|---|---|---|
| Village Number | Population | Number of tankers | Trips/tanker/day | Capacity (in thousands of liters) | Water supply since (months) | Distance to source of water (km) | Source |
| 1 | 2892 | 2 | 3 | 12 | 1 | 16–20 | SW |
| 6 | 1709 | 1 | 5 | 3 | 1 | 2 | SW |
| 9 | 4288 | 1 | 4 | 10 | 12 | 10 | SW |
| 10 | 1126 | 1 | 3 | 10 | 12 | 20 | SW |
| 12 | 2557 | 1 | 2 | 12 | 12 | 10 | SW |
| 13 | 20 833 | 4 | 2 | 12 | 2 | 4 | SW |
| 14 | 3514 | 1 | 3 | 12 | 2 | 10 | SW |
| 16 | 3208 | 2 | 3 | 12 | 1 | 16–17 | GW |
| 17 | 1734 | Demand for tanker water supply was under progress. | |||||
| 19 | 2587 | 1 | 3 | 9 | 1 | 7 | SW |
| 20 | 6147 | 4 | 1 | 12 | 12 | 23 | SW |
| 21 | 2060 | 1 | 4 | 12 | 4 | 10–30 | SW |
| 22 | 2847 | 2 | 3 | 12 | 9 | 2 | GW |
Note: SW = surface water; GW = groundwater
3.3. Drinking water quality concerns in drought-prone areas
In addition to the domestic water supply quantity found to be a critical issue in rural areas, the quality of the water supply also remains a challenge. According to National Sample Survey by Government of India [31], about 32.3% and 87.7% of the rural households in the country in the year 2012 were treating drinking water prior to use and getting good quality drinking water, respectively. However, in rural areas of Maharashtra, about 76.6% and 94.1% of the rural households for the same year were treating drinking water prior to use and getting good quality drinking water, respectively. As pointed out above, groundwater is the major source of drinking water in the catchment. Table 4 shows the number of tested drinking water sources and their suitability for drinking purpose for the districts considered in this study. It can be seen that the nitrate contamination was prominent in Beed, Pune, and Sangali districts (14.4, 17.5, and 13.3% tested sources exceeding BIS permissible limits, respectively). At the state level about 12.2% of tested sources reported nitrate contamination beyond BIS permissible limit. The sources exceeding permissible limits of chemical contaminants (Iron, Fluoride, Salinity, Nitrate, and Others) are given in table 4. The next major contaminant reported after nitrate were bacteriological contaminants E. coli, and coliform (which shall not be detectable in drinking water as per BIS). All the sources exceeding BIS permissible limits of chemical and bacteriological contaminations are declared unsuitable for drinking purpose and banned in the locality.
Table 4. Number of tested water supply sources and reported chemical and bacteriological contamination for the drought-prone districts considered in this study and Maharashtra State as a whole (2012–13).
| No. of sources with single chemical contaminants | No. of sources with bacteriological contaminants | No. of sources with multiple contaminants | |||||||||
|---|---|---|---|---|---|---|---|---|---|---|---|
| District [1] | Total sources tested [2] | Iron [3] | Fluoride [4] | Salinity [5] | Nitrate [6] | Arsenic [7] | Other [8] | E-coli (MPN/100 ml) [9] | Coliform [10] | [11] [3 + 4 + 5 + 6 + 7] | [12] [11] + other contaminants |
| Ahmednagar | 3474 | 227 (6.5) | 27 (0.8) | 61 (1.8) | 100 (2.9) | 0 (0) | 166 (4.8) | 172 (5) | 181 (5.2) | 54 (1.6) | 22 (0.6) |
| Beed | 3311 | 110 (3.3) | 83 (2.5) | 4 (0.1) | 478 (14.4) | 0 (0) | 112 (3.4) | 279 (8.4) | 503 (15.2) | 187 (5.6) | 0 (0) |
| Osmanabad | 4479 | 224 (5) | 8 (0.2) | 0 (0) | 0 (0) | 0 (0) | 187 (4.2) | 413 (9.2) | 415 (9.3) | 200 (4.5) | 1 (0) |
| Pune | 15 102 | 488 (3.2) | 39 (0.3) | 95 (0.6) | 2645 (17.5) | 0 (0) | 396 (2.6) | 603 (4) | 397 (2.6) | 171 (1.1) | 0 (0) |
| Sangali | 8763 | 188 (2.1) | 54 (0.6) | 29 (0.3) | 1162 (13.3) | 0 (0) | 227 (2.6) | 457 (5.2) | 503 (5.7) | 123 (1.4) | 3 (0) |
| Satara | 5808 | 29 (0.5) | 0 (0) | 16 (0.3) | 139 (2.4) | 0 (0) | 135 (2.3) | 0 (0) | 106 (1.8) | 9 (0.2) | 1 (0) |
| Solapur | 5592 | 16 (0.3) | 10 (0.2) | 59 (1.1) | 58 (1) | 0 (0) | 121 (2.2) | 91 (1.6) | 205 (3.7) | 5 (0.1) | 1 (0) |
| Maharashtra | 165 957 | 7390 (4.5) | 2256 (1.4) | 589 (0.4) | 20 169 (12.2) | 0 (0) | 5932 (3.6) | 8613 (5.2) | 10 389 (6.3) | 4520 (2.7) | 111 (0.1) |
Note: Integrated Management Information System (IMIS), Department of Drinking Water Supply [25] monitors habitat wise water quality annually for biological and chemical contamination to decide the suitability of source for drinking using BIS permissible limits. The BIS permissible limit for iron = 0.3 mg l−1, fluoride = 1.5 mg l−1, nitrate = 45 mg l−1, arsenic = 0.05 mg l−1, and E. coli and coliform = shall not be detectable in any 100 ml sample. Numbers in parentheses ( ) are in percent.
The problems in the rural drinking water supply worsen in drought-hit areas where the emphasis is placed on the quantity of water available to the households and water quality is often neglected. The study attempts to find an evidence of chemical water quality problems of the drinking water (pot water being used for drinking) in drought-affected areas (referring the BIS acceptable limits). For this purpose a small water sampling study was carried out; however it was difficult to know if this was worse during the drought year. The results of ion chromatographic analysis of the household drinking water samples (collected from the pot water of the one of the respondents households involved in FGDs) are given in table 5. The fluoride concentration limit for drinking water was exceeded BIS in just one sample (3.8 mg/liter), whereas it was within the permissible limits for the rest of the samples that were analyzed. According to WHO guidelines, excess consumption of fluoride in drinking water increases the likelihood of bone fractures in adults and may lead to bone pain and tenderness. In the case of children younger than eight years old, excessive fluoride consumption may cause tooth enamel decay and a variety of negative cosmetic effects on the teeth [32, 33]. From table 4 and ion chromatographic analysis found that the population in the catchment was exposed to fluoride in the drinking water.
Table 5. Results of ion chromatography for pot water samples collected from participants of FGDs.
|
Note: The '-' means not detected; F− = fluoride; Cl− = chloride; NO2-N = nitrite-nitrogen; Br− = bromine; NO3-N = nitrate-nitrogen; PO4-P = phosphate-phosphorus; SO42− = sulfate, Li+ = lithium; Na+ = sodium; NH4-N = ammonium nitrogen; K+ = potassium; Mg2+ = magnesium; Ca2+ = calcium; gray filled cells represents values exceeding BIS acceptable limits; * exceeding BIS permissible limit in the absence of alternate source; values in bold exceeded the WHO upper limits.
The BIS permissible limit for nitrate-nitrogen is 10 mg l−1 (10 mg l−1 Nitrate-nitrogen [NO3-N] equivalent to 44.3 mg l−1 nitrate [NO3−]). Concentrations of nitrate-nitrogen in drinking water beyond that point can be hazardous to the health of infants and pregnant women. The concentration of nitrate-nitrogen was 1.16 to 4.08 times the BIS permissible limit in seven of 18 drinking water samples. Similarly, ammonium nitrogen exceeded BIS permissible limit in case of three samples. These results in combination with results from table 4 indicate heavy exposure of the population to nitrate contamination through drinking water. Furthermore, the concentrations of chlorides and sodium may influence the taste of drinking water at levels higher than 250 mg/liter (BIS acceptable limit) and 200 mg/liter (WHO guidelines) [33], respectively. Their concentrations exceeded the BIS acceptable and WHO guidelines in case of only two samples and do not pose serious threats to human health, unlike the fluoride and nitrate nitrogen contaminations. Considering multiple chemical contaminants, about twelve, ten, and eight of 18 samples found unsuitable for drinking as per BIS acceptable limit, BIS permissible limit in the absence of an alternate source, and WHO guidelines, respectively.
All of the contaminated samples' primary sources were groundwater. This is evidence that highlights the serious groundwater contaminations in those villages that exceeded the BIS (acceptable and permissible limits) and WHO guidelines of fluoride, chlorides, nitrate, magnesium, and calcium concentrations. This situation was observed in spite of the sources declared unsuitable for drinking in the localities by the IMIS database. Surprisingly these are the results obtained for pot water which was being used for drinking. The reason behind this might be that the people were unaware of the source contamination or water scarcity during drought years, which forced them to use water irrespective of its quality. Also, annual monitoring by IMIS may have missed the seasonal variations in the source contamination. To overcome these issues study recommends monthly monitoring of public and private drinking water sources with water quality strip tests (for on field investigation with less expertise, less time, and low costs) to identify chemical and bacteriological contaminants. Also, in-depth studies should be conducted to identify the sources of contamination. Furthermore, suggestions for suitable water treatment methods for water sources with location-specific contaminants are needed.
4. Summary and concluding remarks
Obtaining sufficient amounts of drinking water with acceptable quality under circumstances of lack, such as drought, remains a challenge in drought-prone areas of India. The drought that began in 2011 and further deteriorated water supplies in 2012 caused a rapid decline in reservoir storages and groundwater levels that led, in turn, to the failure of the public water supply systems in the Upper Bhima Catchment. Dried up and low-yield dug wells and borewells, tanker water deliveries from remote sources, untimely water deliveries, and degraded water quality were the major problems identified in the FGDs. Drinking water was supplied to the drought-affected areas with governmental and private water delivery tankers; however, the quantity of water supplied per capita was far below the requirement (40 liters per capita per day). In addition to drinking water availability, water quality is of major concern during droughts, and it apparently was neglected by local governments and users. Severe contamination of the drinking water with nitrate-nitrogen, ammonium-nitrogen, and chlorides were found in the analyzed drinking water samples.
To overcome the drinking water crisis in India's drought-prone areas, we recommend the community-based management of rural water supply system throughout the year. The local administration (Gram Panchayat's) with community participation should watch for a drought-like situations by monitoring rainfall, small reservoir storages, and groundwater levels in the villages. They should also be able to estimate the domestic water demand and available sources, and assess their reliability (regarding quantity and quality). In normal rainfall years, they should be responsible for the operation and maintenance of water supply systems and also for water conservation, sources development, and related policies and governance. If a drought-like situation is apparent, then they should be responsible for planning mitigation activities in the form of assessment of present water source reliability to provide water to the communities. If the current water sources are not reliable (or could not sustain the drinking water demand) against the apparent drought like situation, then they should look for other potential public or private water sources to meet the demand. If this fails, then they should ask for sub-district administration to provide assistance for short-term relief measures like construction of bore wells, etc to mitigate the drought. If nothing solves the problem, then water should be brought from remote sources by water tanker trucks. And finally, the local administration and community should ensure the equitable distribution of water with drinkable quality to all. Not only the provision of sufficient water quantity but also monitoring its quality irrespective of normal or a drought year and its proper treatment before distribution should be undertaken. For this purpose, the study recommends monthly monitoring of drinking water sources with water quality strip tests (for on field investigation with less expertise, less time, and low costs) apart from IMIS laboratory tests to identify chemical and bacteriological contaminants and use of community- or household-level small water treatment facilities.
The present study has some limitations. First, the scope of the study is limited to coverage of a single drought event from 2011 to 2012; second, it does not identify the source or sources of the drinking water contamination; and third, there was no evidence to show whether the water quality was worse during a drought year. The results suggest that there is an immediate need for: (1) spatio-temporal assessments of drought impacts on household drinking water availability and quality, (2) identification of sources of contaminations, and (3) recommendations for suitable (low-cost energy-efficient) water treatment prior to use in India's drought-prone areas while drought mitigation strategies are being designed.
Acknowledgments
The authors are sincerely thankful to the anonymous FGD participants; the Ministry of Education, Culture, Sports, Science and Technology (Monbukagakusho: MEXT), and University of Yamanashi, Japan, for their financial support of this study.
Conflicts of interest
The authors declare no conflicts of interest.