

Abstract
Assessing changes in the extent and management intensity of land use is crucial to understanding land-system dynamics and their environmental and social outcomes. Yet, changes in the spatial patterns of land management intensity, and thus how they might relate to changes in the extent of land uses, remains unclear for many world regions. We compiled and analyzed high-resolution, spatially-explicit land-use change indicators capturing changes in both the extent and management intensity of cropland, grazing land, forests, and urban areas for all of Europe for the period 1990–2006. Based on these indicators, we identified hotspots of change and explored the spatial concordance of area versus intensity changes. We found a clear East–West divide with regard to agriculture, with stronger cropland declines and lower management intensity in the East compared to the West. Yet, these patterns were not uniform and diverging patterns of intensification in areas highly suitable for farming, and disintensification and cropland contraction in more marginal areas emerged. Despite the moderate overall rates of change, many regions in Europe fell into at least one land-use change hotspot during 1990–2006, often related to a spatial reorganization of land use (i.e., co-occurring area decline and intensification or co-occurring area increase and disintensification). Our analyses highlighted the diverse spatial patterns and heterogeneity of land-use changes in Europe, and the importance of jointly considering changes in the extent and management intensity of land use, as well as feedbacks among land-use sectors. Given this spatial differentiation of land-use change, and thus its environmental impacts, spatially-explicit assessments of land-use dynamics are important for context-specific, regionalized land-use policy making.
Export citation and abstract BibTeX RIS

Original content from this work may be used under the terms of the Creative Commons Attribution 3.0 licence. Any further distribution of this work must maintain attribution to the author(s) and the title of the work, journal citation and DOI.
1. Introduction
Humankind depends on land use for food, feed, fibre, and bioenergy, yet the environmental trade-offs of land use, such as greenhouse gas emissions, water use and pollution, biodiversity loss or soil erosion, are substantial—from local to global scales (Foley et al 2005, MA 2005, Tilman et al 2011). As these trade-offs depend on site conditions and vary substantially in space, understanding where, how, and why land use is changing is thus important for mitigating them, and for developing policies to transition to more sustainable forms of land management (Turner et al 2007, Rounsevell et al 2012). In this context, land system science has so far predominantly focused on conversions among board land-use classes, such as deforestation (e.g., Geist and Lambin 2002, Hansen et al 2013, Graesser et al 2015), urbanization (e.g., Deng et al 2008, Taubenböck et al 2012), or forest expansion (e.g., Rudel et al 2005, Meyfroidt and Lambin 2011, Kuemmerle et al 2015). Changes in land-management intensity (e.g., agricultural and forest management intensification) have received much less attention (Erb et al 2013a), although intensity changes have long been widespread (Ellis et al 2013), are the dominating land-use change processes in some regions (Rudel et al 2009, Rounsevell et al 2012, McGrath et al 2015), and will likely increase in importance as pressures on land rises (Foley et al 2011, Lambin and Meyfroidt 2011, Fares et al 2015). Yet, assessing the spatial patterns of intensity change hinges on adequate spatial data on management intensity for large areas (Verburg et al 2011, Kuemmerle et al 2013).
Important links between changes in the extent of broad land-use classes on the one hand, changes in the management intensity within these classes are also increasingly emerging, with multiple co-occurring as well as spatially heterogeneous land-use changes frequently found. For example, agricultural intensification may co-occur with the concentration of agriculture on fertile soils and the abandonment of more marginal land (Stoate et al 2009, Piquer-Rodríguez et al 2012, Niedertscheider et al 2014) or, conversely, in the expansion of land use through rebound effects (Lambin and Meyfroidt 2011, Gasparri and le Polain de Waroux 2014). Similarly, urbanization is a powerful driver of land-system change, leading to agricultural intensification close to cities, while possibly reducing land-use pressure in the source areas of migrants (Aide and Grau 2004, Seto et al 2012). As globalization connects land systems across large distances, spatially disparate linkages between area and intensity changes may also occur. An example for this is the increasing spatial disconnection between production and consumption that may allow land in one region to be set aside while the land-use footprint embodied in traded goods increases elsewhere (Mayer et al 2005, Lambin and Meyfroidt 2011, Lenzen et al 2012, Kastner et al 2014). These examples highlight the importance of jointly analyzing changes in the extent and intensity of land use, but our understanding of how spatial patterns in these land-use change processes relate to each other, or how changes in one sector (e.g., agriculture) relate to changes in another (e.g., forestry, urban areas) remains weak.
During the second half of the 20th century, European land use has predominantly changed along intensification gradients (Rounsevell et al 2012). Agricultural systems were intensified substantially, especially during the 1960s–1980s, and Europe today has some of the most intensively managed croplands in the world (Haberl et al 2007, Mueller et al 2012). On the other hand, farmland area has declined in areas less suitable for agriculture, partly due to a declining profitability of farming as well as rural emigration (MacDonald et al 2000, Navarro and Pereira 2012). This triggered the widespread loss of traditional agricultural landscapes (Fischer et al 2012) and, together with active afforestation efforts, has increased the forest area by about 25% since the 1950s (Gold et al 2006, Fuchs et al 2013). In the same period, the growing stock in Europe's forests doubled (Gold et al 2006, Vilén et al 2015), due to nitrogen deposition, and climate change and changes in forest management practices (Ciais et al 2008, Erb et al 2013b, Pretzsch et al 2014). Finally, Europe expanded its conservation network substantially (Jones-Walters and Čivić 2013), and concerns about the environmental costs of intensification have resulted in a growing emphasis on multifunctionality, for example through agri-environmental and set-aside schemes (Tscharntke et al 2011, Whittingham 2011).
Where these different land-use change processes occur and how their spatial patterns relate to each other, however, has not been systematically explored. Only a few studies have observed conversions among broad land-use classes at the pan-European scale, either relying on small case study regions (Gerard et al 2010) or solely on the coordinated information on the European environment (CORINE) land-cover product (Büttner et al 2004, Feranec et al 2007, Hatna and Bakker 2011, Fuchs et al 2013). While CORINE captures some changes relatively well (e.g., urbanization), estimates for some key land-use change processes, for example agricultural abandonment or deforestation (which cannot be distinguished from forest clear-cutting in CORINE) are uncertain. Finally, rates and patterns of changes in the management intensity of agriculture and forestry are not captured by CORINE (Stoate et al 2009). New spatially-explicit, land-use datasets have recently become available for Europe (Neumann et al 2009, Temme and Verburg 2011, Levers et al 2014, Overmars et al 2014, Verkerk et al 2015, Plutzar et al 2016), providing new opportunities to better understand the relationship among different land-use change processes.
Our overarching goal was to map the spatial patterns of changes in the extent and management intensity in Europe's agriculture, forestry, and urban areas in order to identify land-use change hotspots and to assess the spatial congruence between land-use change processes. Our goal here was not to ascribe agency or to quantify the underlying causes of the land-use changes we identified. Specifically, we here asked the following research questions:
- (1)What were the spatial patterns of changes in the extent and intensity of agriculture, forest management and urban areas in the European Union between 1990 and 2006?
- (2)Where were hotspots and coldspots of these land-use changes in Europe?
- (3)How did the spatial patterns of these land-use changes relate to each other?
2. Methods and materials
2.1. Overview
Our methodological approach consisted of three steps (figure 1). First, we compiled a consistent database of high-resolution land-use change indicators for the EU-28, excluding Cyprus, Malta, and Croatia (figure S1). We gathered data on changes in the extent of cropland, grazing land, and forestry, as well as information on changes in the extent of urban areas (table 1). To measure management intensity, we used two types of complementary metrics, following Kuemmerle et al (2013): (1) input metrics, which measure inputs to production, usually per area (in our case: fertilizer application for cropland and livestock units for grazing land), and (2) output metrics, which relate outputs to inputs (in our case: yields for major crops for cropland, plant biomass removed for grazing land, and harvested roundwood volumes, table 1). We gathered these datasets for the years 1990 and 2006, the most recent year for which the majority of our datasets were available. A critical issue when jointly analyzing area and intensity changes is consistency between datasets. To ensure consistency, we relied wherever possible on land-use statistics from the common agricultural policy regionalized impact (CAPRI, Britz and Witzke 2012) and the Forest Europe (2011) database. Moreover, we aggregated or disaggregated all indicators to a common spatial resolution of 3 × 3 km2 (see section 2.1 and supporting information for details).
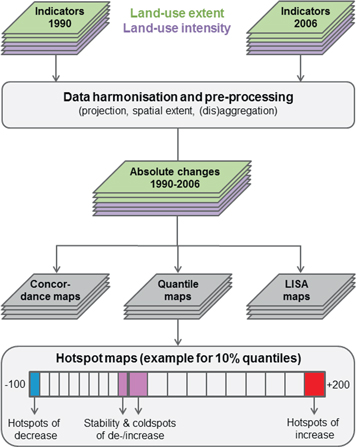
Figure 1. Methodological overview. We first compiled a database of land-use change indicators, pertaining to area and intensity changes, then used these indicators to calculate change rates, to identify hotspots and coldspots of land-use change, and to analyze the spatial congruence between area and intensity changes.
Download figure:
Standard image High-resolution imageTable 1. Indicators of land-use change used in the analyses to characterize land-system change between 1990 and 2006 (2012).
| Area change | Intensity change | |
|---|---|---|
| Cropland | Cropland area change (arable cropland and permanent cropland) | Changes in input intensity (fertilizer) |
| Fallow and abandoned land (agricultural abandonment, and agricultural recultivation) | Changes in output intensity (yield changes for major crops) | |
| Grazing land | Pasture/meadow area change | Changes in input intensity (livestock units) |
| Changes in output intensity (biomass removal from grazing land) | ||
| Forestry | Forestland area change | Changes in output intensity (harvesting volume) |
| Urban areas | Urban extent change | — |
Second, we calculated absolute land-use changes for each indicator. We then identified hotspots as the top 10th percentile of positive change (i.e. hotspots of increase) and the bottom 10th percentile of negative change (i.e., hotspots of decrease). As coldspots, we labelled all stable areas and areas with low change (lowest 10th percentiles of positive and negative change rates). We assessed the robustness of our results by carrying out a sensitivity analysis with alternative thresholds (see section 2.3 and supporting information). Third, we overlaid our indicators of area change and intensity change per land-use sector using concordance maps and used local indicators of spatial association (LISA) to identify statistically significant associations between area and intensity changes (see section 2.3).
2.2. Datasets used
In the following, we provide a summary of the datasets used in this study. Further detail on data sources and the preprocessing carried out is provided in the Supporting Information as well as in other publications describing individual datasets in detail.
2.2.1. Data on area changes
We used cropland and pasture area from the CAPRI database for the years 1990 and 2006 (i.e., corresponding with the CORINE time periods) at the NUTS-2 (Nomenclature des Unités Territoriales Statistiques) level. We allocated cropland area (i.e., arable land and permanent crops) as well as meadows and pastures to the 3 × 3 km2 gridcells using the CORINE cropland and the CAPRI-DynaSpat layers (Leip et al 2008, Heckelei and Kempen 2011) as weights (see supporting information). We also allocated meadows and pastures to the CORINE classes 'heterogeneous agricultural area', as well as to 'shrublands and 'grasslands' in the NUTS-2 regions where not all pasture area could be allocated otherwise.
Assessing changes in forestland from satellite-based land-cover maps such as CORINE is challenging, because forest cover changes can reflect permanent gains or losses in forestland, but also natural disturbance (e.g., storms or fire) or management (e.g., harvest), which do not reflect land-use change. To derive forestland maps, we therefore disaggregated harmonized, regional-level forestland statistics for the years 1990 and 2005 (Levers et al 2014) to the 3 km target grid using CORINE forest cover as weights (Plutzar et al 2016). To calculate the extent of urban area change, we relied on the 1990 and 2006 CORINE maps and calculated percent urban area within 3 × 3 km2 cells based on the 11 urban or built-up classes. Notably, an important asset of our dataset is thus that it is internally consistent at the level of gridcells (i.e., fractions of land-use classes described above summing up to 100%) as well as at the level of NUTS-2 regions (Plutzar et al 2016).
Agricultural abandonment is poorly captured by CORINE (Verburg et al 2009) and, to complement the land-use dataset above, we therefore mapped indicators of agricultural abandonment and recultivation from the moderate resolution imaging spectroradiometer (MODIS) normalized differenced vegetation index (232 m) time series from 2000 to 2012 (Estel et al 2015). For each year, we classified each MODIS pixel that fell within the CORINE cropland and pastures classes as either managed (i.e., plowed, mowed or grazed) or fallow. Using the resulting managed/fallow time series, we then defined agricultural abandonment (managed before 2006 but not thereafter) and recultivation (unmanaged before 2006, but managed thereafter) and summarized these classes at the 3 km target grid (see supporting information for further detail).
2.2.2. Data on intensity changes
In terms of cropland inputs, we used maps of homogenized fertilizer use data from the CAPRI database, which were originally classified into three fertilizer input classes (low: <50 kg ha−1, medium: 50–150 kg ha−1, and high: >150 kg ha−1), and then downscaled to a 1 km grid level (Temme and Verburg 2011, Overmars et al 2014). For the purpose of this study, these data were then aggregated to our 3 km target grid. In terms of cropland outputs, we used yields for the 13 most important crops from the CAPRI database for 1990 and 2006 and disaggregated these yields to the 3 km target grid using crop-specific suitability maps derived using a niche modelling approach.
Regarding grazing systems, we used grazing intensity maps (measured as livestock units (LSU) per pasture area) that were originally derived by calculating equivalent LSU form NUTS-2 level livestock numbers for the years 1990 and 2006, and then downscaling these data to a 1 km grid into four grazing intensity categories (1: <25 LSU/km2; 2: 25–50 LSU/km2; 3: 50–100 LSU/km2; and 4: >100 LSU/km2) (Neumann et al 2009). We aggregated these data to our 3 km target grid. Regarding output metrics, we used biomass yields (i.e., plant biomass removed from pastures) from CAPRI, disaggregated to our 3 km target grid, using a combination of actual net primary production and slope as weights (see supporting information for further detail).
To assess forest management intensity, we compiled harmonized roundwood production maps based on regional harvest statistics from 1990 and 2006 at the level of administrative units ranging from the national to provincial or forestry district level (NUTS-0 to NUTS-3, depending on country; see Levers et al 2014). Using harvest likelihood and forest cover as weights (Verkerk et al 2015), we disaggregated roundwood production to the 3 km target grid (see supporting information for further detail).
2.3. Analyzing spatial patterns of land-use change in Europe
The resulting database of area and intensity changes allowed us to calculate absolute change values on a per grid cell basis by subtracting the values in 2006 from 1990. Calculating change in the original data range (i.e., change expressed in absolute values rather than as percent change relative to 1990) avoids labeling areas as hotspots that are characterized by small overall area or intensity changes, but which may still exhibited high relative change.
To map hotspots, we derived quantile maps for each indicator (table 1) by assigning all values into bins comprising 10% of the total population. This was done separately for positive values and negative values (figure 1). We labelled the bins with the highest amount of positive and negative change per indicator as hotspots of increase and decrease, respectively. Bins with the lowest amount of positive and negative change or without any change were categorized as coldspots (i.e., areas of stability). To assess the sensitivity of our results to the selection of the 10%-threshold (i.e., the highest and lowest decile), we tested alternative hotspot classifications using thresholds of 2.5%, 5%, 7.5%, 15%, and 20% (see supporting information).
To summarize the hotspot maps across indicators, we counted how often a gridcell was included in a hotspot or coldspot, separately for the cropland, pasture, and forest management indicators and for area change and management intensity change. To highlight spatial patterns of area changes relative to intensity changes, we derived two-dimensional concordance maps for our cropland, pasture and forest management indicators. Finally, we quantified the spatial associations between area and intensity change using local indicators of spatial association (LISA, Anselin 1995). We used the bivariate Moran's I, which measures the strength of the spatial association between two variables by relating the value of a variable at one location to a different variable at neighboring locations. Using the area and intensity indicators for 1990 and 2006, we applied bivariate Moran's I to identify clusters of significant associations (p < 0.05, 999 permutations) of (1) increasing area and increasing intensity, (2) increasing area but declining intensity, (3) decreasing area and increasing intensity, and (4) declining area and declining intensity (see supporting information for further detail).
3. Results
3.1. Changes in the extent of broad land-use categories
The most widespread changes in the extent of land-use categories in the EU between 1990 and 2006 were cropland decline (∼136.660 km2), followed by expansion of grazing land (∼75 670 km2), and expansion of forest areas (∼70 630 km2). The least common conversion among broad land-use categories was urban expansion (∼16 820 km2). Agricultural abandonment (i.e., of cropland and grazing land) amounted to 20 500 km2 between 2000 and 2012, whereas recultivation after 2006 affected 16 430 km2. At the European scale, these area changes translate into moderate land-conversion rates in the agricultural sector between 1990 and 2006, ranging from −13.4% for permanent crops to +6.5% for meadows and pastures, while urban areas expanded by approximately 21%.
Changes in the extent of broad land-use categories after 1990 showed distinct spatial patterns across Europe (figure 2). While cropland declined slightly throughout much of the EU, hotspots of decline occurred mainly in Eastern Europe (e.g., north- and southeastern Poland, southeastern Czech Republic, southern Romania, northern and central Bulgaria) and the Mediterranean (e.g., central and southern Italy, southern Spain, northern Portugal, figure 3(A)). Cropland expansion was rare overall, and occurred mainly in the Netherlands, northern Germany, some areas in central France, and Ireland (figure 2(A)), without major hotspots in Eastern Europe (figure 3(A)). Large areas of Europe were characterized by stable cropland patterns, particularly in southern Finland and southern Sweden, central and southern Germany, northern France, and central and western Spain (figure 3(A)).

Figure 2. Spatial patterns of changes in the area of broad land-use categories in Europe ((A): cropland extent; (B): pasture extent; (C): agricultural abandonment; (D): agricultural recultivation; (E): forestland extent; F: urban extent). Changes refer to the period 1990–2006 (A), (B), (E), (F)) and 2001–2012 (C), (D). Scale refers to relative area changes within a 3 × 3 km2 gridcell.
Download figure:
Standard image High-resolution image
Figure 3. Hotspots of area changes among broad land-use categories between 1990 and 2006 (2000–2012 for (C) and (D)). Europe ((A): cropland extent; (B): pasture extent; (C): agricultural abandonment; (D): agricultural recultivation; (E): forestland extent; (F): urban extent). Hotspots include the 10% largest change values (in positive and negative direction). Coldspots/stability areas entail the 10% smallest change values (both positive and negative) as well as all unchanged areas. Areas outside hotspots and coldspots are in white (for hotspots based on alternative thresholds see supporting information).
Download figure:
Standard image High-resolution imagePastures were generally stable (figure 2(B)). A few hotspots of pasture expansion between 1990 and 2006 were located in Eastern Europe (e.g., southeastern and northeastern Poland, Bulgaria), central Italy and Sicily, southern Spain and much of Portugal, whereas pastures contracted mainly in Ireland, Scotland, the Netherlands, the Pyrenees, and central and northern Spain (figure 3(B)). Agricultural abandonment and recultivation after 2006 (i.e., mapped from MODIS satellite images) was often found in areas where cropland-grassland conversions happened between 1990 and 2006 (figures 2(C) and D). Hotspots of abandonment after 2006 occurred predominantly in Eastern Europe (e.g., northeastern Poland, Lithuania) and Scandinavia (figure 3(C)), but some recultivation of formerly abandoned areas was also found there (e.g., in Romania and Hungary, figure 3(D)).
Most areas in Europe had stable or slightly increasing forestland (figure 2(E)), with hotspots in the Mediterranean (i.e., northern Spain, Italy, Greece), the Baltics, Denmark, United Kingdom and Ireland (figure 3(E)). Forestland loss was much less widespread with some hotspots in southern Spain and Portugal (figure 3(E)). Urban extent increased mainly along coastal areas in the Mediterranean (in Spain, central Italy, and southern France) and around major cities (figure 2(F)), especially in England, the Netherlands and Belgium, around Madrid, Lisbon, Helsinki, and Stockholm (figure 3(F)). Urban shrinkage was not a notable land-use change at the European scale.
3.2. Intensity changes within broad land use categories
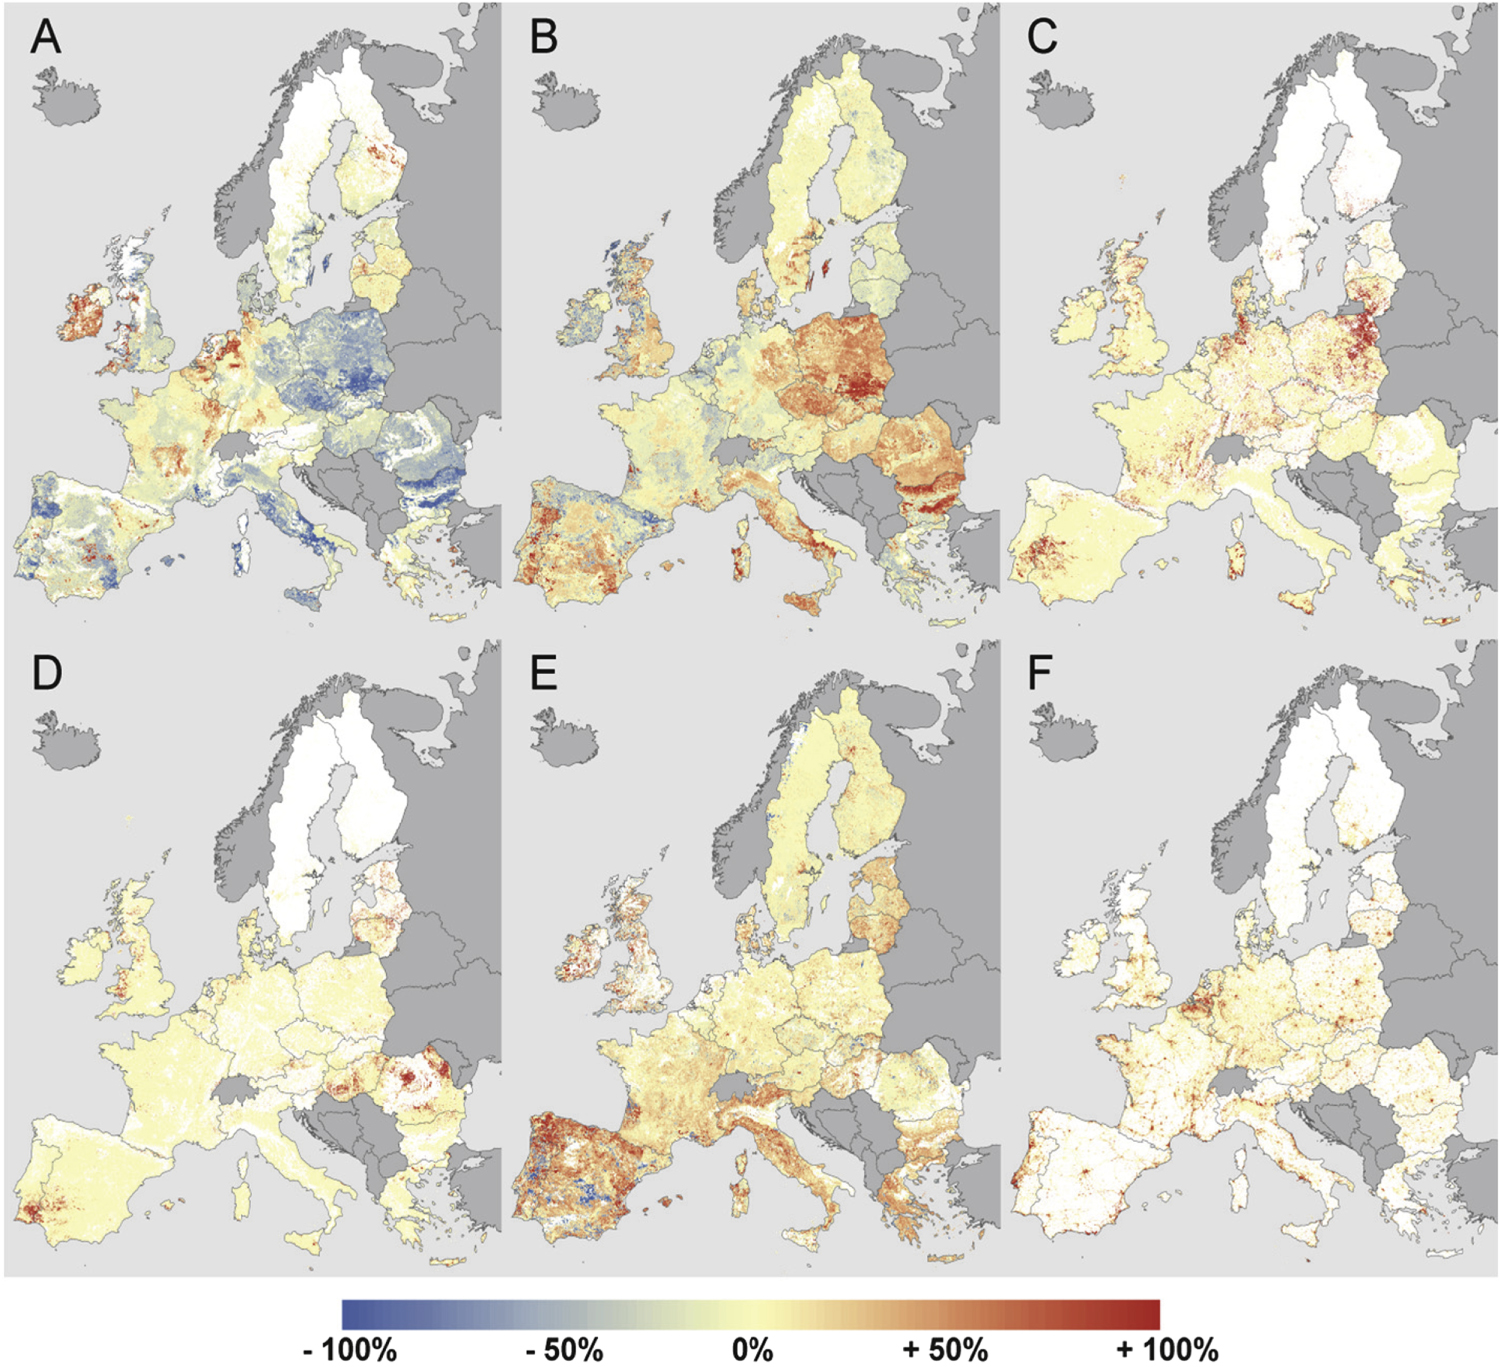
Changes in fertilizer use on Europe's cropland varied across Europe during 1990–2006 (figure 4(A)). Most hotspots of decline occurred in Southeastern Europe (e.g., Hungary, Romania, Bulgaria), with smaller hotspots of decline in western Germany, western France, and southern England (figure 5(A)). Fertilizer use increased in eastern Germany, Poland, and the Czech Republic, northern Italy, and central Spain. Many areas characterized by intensive agriculture remained in our most intensive category (e.g., most of Germany, France, Denmark, figure 4(A)). Patterns of changes in cropland yields showed a similar East–West pattern, consistent with changes in input-intensity (figure 4(B)). Stable or increasing yields were found throughout much of Western Europe, and yield decreases in many Eastern regions (e.g., Poland, Czech Republic, and Bulgaria, figure 5(B)). Livestock density declined across most of Europe (figure 4(C)), most notably in the UK, northern Germany, the Baltics, and central France (figure 5(C)). Grazing land intensity, measured in biomass removal, also showed a clear East–West gradient (figure 4(D)), with strong declines in Eastern Europe (e.g., Poland, Romania, Bulgaria, and Hungary, figure 5(D)).

Figure 4. Spatial patterns of changes in the intensity within broad land-use classes in Europe between 1990 and 2006 ((A): fertilizer use on cropland [scaled between −120 and +150 kg ha−1]; (B): crop yields [±1 kg C m−2]; (C): livestock density [−90; +25 livestock units]; (D): biomass removal from grazing land [±1 kg C m−2]; (E): roundwood production [−14.2; +7.6 m−3 ha−1 yr−1]).
Download figure:
Standard image High-resolution image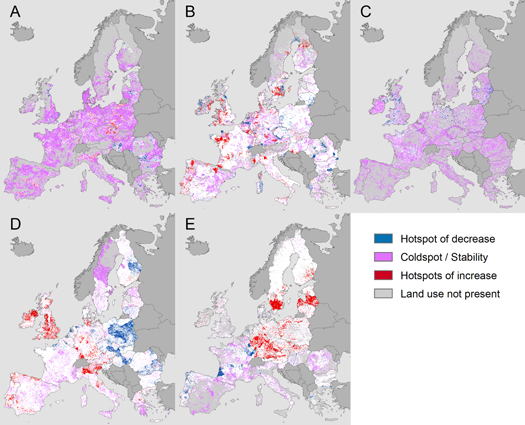
Figure 5. Hotspots of intensity changes between 1990 and 2006 ((A): fertilizer use on cropland; (B): crop yields; (C): grazing land livestock density; (D): biomass removal from grazing land; (E): roundwood removal). Hotspots include the 10% largest change values (in positive and negative direction). Coldspots/stability areas entail the 10% smallest change values (both positive and negative) as well as all unchanged areas. Areas are outside hotspots and coldspots are in white (for hotspots based on alternative thresholds see supporting information).
Download figure:
Standard image High-resolution imageWith regards to forest management intensity, roundwood production volumes remained relatively stable between 1990 and 2006 in Southern and Western Europe, but increased in central and northern Europe (figure 4(E)). Hotspot of increasing roundwood production were found particularly in mainly in southern Sweden, Latvia, in southern and western Germany, Austria, Czech Republic and Poland and hotspots of declines in roundwood production occurred mainly in Southwest and Northeast France, Luxembourg and Portugal (figure 5(E)).
3.3. Summarizing hotspots of area and intensity changes across indicators
Hotspot areas had surprisingly little overlap (figure 6). While the highest number of co-occurring hotspots was seven, only 1.8% of all areas within any hotspot were included in four or more hotspots. Seventy percent of all hotspot areas were classified as only one type of hotspot, suggesting that, at the resolution of our analyses (3 × 3 km2), most areas where characterized by single land-use changes rather than multiple co-occurring or diverging land-use changes.
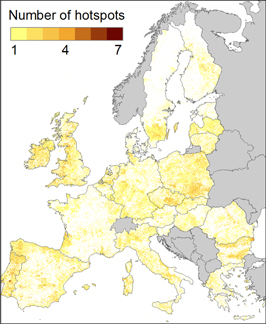
Figure 6. Number of overlapping hotspots (increase or decline) of land-use change between 1990 and 2006 across Europe (highest possible number = 11).
Download figure:
Standard image High-resolution imageOverlaying area and intensity changes (figure 7) confirmed the insights from the individual indicators; specifically the strong East–West divide and the relative stability of large areas in Europe (grey areas in figures 7(A)–(E)). However, the overlay also showed interesting patterns of co-occurrence of land-use change processes. Generally, few areas were characterized by significant associations of increases in area and intensity (black areas in figures 7(F)–(J)), Notable examples of this pattern include Western Europe regarding cropland (figure 7(G)), or Portugal and England regarding pastures (figure 7(I)). Co-occurrence of area decline and intensification (cyan areas in figures 7(F)–(J) was more dominant, for example regarding cropland decline and fertilizer use in many Eastern European areas (figure 7(F)) or regarding pastures decline and biomass yield in Western and Central Europe (figure 7(I)). Area expansion co-occurring with disintensification (red colors in figures 7(F)–(J)) were scattered for cropland while much of Eastern Europe had increasing pasture areas and declining biomass yields (figure 7(I)). In terms of forest management intensity, a clear pattern of stable intensity and increasing forest extent was visible in the Mediterranean and in Western Europe, whereas increased harvests on stable forest area in Central and Northern Europe were prevalent (figure 7(J)). Overall, Western Europe's agricultural area was characterized as stable or intensifying while Eastern Europe exhibited stable or declining agricultural extent and intensity.

Figure 7. Area changes versus change in land management intensity between 1990 and 2006. Top row: concordance maps of changes in (A) cropland area versus fertilizer use, (B) cropland area versus yields, (C) pasture area versus fertilizer use, (D) pasture area versus yields, (E) forest area versus wood removals. Bottom row: Clusters of significant associations of area and intensity changes (increase/increase, increase/decline, decline/increase, and decline/decline) for changes in (F) cropland area versus fertilizer use, (G) cropland area versus yields, (H) pasture area versus fertilizer use, (I) pasture area versus yields, (J) forest area versus wood removals. Spatial association were significant based on Moran's I (p < 0.05).
Download figure:
Standard image High-resolution image
4. Discussion
We here analyzed spatial patterns of land-use change in Europe since 1990. While a range of studies have explored European land-use change, these studies were typically carried out for small study regions, over short time periods, or on the level of coarse administrative units. To the best of our knowledge, our study is the first to consistently map changes in the extent of as well as changes in management intensity for cropland, grazing land, forestry, and urban areas at high spatial resolution across all of Europe—thereby highlighting the substantial geographic variation in land-use change processes found in Europe. Four cross-cutting patterns emerge when synthesizing across the individual land-use change processes we assessed: (1) a clear, but not ubiquitous East–West divide in terms of land-use change, (2) spatially diverging trends of stable or intensifying agriculture in areas highly suitable for agriculture, and disintensification and abandonment in more marginal areas, (3) a spatial separation of areas with increasing forest area and increasing management intensity, and (4) a marked geographic heterogeneity of land-use change, with pockets of co-occurring area decline and intensification, as well as co-occurring area increase and disintensification scattered across of Europe. While our goal was not to assess the causal drivers of the observed land-use change trends, we here provide interpretations of these recurring patterns, address limitations of our approach, and provide suggestions for follow-up work.
We found a strong East–West divide in terms of land-use change during 1990–2006, with fairly constant cropland area but stable or increasing land management intensity in the West, and declining cropland area and intensity in the East (figures 2 and 4), thereby confirming prior work based on individual case studies (Krönert et al 1999, Feranec et al 2007), systematic reviews and cross-site comparison (Palang et al 2006, Feranec et al 2012, van Vliet et al 2015), or coarse-scale land-use statistics (Niedertscheider et al 2014, Gingrich et al 2015, Jepsen et al 2015). Two factors appear to contribute to these patterns in major ways. First, the breakdown of socialism in 1989 triggered widespread agricultural abandonment (Henebry 2009, Schierhorn et al 2013, Estel et al 2015) and a strong decline of capital-intensive farming practices (e.g., lower pesticides and fertilizer applications) throughout Eastern Europe (Rozelle and Swinnen 2004). However, land reforms, the level and pace of reorganization of agricultural sectors, and state-support for agriculture differed substantially among countries (Swinnen 2000, Lerman et al 2004), resulting in the spatial heterogeneity of land-use change within Eastern Europe observed in our analyses (figures 2 and 4). Second, some areas in Eastern Europe were never collectivized and industrialized, and thus did not reach the intensity levels of the West (Palang et al 2000, Rozelle and Swinnen 2004, Fischer et al 2012). Agricultural intensification in the 19th and 20th century also began later and progressed slower in Europe's East than in its West (Jepsen et al 2015). thus, yields gaps are higher in Eastern Europe and intensification easier, likely in part explaining the patterns of stronger agriculture intensification we found for some Eastern Europe regions (figure 4). Third, farmers in Western Europe generally benefitted in the 1990 s from a massive support system under the EU's Common Agricultural Policy (CAP), while Eastern Europe's farmers had no access to these subsidies during most of our study period (Shucksmith et al 2008, Hodge et al 2015). This changed with the eastward expansion of the EU in 2004 and 2007, after which we found hotspots of cropland expansion in 2006–2012 (figure 2).
A second major land-use change in the EU-27 after 1990 was the contraction of cropland in areas not well-suited for agriculture (figures 2 and 3), thereby confirming case-study evidence from Europe's mountain regions (MacDonald et al 2000, Tasser et al 2007, Rutherford et al 2008), the Mediterranean (Stellmes et al 2013, Plieninger et al 2014), Northern Europe (Larsson and Nilsson 2005, Beilin et al 2014), and Eastern Europe (Baur et al 2006, Müller et al 2009). Major agro-ecological limitations (e.g., water shortages during the growing period, rugged terrain) and socio-economic constraints (e.g., low market accessibility, labor shortage, structural change in agriculture) result in a declining profitability of traditional and mixed farming in these regions, leading to abandonment (Baldock et al 1996, Navarro and Pereira 2012, Stellmes et al 2013, Terres et al 2015), despite substantial CAP support for such areas (Shucksmith et al 2008, Hodge et al 2015). Moreover, CAP reforms during our study period also resulted in the fraction of farm support linked to production declining from 87% in 1989 to 27% in 2009, and the initiation of major set-aside schemes (Tscharntke et al 2011, Moore and Lobell 2015). This likely contributed to the widespread cropland to grassland conversions we found in marginal areas (figure 2). Finally, increasing displacement of cropland production to areas outside the EU contributed further to Europe's declining cropland area (Kastner et al 2014).
Forest area increased across most of Europe, mainly in regions characterized by cropland and pasture decline (figure 2) linked to ongoing urbanization (Antrop 2004) and emigration from the more remote rural areas (Poyatos et al 2003, Piquer-Rodríguez et al 2012, Stellmes et al 2013, Terres et al 2015). Gains in forestland also occurred in regions with afforestation programs (e.g. United Kingdom and Ireland, Zanchi et al 2007). These changes are likely part of a more long-term recovery from historical deforestation, which happened earlier in Western and Central Europe compared to Eastern and Southern Europe (Mather and Needle 1999, Fuchs et al 2013). However, our analysis also revealed that deforestation has occurred, notably in Southern Spain and Portugal, which often remains unnoticed in the statistics of net forest area change (Nabuurs et al 2013). Our results also showed that changes in forest extent were spatially not correlated to changes in roundwood production, highlighted by the increasing harvests on stable forestland in Northern, Central and Eastern Europe versus stable harvests on increasing forestland in the Mediterranean (figure 7). This can be explained by the fact that young forests do not immediately increase wood supply and that Mediterranean forest may be more important for other services than wood production. The observed increasing harvest in Eastern Europe likely are linked to the privatization of state forests and the modernization of wood processing industry, following the collapse of socialist systems (Bemmann and Grosse 2001, Ioras and Abrudan 2006, Munteanu et al 2016). We also note that some of our hotspots of increasing and decreasing wood removals coincided with regions where major wind-throws resulted in large salvage harvests in our observation period (e.g., southern Sweden, Latvia, and southeastern France).
Prior work has highlighted a stable cropland extent in regions well-suited for farming for Western and Central Europe (Rounsevell et al 2012, Plutzar et al 2016). Our results confirm these studies (figures 2 and 3), but furthermore suggest that agricultural intensity remained stable or increased there after 1990 (figure 7). Likewise, fertile regions in Eastern Europe, such as southern Romania, Hungary, the Czech Republic or some parts of Poland, had increasing cropland use intensity (e.g., fertilizer use), and were even hotspots of cropland expansion during our observation period. Our study thus bolsters earlier work based on case studies or broad-scale statistics suggesting an increasing concentration of agriculture in suitable areas, sometimes occurring next to areas characterized by disintensification and abandonment (Robinson and Sutherland 2002, Stoate et al 2009, Piquer-Rodríguez et al 2012, Vanwambeke et al 2012, Jepsen et al 2015). Yet, our overlay analyses (figure 7) goes further in highlighting the heterogeneous spatial patterns at which the spatial reorganization of agriculture occurs, both in Europe's West and East (e.g., figure 7). Yield increases in intensifying areas were overall moderate though, especially in Europe's West, possibly as a result of the decoupling of subsidy payments and commodity outputs, policies to reduce fertilizer use, and to a lesser extent climate change (Bindi and Olesen 2010, Rounsevell et al 2012, Moore and Lobell 2015).
A number of limitations and factors contributing to uncertainty need mentioning. First, while we gathered a comprehensive land-use change dataset for Europe, we were unable to include some potentially important agricultural indicators (e.g., mechanization, pesticide use, labor) or forestry indicators (e.g., harvest regime, tree species and provenance selection, fertilizer use, extraction of logging residues and stumps), as well as information on non-productive land uses (e.g., recreation), due to the absence of European-wide spatial data. Spatial information is particularly lacking regarding forests management, and while we were able to include one indicator (roundwood production) other indicators to characterize forest management intensity (Luyssaert et al 2011, Schall and Ammer 2013) would have enriched our analyses. Second, several of the intensity indicators we used are based on statistical data, which are sometimes of unknown reliability and may underestimate intensity (e.g., due to unregistered wood removal). While our aggregation/disaggregation procedures removed some of these inconsistencies (e.g., mismatch between CORINE and CAPRI cropland extent), we cannot rule out that errors in our input data have not propagated into our result. Third, several of our indicators represent snapshots in time, which may be less problematic for area changes, but could affect our intensity measures because temporally and spatially variable phenomena may affect management intensity more strongly (e.g., droughts that reduce yields, or salvage logging following storms or insect outbreaks). Fourth, our MODIS-based abandonment mapping did only partly cover our observation period, because MODIS data are only available since 2000. As such, our MODIS-based abandonment/recultivation maps should mainly be seen as complementing the CAPRI/CORINE-based cropland/grazing land information by expanding the time period until 2012 for these transient land-use change processes. Finally, our threshold criterion for selecting hotspots was arbitrary, and different thresholds result in smaller or larger hotspots and coldspots of land-use change (figures S3 and S4). Importantly though, our sensitivity analyses shows that the spatial pattern of hotspots identified would not change in major ways.
Compiling a thematically rich, spatially-detailed, and internally consistent land-use change database for all of Europe required us to partly rely on land-use statistics, that are often only available at coarse scale (e.g., NUTS-2 or 3), and to homogenize and summarize all datasets to our common 3 km target grid. Several of our indicators thus required disaggregating and aggregating input data (Neumann et al 2009, Temme and Verburg 2011, Verkerk et al 2015). Disaggregation often relies on ancillary data such as land-cover maps, meaning that uncertainty in input layers may propagate into derivative maps. A formal sensitivity analysis regarding all methodological steps taken to derive the input indicators would and their possible effects on our hotspot and intensity versus area change maps is not feasible. We note though that all of these indicators have undergone rigorous robustness tests and validation efforts, which are documented in the respective publications detailing these indicators (Neumann et al 2009, Temme and Verburg 2011, Estel et al 2015, Verkerk et al 2015, Plutzar et al 2016).
Understanding the spatial patterns of changes in the extent and intensity of land use, and how these relate to each other, is important for understanding land-use change trajectories. Our analyses highlight the diverse spatiotemporal patterns, as well as hotspots and coldspots of land-use changes in Europe, and the importance of jointly considering changes in the extent and management intensity of broad land use categories. Moreover, our analyses highlight spatially-explicit land-use changes (e.g., patterns of cropland expansion and contraction), which are typically hidden in regional or national level statistics that capture net change only. For example, most regions were relatively stable in regard to many indicators we assessed, but also typically fell into at least one hotspot of land-use change (figure 6). Likewise, hotspots of change were often rather scattered, with regions dominated by one land-use change sometimes bordering regions where the opposite change was prevailing (figures 2 and 4). Our overlay analyses further emphasized that area changes and intensity changes often occur spatially segregated (e.g., abandonment alongside recultivation/intensification in Eastern Europe, figures 2 and 7). In another example, increasing input intensity (i.e., fertilizer use in our case) was not necessarily related to increasing output intensity (i.e., yields) and vice versa (figure 4).
Collectively, our study thus backs up calls for a more context-specific, regionalized policy-making (Shucksmith et al 2008, Fischer et al 2012, van Eupen et al 2012), for better understanding the outcomes of land-use change for ecosystem service flows and biodiversity, and for understanding and possibly lessening the trade-offs among different land uses. Deriving typologies of typical land-use changes characterizing Europe is thus an interesting arena for future research (Levers et al 2015, Stürck et al 2015). Likewise, research focusing on the causes of the land-use change patterns we have observed and mapped would be beneficial, including assessing the outcome of policy interventions (e.g., CAP reforms, Natura2000, agro-environment schemes, sugar market liberalization, biofuel policies) and institutional reforms (e.g. privatization of state owned forests), and the relative importance of climate change in reshaping European land use. Finally, our results can provide entry points for assessing the outcomes of land-use changes for ecosystems, their functioning, and the services they provide to society.
Acknowledgments
We would like to thank C Kroisleitner for help in preparing some of the input layers, and H Haberl, P Hostert, P Meyfroidt, J O Nielsen, and T Plieninger for fruitful discussions in earlier stages of this manuscript. The constructive and helpful comments by three anonymous reviewers improved this manuscript greatly and we are grateful for their efforts. We gratefully acknowledge funding by the European Commission (Integrated Projects VOLANTE 265104 and HERCULES 603447, and ERC Starting Grants 263522 LUISE and 311819 GLOLAND), the Einstein Foundation, Berlin (EJF-2011-76), and the Austrian Science Funds (FWF, Project P20812-G11). This research contributes to the Global Land Project (www.globallandproject.org).