

Abstract
Human alteration of the nitrogen cycle exceeds the safe planetary boundary for the use of reactive nitrogen (Nr). We complement global analysis by analyzing regional mass flows and the relative consequences of multiple chemical forms of Nr as they 'cascade' through multiple environmental media. The goals of this paper are (1) to identify the amounts of Nr that flow through a specific nitrogen rich region, (2) develop multiple metrics to characterize and compare multiple forms of Nr and the different damages that they cause, and (3) to use these metrics to assess the most societally acceptable and cost effective means for addressing the many dimensions of Nr damage. This paper uses a multiple metrics approach that in addition to mass flows considers economic damage, health and mitigation costs and qualitative damages to evaluate options for mitigating Nr flows in California's San Joaquin Valley (SJV). Most analysis focuses attention on agricultural Nr because it is the largest flow in terms of mass. In contrast, the multiple metrics approach identifies mobile source Nr emissions as creating the most economic and health damage in the SJV. Emissions of Nr from mobile sources are smaller than those from crop agriculture and dairy in the SJV, but the benefits of abatement are greater because of reduced health impacts from air pollution, and abatement costs are lower. Our findings illustrate the benefit of a comprehensive multiple metrics approach to Nr management.
Export citation and abstract BibTeX RIS

Original content from this work may be used under the terms of the Creative Commons Attribution 3.0 licence. Any further distribution of this work must maintain attribution to the author(s) and the title of the work, journal citation and DOI.
1. Introduction
Nitrogen (N) is an essential element for life. Reactive nitrogen (Nr) consists of all chemical forms of N other than the dinitrogen gas, N2, which makes up ∼78% of the atmosphere. The N cycle describes how Nr is exchanged among the atmosphere, biosphere, hydrosphere, and land. Nitrogen is fixed from the atmosphere into biologically available Nr by microorganisms and lightning, but intentional and unintentional releases of anthropogenic Nr have drastically changed the global N cycle. The majority of anthropogenic Nr is created by the Haber–Bosch process and used predominantly for fertilizer. Nitrogen fertilizer increases crop production, but more than half of agricultural N is released to the environment in chemical forms that have caused contamination of drinking water, eutrophication of water bodies, and the creation of over 400 anoxic dead zones in estuaries (Diaz and Rosenberg 2008, EPA Science Advisory Board 2011). The combustion of fossil fuels for transportation and industry also creates Nr as nitrogen oxides (NOx), which contribute to respiratory and heart disease. Both fossil fuel combustion and the biological process of denitrification, which converts Nr back to N2, release nitrous oxide (N2O), a powerful stratospheric ozone-depleting and heat-trapping greenhouse gas (GHG).
Concentrations of agricultural Nr exceed a safe planetary boundary for sustainable use of global resources (Rockström et al 2009, Steffen et al 2015). The boundary is estimated by comparing anthropogenic use of Nr to annual natural ecosystem Nr fixation. The global high-risk limit for total new Nr creation is 0.55 tonnes N km−2 yr−1 (Steffen et al 2015). At the global level, this rate is exceeded by crop fixation alone (1.0 tonnes N km−2 yr−1). When including all sources of anthropogenic Nr, the global Nr production is 1.5 tonnes N km−2 yr−1. However, certain regions far exceed the global average. For example, the Nr intensity is even greater in the US and the state of California, which exceed the high-risk limit by a factor of 1.9 and 1.7, respectively, for agricultural N2 fixation alone (Liptzin and Dahlgren 2016, EPA Science Advisory Board 2011). These factors increase significantly when additional reactive Nr sources from combustion and industry are included (table 1).
Table 1. Reactive nitrogen (Nr) intensity by region.
| Regiona | Crop fixation of N2 into Nr (tonnes km−2 yr−1)b | Total new anthropogenic Nr (tonnes km−2 yr−1)c |
|---|---|---|
| San Joaquin Valley | 4.8 | 10.1 |
| California* | 1.7 | 3.5 |
| United States** | 1.9 | 4.1 |
| World† | 1.0 | 1.5 |
| High Risk Limit‡ | 0.55 | 0.55 |
aSources: * Liptzin and Dahlgren (2016); ** EPA Science Advisory Board (2011); † Fowler et al (2013); ‡ Steffen et al (2015). bCrop fixation of N2 into Nr represents the total Nr added to the system through fixation by crops or the Haber–Bosch process. cTotal new anthropogenic Nr includes all new sources of Nr, including fertilizer (excluding manure), fuel combustion and chemicals manufacturing in addition to crop fixation.
The extent by which local Nr intensities exceed the planetary boundary suggests that regional consequences of local releases of Nr are important to consider when developing Nr management strategies. However, an approach to quantify the effects of Nr based on a simple mass flow metric does not capture the full scope of consequences of excess Nr, nor does it point to possible solutions. The N cascade concept was developed to track how the rapid transformations and ready transport of Nr can lead to multiple environmental problems as it flows through ecosystems (Galloway et al 2003). Unlike a simple mass accounting of Nr, the cascade concept highlights the consequences of the multiple chemical forms of N in the environment.
These consequences can be expressed using multiple metrics, including mass flows, damage costs, health effects, and abatement costs associated with Nr flows. Damage and health costs are useful metrics for directly comparing disparate damages from different chemical forms and quantities of Nr. Damage costs also reflect the value that society places on the lost ecosystem service or the damages suffered. Prior work addressing Nr in the Chesapeake Bay airshed demonstrated how using multiple metrics to evaluate management interventions can prioritize very different courses of action than mass flow metrics. Evaluating economic damage costs and health impacts, and the cost-effectiveness of mitigation or remediation based upon each metric has significant import for policy and decision-making (Moomaw and Birch 2005, Birch et al 2010, Compton et al 2011, EPA Science Advisory Board 2011, Sobota et al 2015).
This work employs multiple metrics to assess the consequences of the multiple stages of the N cascade in the San Joaquin Valley (SJV) of California. There are three main objectives of the article. The first is to identify and analyze the amount of reactive nitrogen (Nr) that flows in a nitrogen rich region (the SJV) and to compare the intensity of that to global averages and planetary boundaries. The second is to propose the use of multiple metrics to compare the diverse consequences of multiple forms of reactive nitrogen to one another. The third objective is to utilize these metrics to identify the most societally acceptable and cost-effective means for mitigating or ameliorating those damages when developing policies, identifying prospective actions or making management decisions.
The study region was chosen because of the mix of intensive agricultural production combined with large urban areas and a history of air and water pollution associated with excess Nr. We extend the multiple metrics approach to include a geographic analysis showing the confined geographic locality of several Nr-related damages. We demonstrate the extreme consequences of localized Nr releases that are obscured in global averaging. Finally, we suggest that this approach be used to guide policy-making towards methodologies that incorporate a full accounting of the environmental and health damages from Nr flows and the costs of mitigation, rather than relying on a single mass flow metric.
2. Study area and approach
The SJV covers 83 000 km2 in California's Central Valley and comprises the San Joaquin River and Tulare Lake hydrological regions (figure 1). We utilized GIS to define the actual valley air and water shed area and allocated the Nr releases appropriately. It is bounded by the Sierra Nevada mountain range to the east and the Coast Ranges to the west. Cool, wet winters and hot dry summers characterize the climate, with 90% of runoff from precipitation occurring between November and April. While home to over 8 million people, the SJV is also one of the most productive agricultural areas in the world, producing more than 250 crops with a cumulative value of over $25 billion annually (United States Census Bureau 2010, EPA 2015). Crops are irrigated from surface water diversions from melting snow-fed rivers draining the Sierra Nevada as well as from groundwater withdrawals. The long growing season and highly developed water infrastructure are critical to the high levels of agricultural production.

Figure 1. (a) California counties comprising the SJV and (b) the SJV in detail.
Download figure:
Standard image High-resolution imageGrowing agricultural intensity in the SJV has altered the N cascade through increased use of fertilizers, manure production, and other agricultural practices. Nitrogen fertilizer use has increased by 800% in the United States between 1960 and 2000 (Fixen and West 2002). This has resulted in rising nitrate  concentrations in both shallow and deep aquifers since the 1950s (Burow et al 2008, 2013), routinely exceeding USEPA drinking water standards (National Water-Quality Assessment Program (US) 1998). Central California also has some of the highest airborne particulate matter levels in the United States, particularly during the winter season. Fine particles (PM2.5), primarily comprised of ammonium nitrate (NH4NO3), can cause serious respiratory and cardiovascular health effects (Herner et al 2005).
While the health effects are less well-documented for  in drinking water than particulates in the air, there is growing concern about a range of negative outcomes associated with long-term ingestion of
  in drinking water (Ward et al 2005). Yet many Nr flows are not fully documented or understood (Galloway and Cowling 2002). Quantifying the N cascade within the region can provide insights for integrated Nr management.
We begin by summarizing the mass flows of Nr throughout the study area, largely following the approach developed by Liptzin and Dahlgren for the whole state of California. Details of sources and calculations are provided in the supplementary data (SD) online. To summarize, we calculate major inputs, transformations, and sinks of Nr within the study area and exports of Nr to areas outside the study area using the best available data sources for the years 2008–2010. Flows were aggregated for the entire SJV to perform as complete a mass balance as possible for the study area (which includes both point sources and geographically-distributed emissions of Nr).
We then convert mass flows into to economic damage flows using estimated per-kg N damage costs. Specifically, the damages from Nr are divided into two broad categories: non-health damages and health-related costs. Estimates of the per-kg Nr damage costs for non-health effects are taken from prior research (Birch et al 2010, Compton et al 2011). Health damage costs from PM2.5 concentrations are estimated using the US EPA's BenMAP model (Abt Associates 2008). Briefly, we apportion ambient particulate NH4NO3 concentrations to the original Nr flows following Ying and Kleeman (2006). We then simulate the changes in health outcomes—and, hence, the changes in economic damages—from eliminating each flow in BenMap. The per-kg economic health-related damages are calculated by dividing the total economic damages by the size of the Nr flow. Additional details about the damage cost calculations are fully described in the SD.
Finally, we provide a comparison of mass flows, damage costs, and abatement costs associated with specific Nr flows. Geographical analysis using GIS software is employed to generate maps of different mass and damage flows, which are included to provide a sense of the distribution of Nr flows and impacts in the SJV. We compare these multiple metrics to identify the most effective point for intervention and appropriate policy options, and contrast our findings with analysis confined to mass flows.
3. Results
3.1. Nr mass flows
The major Nr flows in the SJV (expressed in tonnes N yr−1) are illustrated in figure 2. The uncertainties associated with the Nr flow estimates vary widely (Liptzin and Dahlgren 2016). In particular,  leaching to groundwater from cropland soils is unregulated and largely unmonitored. Likewise, Nr data from wastewater treatment plants and dairies is not comprehensive, nor is data describing N2O emissions from mobile sources (CARB 2014). In any case, the uncertainty about any given flow is unlikely to alter the relative ranking presented in this analysis since mass flows vary by several orders of magnitude.
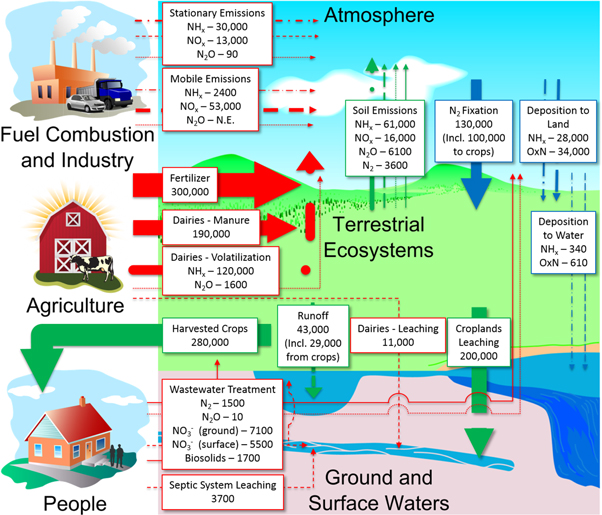
Figure 2. Estimated nitrogen mass flows (tonnes N yr−1). Arrows are color-coded by origin (red = direct anthropogenic releases; green = terrestrial sources; blue = atmospheric deposition). Arrow thickness corresponds to the magnitude of the flow and the line type indicates the speciation, if known (solid = N2 or no species; dash (– –) = NOx; dash–dot (– · –) = NHx; dot (...) = N2O, which is separated when possible). OxN includes all oxidized N species in atmospheric deposition, while NOx is primarily NO2. N.E. means no estimate is available. Data are for the years 2008–2010; data sources can be found in the SD. Components of this figure were adapted from http://openclipart.org.
Download figure:
Standard image High-resolution imageThe majority of new Nr input in the study area originates from agricultural activity. Fertilizer application constitutes the largest single source of Nr in the study area (300 000 tonnes N yr−1; Rosenstock et al 2014). The production of manure (321 000 tonnes N yr−1) represents recycling of N within the study area. A large amount (120 000 tonnes N yr−1) of manure N volatilizes as ammonia (NH3), but the majority (190 000 tonnes N yr−1) is applied to land in the SJV (Rosenstock et al 2014). More than 240 000 tonnes of the Nr applied to cropland reaches groundwater and surface waters every year (see SD and figure 2). Unlike the Nr that enters surface water in runoff and then flows out to San Francisco Bay, the Nr that leaches to groundwater (200 000 tonnes Nr yr−1) represents an accumulation of N in the SJV water supply as only a small fraction is converted to N2 (Liptzin and Dahlgren 2016). The rate of gaseous emissions is greatest from agricultural soils, but cropland occupies only a small fraction of the land surface. However, agriculture is the largest anthropogenic source of nitrous oxide (N2O), which has become the largest contributor to stratospheric ozone depletion and is a significant GHG (Kanter et al 2013).
Stationary fuel combustion and other industrial activity (such as manufacturing) releases ∼43 000 tonnes N yr−1. These emissions are comparable to those from mobile sources (automobiles), which stood at 55 000 tonnes N yr−1 in 2008 before declining by as much as a third in recent years (Environmental Protection Agency 2008).
The net result is that Nr flows in the SJV exceed the high-risk planetary boundary by a far greater degree than nationally- or state-averaged figures would suggest (table 1). In particular, Nr fixation by crops alone exceeds the high-risk limit by a factor of 9, while total Nr inputs exceed this limit by a factor of 18.
3.2. Economic damages
The economic damages from major Nr flows of damage for the SJV (expressed in thousands of dollars per year) are illustrated in figure 3. As is the case when quantifying Nr flows, there are differences in the uncertainties in the damage costs. For example, there are far fewer studies quantifying the damage costs associated with Nr in groundwater compared to air pollution, meaning there is greater uncertainty in the damages from Nr contaminating groundwater sinks.

Figure 3. Estimated nitrogen damage cost flows within the study area in $1000 yr−1. Arrows are color-coded by origin (red = direct anthropogenic releases; green = terrestrial sources; blue = atmospheric deposition). Arrow thickness corresponds to the magnitude of the flow and the line type indicates the speciation, if known (solid = N2 or no species; dash (– –) = NOx; dash–dot (– · –) = NHx; dot (...) = N2O, which is separated when possible). OxN includes all oxidized N species in atmospheric deposition, while NOx is primarily NO2. Note that no estimates are available for the damage caused by accumulation of nitrogen in soils or natural lands. The NOx deposition cost relates to the damage caused to buildings by acid rain. N.E. is no estimate available. A tabulation of per-kg damage costs can be found in the SD. Components of this figure were adapted from http://openclipart.org.
Download figure:
Standard image High-resolution imageThe greatest economic damages arise from airborne Nr emissions. These damages, which include $1.9 billion yr−1 for mobile sources, $470 million yr−1 for stationary industrial sources, and $510 million yr−1 for emissions from dairy farms, are associated with health effects, including respiratory problems from particulate air pollution. Our damage assessment focuses on NH4NO3 particulate matter, which requires both nitrate and ammonia emissions. The formation of particulates in the Central Valley is NO3−-limited (Kleeman et al 2005), and so a greater proportion of the damages from particulate-related health effects is apportioned to NOx emissions, which are predominantly from mobile sources. The health costs associated with particulate matter from mobile NOx emissions in this study ($22.74/kg N) are greater than the cost for the NOx emissions in the Chesapeake Bay airshed ($15.83/kg N) by almost 50% (Birch et al 2010). The longer atmospheric residence times (up to 12 days versus 5 days in the Chesapeake Bay) within the confined valley may contribute to this difference and demonstrates the geographic specificity of damage costs (Jacob et al 1984, Dickhut et al 2000).
Other important damages not quantified here are those from NOx contribution to ground-level ozone. Prior work in the Chesapeake Bay Airshed suggests this pollutant may cause considerable economic health damage (Birch et al 2010). However, no prior studies calculate the health cost impacts of ozone in the SJV. If annual per-tonne damage values are similar in the two regions, the estimated damages would be ∼$580 million.
Agricultural nonpoint sources are the largest mass flow and the second-largest contributor to economic damages from Nr, although total damages ($1.1 billion) amount to less than half those from fuel combustion and industrial Nr emissions. Crop and animal agriculture contribute approximately equally to damages, although the losses are experienced through different environmental media; atmospheric NH3 volatilization from dairies contributes $490 million yr−1 in damages, while  leaching to groundwater contributes $500 million yr−1.
Nr also causes damages that are not quantified on a per-kg N basis in this study or in other studies, but may represent important economic consequences from Nr. For example, the damages to ecosystem health and recreational activities, as well as some health effects of  contamination of drinking water, have not been estimated on a per kg N basis (Compton et al 2011). We also do not estimate the direct damages or benefits from fertilizer application, which represent the largest flow of Nr in the SJV. This is not because there are no positive or negative outcomes from the application of fertilizer N to cropland. Rather, the negative effects are accounted for when the Nr is transformed and/or transported out of the cropland soils (e.g. N2O fluxes,
  leaching). We did not quantify the significant positive benefits from fertilizer application in terms of the N associated with increased crop production. The loss of value represented by reduced crop yields if N fertilizer were not applied would be offset to an unknown extent by avoidance of the quantified and unquantified economic damages already mentioned.
The largest sink for Nr in SJV is groundwater. Only 10% of Nr inputs to the SJV ultimately flow out in the San Joaquin River (Wickham et al 2008), but this flow represents approximately one-quarter of total Nr load into the San Francisco Bay (California Water Plan Update 2009). Damages to the Bay are likely to be important to regulators. We have not conducted a detailed assessment of them, but if they are comparable on a $/kg Nr basis to those estimated for the Chesapeake Bay, the cost would be $230 million yr−1 (Birch et al 2010). These costs are still dwarfed by those from atmospheric Nr flows. Hence, our qualitative conclusions are unaffected by restricting our geographic scope to the SJV and its residents.
Finally, it is not straightforward to quantify certain types of economic damages like biodiversity loss associated with increased Nr or degraded quality-of-life associated with living in a region of high Nr concentrations. Some of these qualitative impacts can be examined through imperfect indirect means like avoidance costs. The health impacts of  contamination in drinking water provide a good example, with some households buying drinking water instead of using their wells (Moore and Matalon 2011). The damages from some other flows, such as the impacts to crop and forest growth patterns from Nr saturation of soils or ecosystem-specific effects of NHx deposition, may be quantifiable with further research.
3.3. Comparison of mass flows and economic damages and mitigation costs
The relative magnitude of economic damages from individual flows differs significantly from the mass flows. Figure 4(a) illustrates the mass-to-damage ratio for different Nr flows, defined as the ratio of Nr emissions (in tonnes N yr−1) to economic damages (in dollars tonne N−1). Variations in the mass-to-damage ratio arise from a variety of causes. As Nr cascades from its source through different chemical species and media, the various forms of Nr interact differently with humans and the environment. Some of these interactions are more damaging than others (or in some cases estimates of the damages are more readily available than others), leading to large differences in per-kg and overall damage costs for different flows. The costs and benefits from abating various Nr flows also vary widely by source (figure 4(b)). Some flows (such as volatilization from dairies; Webb et al 2005) are inexpensive to abate relative to their damage costs, providing cost-effective abatement opportunities.
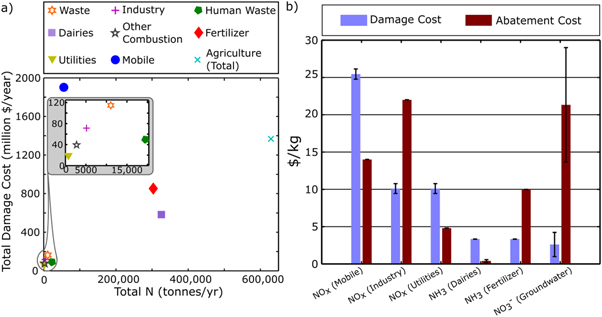
Figure 4. Comparisons of multiple metrics. (a) Quantified damage costs (including health impacts) relative to emissions by source of nitrogen (N). Waste denotes waste disposal facilities other than wastewater treatment plants (e.g., landfills and incineration facilities). The categories of industry, utilities, and other combustion were taken from the EPA's 2008 National Emissions Inventory data. Agriculture (total) is the sum of the dairies and fertilizer points. (b) The per-kg N damage and abatement costs for selected flows.
Download figure:
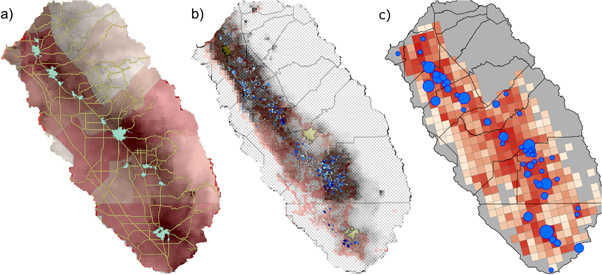
Standard image High-resolution imageThe fact that health costs comprise the bulk of economic damages from Nr means that the consequences of Nr flows are geographically localized around more densely populated areas. Society might prefer to use morbidity and mortality data as a basis for mitigation decision-making, but we have embedded the health costs within total economic damage. Figure 5 demonstrates the extent of the localization of both mass and damage flows in the SJV by examining the flows associated with the two major sources of damage in the study area: mobile sources and agriculture. NOx emissions and deposition (figure 5(a)) are localized in the immediate vicinity of the major metropolitan areas of the SJV and the highways that connect them (primarily the Rt. 99 corridor). This is in part due to the enclosed nature of the airshed. Deposition within the study area occurs in both dry and wet forms (Fenn et al 2011). However, dry deposition dominates, representing 77% of overall deposition (75% of deposition of oxidized N species and 81% of NHx deposition). Oxidized Nr and NHx deposition is localized in areas of dairy production and agriculture, as the major source of atmospheric NHx is from volatilization of livestock waste.
Figure 5. Spatial relationships between emissions, deposition, and damages. (a) Oxidized N (OxN) deposition. Grayscale raster shows intensity of OxN deposition. Counties are shaded by mobile NOx emissions (palest = <1500 tonnes yr−1, darkest = >15 000 tonnes yr−1). (b) NHx deposition and Nr flows to groundwater. Grayscale raster shows intensity of NHx deposition, which tracks with the location of dairy farms (blue dots). Flow of Nr (kg yr−1) to water from agricultural land is shown in red (palest = <0.1 tonnes yr−1, darkest = >370 tonnes yr−1). (c) Consequences of Nr to human residents. Color raster (palest = <$2000, darkest = >$200 million on a per-parcel basis) shows the total value of the air quality health impacts from Nr calculated using BenMap (see SD). Blue circles identify towns that have submitted requests for funding under the Safe Drinking Water Act to address  concerns (smallest = $10 000; largest = $80 million).
Download figure:
Standard image High-resolution image
These same areas are the major source of flows to groundwater in the form of leachate and runoff from fertilizer applied to cropland (figure 5(b)). Indeed, funding requests to support safe drinking water are largely co-located with the areas that suffer the greatest health impacts from Nr released to the air (figure 5(c)). Overall, 43% of California's NO3−-related requests for funding under the Safe Drinking Water Act originated from the SJV (California Environmental Protection Agency State Water Resources Control Board 2014), which contains only 10% of the state's population. The municipalities requesting this funding range in size from major cities like Fresno (>500 000 inhabitants) to small towns like Wofford Place (population 2200). This illustrates the distribution of costs and benefits along the food supply chain: the SJV and its inhabitants (human and otherwise) experience concentrated damages where intense agricultural production occurs while many of the benefits of the low cost food produced are enjoyed elsewhere. These effects are likely to have been significantly exacerbated by the recent drought conditions in the region by increasing the concentration of various forms of Nr in surface and groundwater.
4. Discussion
Because biogeochemical and socio-economic systems do not operate in isolation from one another, the complexity of policy solutions that address society's diverse objectives must be compatible with the complexity of the problem. The SJV demonstrates the local consequences of extreme Nr loading of the natural and human environment far beyond the 'safe operating limit' of the globally averaged planetary boundary. Our work complements the planetary boundaries or safe operating space framework (Steffen et al 2015) by identifying the relative health and environmental damage caused by the different forms and sources of Nr in a specific high-nitrogen region.
This point can be seen most clearly by comparing the Nr management recommendations that may arise under the mass flow approaches to those that follow from the multiple metrics approach. On a mass flow basis, agriculture represents the single largest source of Nr. Nearly 50% of the Nr intensity in the SJV arises from crop fixation (table 1), and agriculture contributes more Nr to the atmosphere and water systems than all other sources combined. Any policy measure aimed at reducing Nr intensity would necessarily focus on agriculture. Yet, current policy infrastructure is not well suited to achieving the drastic Nr reductions that non-point source agricultural mass flow actions would require. Atmospheric and aquatic nonpoint source Nr emissions from agriculture remain outside the scope of federal environmental regulation (except for confined livestock operations subject to National Pollutant Discharge Elimination System permitting).
Voluntary conservation programs remain as options for engaging agricultural Nr sources in abatement in the absence of binding regulations. However, these programs are expensive. Market-based policy instruments (i.e., pollution permit trading and offset markets) are more cost-effective, but decades of experience calls into question the viability of markets for managing certain Nr flows—especially those to aquatic systems (Wainger and Shortle 2013). In any case, agricultural nonpoint source Nr emissions are also some of the costliest flows per tonne to mitigate once Nr has entered a groundwater sink (figure 4(b)). Technology based removal costs outweigh damages many times over. There may be soil management, irrigation strategies and artificial wetlands and tree lines that can reduce the Nr flows (EPA Science Advisory Board 2011). Policies that provide incentives or regulatory requirements would need to be introduced to implement these practices.
Since nitrate contamination of groundwater causes quality of life damage to the residents of the SJV, alternative strategies aimed at preventing nitrate flow to groundwater may be an appropriate place to begin (Harter and Lund 2012). For example, this could be accomplished via information campaigns or extension efforts. These 'suggestive efforts' would be strengthened by a 'reactive nitrogen tax' on fertilizer or payments for specific reductions in nitrogen fertilizer use geared towards more efficient N fertilizer use by row crop farmers in the SJV. This would simultaneously reduce nitrate leaching and reduce farm input costs (Kanter et al 2013). The size of a tax could be determined relative to the economic damages and health care and mitigation costs that have been quantified in this research.
The multiple metrics approach identifies mobile source emissions of Nr as causing the greatest economic damage in SJV through adverse health impacts. Since health quality is highly valued by society, there are both economic and societal reasons to prioritize reducing NOx. Furthermore, whereas agriculture is characterized by large abatement costs and a dearth of effective policy tools to incentivize mitigation, mobile Nr emissions abatement costs are only half as much as the damage costs caused by their release into the environment (figure 3(b)). Furthermore, existing regulations are well equipped to regulate mobile source emissions. For example, the Clean Air Act of 1970 specifically targeted NOx emissions from automobiles. These standards have been tightened several times throughout the law's history, and Nr emissions from other mobile sources (including heavy-duty automotive engines, diesel locomotives, marine diesel engines, and commercial aircraft) have since been brought under the law's purview. As standards have tightened technology advances have kept the costs of NOx abatement within acceptable levels.
The large discrepancy among mass flows of Nr, the relative damage costs of different chemical forms of Nr, and the cost of mitigation provides a quantitative means for designing polices and measures for managing them. This should assist regulators and policy makers in setting priorities and justifying them to the public and the industries that will be regulated. But the actual Nr management choices will ultimately be determined by how much society values the benefits of each form of Nr or the process that produces it, and how it values human health or qualitative metrics like biodiversity or amenity values—and the political process for introducing those choices into the management process.
Tracking mass flows of Nr is essential for setting standards and directly measuring progress towards policy goals, but used alone does not capture the relative consequences of multiple chemical forms as Nr cascades through air, land and water. For example, water quality is determined not only by agricultural runoff, but also by deposition onto land and water of emissions from vehicles and stationary sources. This suggests a more integrated approach between the Clean Air Act and the Clean Water Act to achieve the most effective management at the lowest cost to society. The planetary boundaries concept provides a scale factor for understanding the relationship between human activities and global ecosystem functioning, but is less useful in setting specific policies at a regional or local level. The use of multiple metrics permits a more comprehensive assessment of how society and the economy can potentially balance the substantial benefits of mobility and increased agricultural production in this highly productive and economically important region while reducing the heavy N footprint and its cascading environmental and health damages.
Acknowledgments
The David and Lucile Packard Foundation supported this research with a grant to The Center for International Environment and Resource Policy at The Fletcher School, Tufts University and separately supported the development of many of the datasets used in this analysis as part of the California Nitrogen Assessment. The Netherlands Ministry of Economic Affairs and the US Department of Agriculture National Institute of Food and Agriculture (NIFA) Hatch multi-state project W-3133, and the Global Development and Environment Institute, Tufts University also provided support for the development of this research. All findings are the authors' alone and do not necessarily reflect the views of the organizations, states and/or agencies whose funding made this research possible.