

Abstract
Interventions to mitigate household air pollution (HAP) from cooking with solid fuels often fail to take into account the role of access to freely available woodfuels in determining fuel choice and willingness to adopt clean cooking technologies, key factors in mitigating the burden of HAP. We use national-scale remote sensing data on land use land cover change, and population representative data from two waves of the Malawi Living Standards Measurement Survey to explore the relationship between land use change and the type of fuel households use, time spent collecting fuel, and expenditures on fuel, hypothesizing that land use dynamics influence household-level choice of primary cooking fuel. We find considerable heterogeneity with respect to regeneration and deforestation/degradation dynamics and evidence of spatial clustering. We find that regeneration of forests and woodlands increases the share of households that collect fuelwood, whereas deforestation and degradation lead households to purchase fuelwood. We also find that a relatively large share of land under woody savannah or degraded forest (versus fully stocked forest) increases fuel collection time. Areas with regeneration happening at broader scale experience increases in fuel expenditures. Our findings have implications for the spatial targeting of interventions designed to mitigate HAP.
Export citation and abstract BibTeX RIS

Original content from this work may be used under the terms of the Creative Commons Attribution 3.0 licence. Any further distribution of this work must maintain attribution to the author(s) and the title of the work, journal citation and DOI.
Introduction
Recent research on the health and climate change impacts of household air pollution (HAP) has brought renewed attention to the welfare implications of widespread use of biomass fuels and traditional stoves for cooking and heating in developing countries. HAP is now considered to be a major threat to global health (Lim et al 2012), affecting roughly three billion people worldwide (World Health Organization (WHO) 2014). At the same time, HAP has garnered attention as a harbinger of black carbon, which is a known contributor to regional climate change (Ramanathan and Carmichael 2008). Women and children bear most of the direct impacts of reliance on biomass fuels and traditional technologies; they are generally tasked with collection of fuelwood, and cooking for the family (Foell et al 2011). Policies and interventions designed to reduce HAP have the potential to offer triple-win outcomes of improving health and welfare for households in developing countries, and mitigating regional climate change.
Throughout much of sub-Saharan Africa (SSA), use of traditional fuels and cooking technologies persist due to slow development of markets for modern fuels and clean cookstoves, and lack of information about the individual and social benefits of switching stoves and fuels (Masera et al 2000, Schlag and Zuzarte 2008, Bailis et al 2015). With a variety of biomass fuels available (e.g. fuelwood, charcoal, crop residues, and dung), few studies have explored supply side factors affecting fuel choice (c.f. Rehfuess et al 2010, Lewis and Pattanayak 2012, Jagger and Shively 2014). GEA (2012) and UN DESA (United Nations, Department of Economic and Social Affairs, Population Division) (2015) estimate that the absolute number of people in SSA dependent on biomass fuels will increase through 2030, suggesting that policy makers should be attentive to factors that influence the supply, demand, and distribution of biomass fuels. Several studies have noted the lack of information available about fuelwood harvesting practices, geography, and dynamics, specifically with respect to woody biomass availability within different land uses (Foley et al 2005, Smeets and Faaij 2007, Hiemstra-van der Horst and Hovorka 2009). While demand for biomass fuel grows in SSA, rapid land use change is reducing the supply of high quality biomass and leading individuals to shift collection away from forests toward locations such as farms and fields that typically yield much lower per hectare quantities of biomass (Ahrends et al 2010, DeFries et al 2010, Jagger and Shively 2014). Changes in the supply of locally available biomass fuels have implications for household fuel use and the exposure of women and children to harmful gasses and particulate matter associated with the incomplete combustion of low-quality biomass (Jagger and Shively 2014, Das et al 2016). Insights into the combined spatial and behavioral dynamics of woodfuel supply and demand are needed (Masera et al 2006, Rehfuess et al 2010).
Malawi is a country deeply affected by the health, climate and socioeconomic impacts of HAP. HAP is that nation's largest risk factor for morbidity and mortality (Institute for Health Metrics and Evaluation (IHME) 2013), and Malawi is among the countries in SSA most vulnerable to climate change (Knox et al 2012, López-Carr et al 2014). In rural areas women and children are overwhelmingly responsible for fuelwood collection, and do almost all of the cooking (Jagger and Jumbe 2016). The confluence of the negative impacts of HAP have catalyzed the Government of Malawi to foster innovative and scalable interventions that reduce HAP. Improved cookstoves have taken center stage in this new policy dialogue as one of the most promising strategies. In January 2013, the Government of Malawi launched an initiative in partnership with USAID, Irish Aid, and Concern Universal to get two million improved cookstoves into Malawian households by 2020, suggesting that roughly half of Malawi's households would adopt improved cookstoves within the next five years. A National Cookstove Steering Committee has been formed to provide strategic inter-sectoral advice on how to proceed with a large-scale roll-out of improved cookstoves. In 2016 the Government of Malawi piloted coupling a voucher for an improved cookstove with its' Social Cash Transfer Program improving access to improved cookstoves for the 10% most vulnerable households. The program is currently being rolled out in eight districts in southern Malawi. Additionally, values chains and markets for improved cookstoves are being fostered by Concern Universal, Maeve, Total Landcare and other non-governmental organizations, with the aim of providing a diverse and robust market for improved cookstoves for Malawian consumers. Stoves are being promoted on the premise of reduced fuel consumption and co-benefits for health, welfare, and climate. In the targeting of such programs supply side factors for biomass fuels are seldom taken into account, and could be important factors determining their success.
This study integrates remote sensing and household-level data at the national scale to explore how land use and land use change are correlated with the main type of fuel used by households, time spent on collecting fuel, and cash expenditures on fuel in Malawi. Our hypothesis is that the types of fuels households use, and how much time and money they expend to obtain fuel are spatially determined. We pursue this line of inquiry with the aim of providing input to Malawi's national policy process focused on promoting improved cookstoves. Specifically we explore whether there is a correlation between land use change and the primary type of fuel used by households. We also consider the effect of land use change on time and money spent collecting fuel. We use this information to identify areas where cleaner cooking interventions are more likely to be successful, that is, geographic locations where there are dynamics in land use and fuel markets, and where households are most strikingly affected by increases in time and expenditures related to reliance on biomass fuels. Our expectation is that with better informed targeting of interventions, the health, climate and welfare effects of interventions aimed at mitigating HAP will be more efficiently and effectively realized.
Methods
Data
Study population
Our analysis involves the integration of nationally representative spatially identified socioeconomic data on fuel use, and remotely sensed land use land cover change data. We use data from the Malawi Integrated Household Survey (IHS), IHS2 collected in 2004, and IHS3 collected in 2010, to characterize the primary fuels used by households, time to collect fuel, and household expenditures on fuel. IHS2/IHS3 are nationally representative household surveys that provide data for a wide range of monitoring and impact evaluation indicators in the areas of development, health, education, access to public services, etc. Data are coded at the household level. The 2004 data come from 11 280 households, in 564 enumeration areas spread over 27 districts and 4 urban areas in Malawi. The data for IHS3 come from 12 288 households falling within 768 enumeration areas, covering the same districts. Enumeration area centroids (i.e., geographic positioning system (GPS) coordinates for the randomly offset center point in each enumeration area) are provided for the dataset. Households that failed to provide survey data on primary fuel type, fuel expenditures, or collection time were excluded from the analysis. The sample for this study includes a total of 9211 and 9914 households from 531 and 717 enumeration areas in 2004 and 2010, respectively. Outcome data on primary cooking fuel type at the household level were aggregated to enumeration area-level counts for each fuel type. Likewise, household-level data on fuel expenditures and collection time were also aggregated to the enumeration area-level using median values from households within enumeration areas.
Land cover dynamics
To characterize land cover and land cover change we use land cover type grids from the MODIS-MCD12Q1 product due to its potential for the rapid assessment of land cover change, free availability, and performance at 500 m resolution. Vintrou et al (2012) found the MCD12Q1 land cover product achieved higher accuracy in mapping cropland compared with alternative existing global land products (GLC2000 Africa, GLOBCOVER, and ECOCLIMAP-II). Friedl et al (2010) detail the decision-tree algorithm model employed to classify land cover types and cross-validation analysis for accuracy on a yearly scale. The land cover product provides data that aggregate 8 d values with 32 d averages and use a weighted averaging procedure for quality assurance. This alleviates concern for seasonal variation bias in the data, though savanna and woody savanna lands are found to be less accurate than the forest and cropland identifications.
After extracting land cover type data from MODIS land cover type grids at 500 m spatial resolution (MCD12Q1 product), we reclassified the International Geosphere Biosphere Programme (IGBP) classifications into seven broader categories to reduce uncertainty. Thus, we regrouped the classifications into forest, woody savannah, savannah, shrubland, grassland, cropland, and urban/built-up. Each classification denotes a varied amount of biomass availability for household fuel use. Through cross-validation analysis, overall classification accuracy in the MCD12Q1 product is estimated to be 75% (Friedl et al 2010).
We defined transition classes using raster algebra where a pixel of land that changed usage categories from year t-1 to year t would join a newly created land cover class; i.e., 'Forest → Cropland' identifies cropland that had been converted from forest. These transitions were created to measure deforestation (e.g., Woody Savanna → Cropland) and forest degradation (e.g., Forest → Woody Savanna), and to distinguish them from areas of limited or no change. Our analysis considered relative changes in land cover type within the dataset for accuracy and to avoid classification errors (Pfeifer et al 2012). Land cover change was then reclassified as either reflecting regeneration of woody biomass or deforestation/degradation. Specifically, the following land cover change types were classified as deforestation/degradation: forest to woody savanna, woody savanna to savanna, woody savanna to cropland, and savanna to cropland. Conversely, the following land cover changes were classified as regeneration: savanna to woody savanna, cropland to woody savanna, and other to savanna. In addition to calculating percent land cover change (i.e., regeneration/degradation) of surrounding 10 km areas, we also calculated spatially lagged variables for regeneration and degradation as an average of land cover changes in neighboring IHS clusters within 50 km of focal cluster locations. This lagged variable captures changes in land cover in surrounding areas.
Covariates
We include a number of exogenous variables in our models to control for variation in population density, market access and baseline land cover conditions in our models. Data corresponding to population density were extracted from 2005 and 2010 AfriPop datasets using 10 km buffer means surrounding IHS cluster points (www.worldpop.org.uk/). Previous work has demonstrated that 10 km buffer means provide unbiased estimates of raster-based covariates for randomly displaced household cluster points from Demographic and Health Surveys (Perez-Heydrich et al 2016). Given that the IHS2/3 GPS data followed a displacement scheme similar to the DHS, the 10 km buffer size was deemed appropriate to minimize displacement bias in raster-based covariate definitions for the IHS data. Market access was defined as the shortest distance (km) from an IHS cluster to the nearest city along major roads, and was calculated using the gdistance and fields packages in R (Nychka et al 2014, van Etten 2014). The roads shapefile used for these calculations was obtained from DIVA-GIS (www.diva-gis.org/). Code for the construction of the market access variable is available upon request. We also use data on rural/urban status and percent of households below the poverty line. These data are derived from the IHS2/3 datasets. Because our study involves human subjects this research was reviewed and approved by the Institutional Review Board at the University of North Carolina at Chapel Hill. We have a data use agreement with the National Statistical Office of Malawi.
Analysis
Poisson regression models were initially fit to the data to address the association between different types of land cover change and use of a particular fuel type. Specifically, counts of households within IHS clusters for which (1) collected firewood, (2) purchased firewood, (3) charcoal, (4) modern fuels, and (5) other fuels were considered as primary cooking fuel sources were used as dependent variables in regression models that controlled for urban/rural designation, percent poor, year (2004 or 2010), market access, population density, and baseline forest and woody savanna cover. Linear regression models using the above predictors and log-transformed collection time and fuel expenditures were also fit. In addition to traditional diagnostic measures, residuals from the above models were tested for the presence of spatial autocorrelation via Moran's I tests. All regressions were associated with significant spatial autocorrelation in residuals (p < 0.05). To investigate the nature of the observed spatial dependence in residuals, geographically weighted regressions (GWRs; Fotheringham et al 2002) were fit to the residuals assuming a fixed bandwidth and a Gaussian kernel. Bandwidths were optimized for each of the seven models considered (one for each of the primary fuel types, one for collection time, and one for fuel expenditures) by minimizing the values of the root mean square prediction error. Specific bandwidths used for the five models in the order listed above were 7.81, 301, 8.22, 911, 36.6, 13.3, and 911 km.
Descriptive maps of residuals indicated the potential for district-specific effects of land cover change on primary fuel source. Informed by the exploratory GWR results (not shown), mixed effects models with random intercepts for each district were then fit to the data. Because collected firewood was overwhelmingly the most dominant fuel type used by households, counts of households using fuel types other than collected firewood were zero-inflated. Mixed zero-inflated Poisson (ZIP) regression models were fit using the aforementioned variables, but now incorporated random intercepts associated with each of the 26 districts and 4 urban areas. Mixed Poisson and ZIP models were fit using the admbglmm package in R (Fournier et al 2012, Skaug et al 2014) for the primary fuel outcomes. High posterior density intervals for parameter estimates were calculated using a Markov Chain Monte Carlo approach. Mixed linear regressions were fit using the lme4 package in R (Bates et al 2013) for outcome data corresponding to log-transformed collection time and fuel expenditures, respectively. Analyses corresponding to collection time were limited to clusters in which at least one household reported using collected firewood as a primary fuel source. Similarly, analyses of fuel expenditures were restricted to clusters containing households that reported spending any money on fuel. Ninety-five percent confidence intervals were calculated for fixed effects parameters using a profile likelihood approach.
Results
A total of 9211 and 9914 households located within 26 districts and 4 urban areas from the IHS2 (2004) and IHS3 (2010) respectively were included in the analysis. For both years, approximately 4% of households were from urban areas, while 96% were from rural areas. Collected firewood was the dominant source of cooking fuel in both years, with 91% of households in 2004, and 94% of households in 2010 declaring it as their primary fuel (table 1). This was followed by purchased firewood, which decreased from 7% to 5% between 2004 and 2010, and charcoal, which increased from 0.2% to 0.9% between 2004 and 2010 (figure 1; table A1). The other fuels category is dominated by crop residues (primarily maize cobs), which are seasonal, while overall use of other fuels did not increase, we do observe increases in the other fuels category in places with biomass scarcity, particularly in the Southern Region (Openshaw 2010). The average time household members over the age of five spent collecting firewood was 0.59 h per day (95% CI: 0.58–0.61) in 2004 and 0.82 h per day (95% CI: 0.80–0.84) in 2010. For those who purchased fuel, average household expenditures on fuel were 318 Malawian Kwacha (MK) per week (95% CI: 311–326) in 2004 and 463 MK per week (95% CI: 435–493) in 2010 (figure 2; table A1). These expenditures are roughly equivalent to 0.75 cents to 1$US per week.
Table 1. Primary fuel type used corresponds to percentages (95% CI); values associated with fuel expenditure and collection time correspond to means (95% CI).
| Full sample | Rural | Urban | ||||
|---|---|---|---|---|---|---|
| 2004 | 2010 | 2004 | 2010 | 2004 | 2010 | |
| Collected firewood | 91.4 | 93.5 | 92.4 | 94.5 | 63.8 | 64.6 |
| (90.8, 91.9) | (93, 94) | (91.8, 92.9) | (94, 94.9) | (58.5, 69) | (59.4, 69.8) | |
| Purchased firewood | 7.4 | 4.7 | 6.5 | 4 | 31.6 | 25.2 |
| (6.8, 7.9) | (4.3, 5.1) | (6, 7) | (3.6, 4.4) | (26.5, 36.6) | (20.4, 29.9) | |
| Charcoal | 0.2 | 0.9 | 0.1 | 0.6 | 2.8 | 8.4 |
| (0.1, 0.3) | (0.7, 1.1) | (0, 0.2) | (0.5, 0.8) | (1, 4.6) | (5.4, 11.4) | |
| Modern fuels/other | 1.1 | 0.9 | 1.1 | 0.9 | 1.8 | 1.8 |
| (0.02, 1.2) | (0.6, 1) | (0, 1.2) | (0, 1) | (1, 2) | (0, 2.5) | |
| Collection time (hours/day) | 0.59 | 0.82 | 0.59 | 0.81 | 0.69 | 1.23 |
| (0.58, 0.61) | (0.8, 0.85) | (0.57, 0.6) | (0.79, 0.83) | (0.59, 0.8) | (1.03, 1.42) | |
| Fuel expenditure (MK) | 318 | 463 | 318 | 462 | 319 | 486 |
| (312, 324) | (453, 472) | (312, 324) | (453 472) | (290, 348) | (433, 540) | |
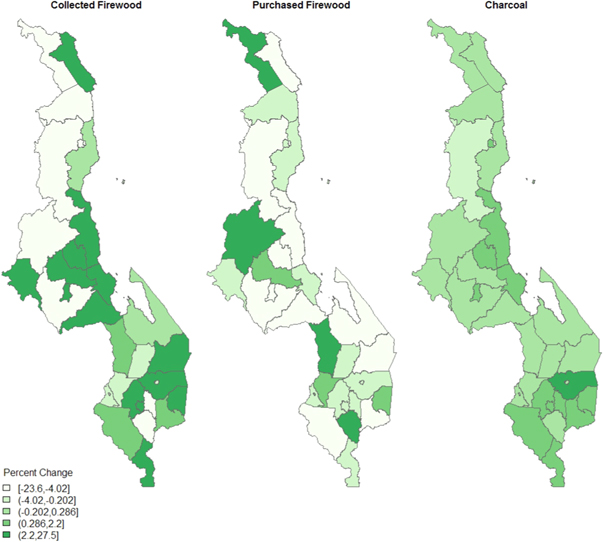
Figure 1. Percent change in household use of fuel by district 2004–2010.
Download figure:
Standard image High-resolution image
Figure 2. Median collection time and fuel expenditures per household by district.
Download figure:
Standard image High-resolution imageWe also decompose the data by rural and urban samples with the aim of highlighting divergent trends in fuel use across the two samples (table 1). Overall we note modest declines in purchased firewood and corresponding increases in charcoal use in urban settings. While collected firewood increased in rural areas from 91% to 94%, it remained constant in urban areas. Trends in fuel collection time and fuel expenditure were similar for both rural and urban households.
Changes in fuel-related activities
We find that several districts, largely in the Southern and Central Regions, experienced an increase in collected firewood as the primary fuel source between 2004 and 2010 (figure 1). Changes in the use of purchased firewood also increased in several areas throughout Malawi. Use of charcoal as primary fuel increased mainly in the lakeshore region including Nkohotakota, Ntchisi, and Salima Districts, and in the southern region in Zomba District. Fuel collection times were highest in Mzimba and Rhumpi Districts in the northern region, and in several population dense districts in southern Malawi, particularly in 2010 (figure 2). High fuel expenditures were observed throughout the country in both time periods and are generally clustered around major urban centers including Mzuzu, Lilongwe, Blantyre, and Zomba.
Land cover dynamics
We analyze land use and land use change for two time periods: 2001–2004 and 2004–2010 within 10 km buffers of Enumeration Area centroids. In both time periods a significant share, approximately 63%, of land in Malawi remained under the same land use classification (for example, from 2001 to 2004 and 2004 to 2010, 32% and 40% of land cover remained as savanna, respectively) (figure 3). Deforestation or degradation processes, as we define them, accounted for 17% of land use change between 2001 and 2004, and increased significantly to 27% between 2004 and 2010. Conversely, land use changes signifying regeneration accounted for 18.7% and 8% respectively in the two time periods within 10 km buffers (figure 3; table A2).
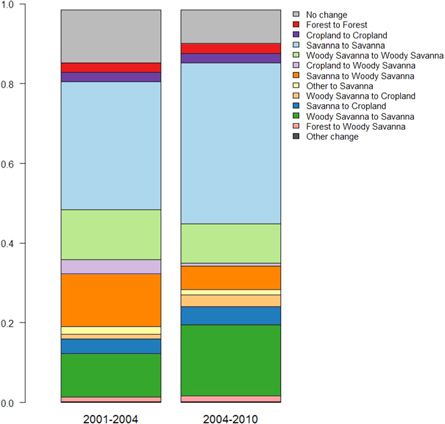
Figure 3. Changes to land cover in Malawi between 2001–2004 and 2004–2010. Barplots demonstrate the overall proportions of different land use and land cover changes considered when evaluating the effects of land cover change of primary fuel type used within households.
Download figure:
Standard image High-resolution imageSpatial patterns of land cover dynamics
Figure 4 illustrates spatial patterns of regeneration and deforestation/degradation. While the 2001–2004 time period indicates clusters of regeneration in each of the three major regions, regeneration is most pronounced in the northern region between 2004 and 2010. Deforestation/degradation is similarly more evenly dispersed in the earlier time period, and more heavily concentrated in the southern and central regions between 2004 and 2010. To further explore regional patterns we tested for spatial autocorrelation between districts by aggregating land cover change data from the Enumeration Area to the district level. Significant clusters, after correcting for multiple comparisons using the false discovery rate approach (Benjamini and Hochberg 1995), are highlighted in figure A1. We find evidence of spatial autocorrelation (i.e., neighboring administrative units exhibited similarly high values of land cover change) for regeneration in the northern region in the 2004–2010 time period.
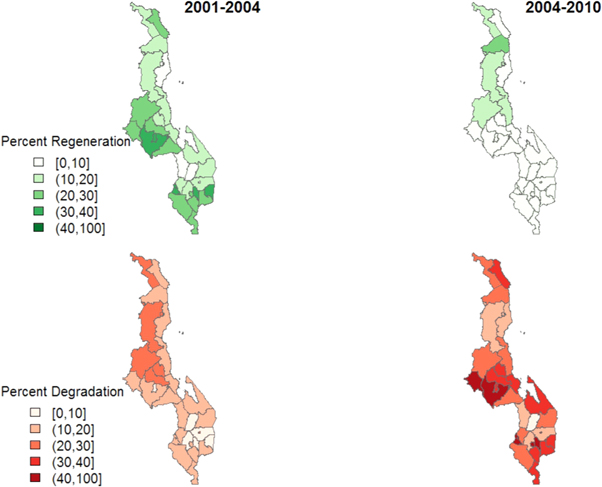
Figure 4. Land cover changes associated with regeneration and degradation 2001–2004 and 2004–2010.
Download figure:
Standard image High-resolution imageAssociation between land cover dynamics and fuel-related activities
We report results of mixed regression models addressing use of collected firewood and purchased firewood rather than addressing use of charcoal, modern fuels, or other fuels because of the infrequency with which the latter three were used as the primary fuel in the household (<1.0%) (figure 5). Biomass regeneration within 10 km increased the odds of using collected firewood (OR: 1.3%, 95% CI: 0.98–1.7) as a primary cooking fuel source, and significantly decreased the odds of using purchased firewood (OR: 0.11%, 95% CI: 0.05–0.24). Regeneration was associated with significant decreases in collection time (percent change: −51.4, 95% CI: −74.2 to −7.8), and slight decreases in fuel expenditures (percent change: −2.6%, 95% CI: −34.2 to 44.6). Regeneration within more distantly surrounding areas was not associated with a significant change in the odds of using collected firewood (OR: 1.04%, 95% CI: 0.7–1.77), using purchased firewood (OR: 0.41%, 95% CI: 0.06–1.9), or collection time (percent change: −45.9%, 95% CI: −84.9 to 88.0). The percent change in fuel expenditure, however, significantly increased with higher levels of regeneration in distantly surrounding areas (percent change: 205.4%, 95% CI: 38.6 to 578.8).

Figure 5. Association between land cover change and fuel-related variables. Odds ratios and 95% highest posterior density intervals are presented for parameter estimates associated with mixed ZIP models for fuel type outcomes (i.e., counts of households using collected firewood, and purchased firewood as primary cooking fuel sources). Results for linear mixed models, which use log-transformed collection time and firewood cost as the outcomes of interest, are presented as percent change in the outcome attributable to each variable ( Ninety-five percent confidence intervals are presented as line segments in corresponding plots. Dashed lines in all plots represent null values that indicate no association between predictor variables and corresponding outcomes.
Download figure:
Standard image High-resolution imageDeforestation/degradation within 10 km did not significantly affect the odds of using collected firewood (OR: 0.92%, 95% CI: 0.77–1.13), but did significantly increase the odds of using purchased firewood (OR: 2.25%, 95% CI: 1.25–6.64). Deforestation/degradation was also not associated with changes in collection time (percent change: −17.9.0%, 95% CI: −50.0 to 35.6), but was associated with marginally significant decreases in fuel expenditures (percent change: −23.7%, 95% CI: −44.0 to 4.0). We disaggregated deforestation and degradation (results not reported) to explore their independent effects on fuel choice and collection time, and found that degradation decreased collection time (percent change: −28.6%, 95% CI: −60.8 to 30.0), but deforestation increased collection time (percent change: 33.1%, 95% CI: −45.3 to 225.9). Deforestation/degradation in more distant surrounding areas was associated with slightly increased odds of using collected firewood (OR: 1.41%, 95% CI: 0.91–1.93), significantly decreased odds of using purchased firewood (OR: 0.05%, 95% CI: 0.01–0.13), significantly decreased collection time (percent change: −71.8%, 95% CI: −89.7 to −24.6), and increased fuel expenditures (percent change: 84.2%, 95% CI: −2.0 to 249.7). Results are further summarized in table 2.
Table 2. Summary of results associated with the effects of land cover dynamics on fuel use activities.
| Effect on fuel use activities | ||||
|---|---|---|---|---|
| Land cover change | Use of collected firewood | Collection time | Use of purchased firewood | Fuel expenditure |
| Regeneration within 10 km | Marginally significant increase in odds | Significant decrease | Significant decrease in odds | NSE |
| Regeneration in surrounding 50 km | NSE | NSE | NSE | Significant increase |
| Deforestation/Degradation within 10 km | NSE | NSE | Significant increase in odds | Marginally significant decrease |
| Deforestation/Degradation in surrounding 50 km | NSE | Significant decrease | Significant decrease in odds | Marginally significant increase |
NSE: No significant effect.
Discussion
Our analysis of fuel use confirms that the vast majority of households in Malawi rely on collected fuelwood as their primary fuel, but that modest changes are taking place. The overall decline in purchased fuelwood during the time period of our analysis is unexpected given perceived trends in fuel scarcity. We hypothesized that collected fuelwood would be substituted with purchased fuelwood in areas where deforestation and degradation are taking place. While the decline in purchased fuelwood is partially explained by increases in the use of charcoal and modern fuels, particularly in urban and peri-urban areas, modest gains in use of other fuels do not fully compensate for the decline in purchased fuelwood. We note that our results mask a potential shift towards use of multiple fuels. For example, households may identify collected firewood as their primary fuel, but use crop residues, purchased firewood, and/or charcoal some of the time. The percent change in real price of fuel was 37.1% between 2004 and 2010; households may rely on collected fuelwood as much as possible to reduce the burden of cash expenditures being allocated to domestic household energy. We do observe a correlation between purchased firewood as primary fuel source and whether a district engages in border trade, including Chitipa District (borders Tanzania) in the northern region, Kasungu in the central region (Zambia), and both Ntcheu and Thyolo Districts in the southern region (Mozambique). There may be more developed fuel markets in these parts of the country.
Table A1. District-level percentage of households using each category of fuel as its primary source.
| Collected firewood | Purchased firewood | Charcoal | Modern fuels | Other | Total households | |||||||
|---|---|---|---|---|---|---|---|---|---|---|---|---|
| Urban | 2004 | 2010 | 2004 | 2010 | 2004 | 2010 | 2004 | 2010 | 2004 | 2010 | 2004 | 2010 |
| Blantyre city | 30.8 | 57.1 | 46.2 | 14.3 | 23.1 | 21.4 | 0.0 | 4.8 | 0.0 | 2.4 | 13 | 42 |
| Lilongwe city | 69.7 | 72.5 | 25.0 | 23.5 | 1.3 | 2.0 | 2.0 | 0.0 | 2.0 | 2.0 | 152 | 51 |
| Mzuzu city | 59.6 | 59.8 | 37.6 | 37.4 | 2.8 | 2.8 | 0.0 | 0.0 | 0.0 | 0.0 | 109 | 107 |
| Zomba city | 63.3 | 66.4 | 34.7 | 18.7 | 2.0 | 13.1 | 0.0 | 1.9 | 0.0 | 0.0 | 49 | 107 |
| Rural districts | ||||||||||||
| Northern region | ||||||||||||
| Chitipa | 99.1 | 96.2 | 0.9 | 3.3 | 0.0 | 0.3 | 0.0 | 0.0 | 0.0 | 0.3 | 216 | 365 |
| Karonga | 77.8 | 94.8 | 22.2 | 4.6 | 0.0 | 0.3 | 0.0 | 0.0 | 0.0 | 0.3 | 189 | 346 |
| Mzimba | 97.3 | 98.9 | 2.5 | 1.1 | 0.0 | 0.0 | 0.2 | 0.0 | 0.0 | 0.0 | 474 | 367 |
| Nkhata Bay | 99.6 | 98.6 | 0.0 | 1.1 | 0.0 | 0.3 | 0.4 | 0.0 | 0.0 | 0.0 | 236 | 367 |
| Rumphi | 98.6 | 96.8 | 1.4 | 2.6 | 0.0 | 0.6 | 0.0 | 0.0 | 0.0 | 0.0 | 210 | 340 |
| Central region | ||||||||||||
| Dedza | 88.7 | 94.7 | 9.6 | 3.9 | 0.0 | 0.0 | 0.0 | 0.3 | 1.7 | 1.1 | 406 | 361 |
| Dowa | 93.4 | 95.6 | 2.4 | 4.1 | 0.2 | 0.3 | 0.0 | 0.0 | 3.9 | 0.0 | 410 | 342 |
| Kasungu | 95.7 | 89.8 | 3.6 | 9.7 | 0.0 | 0.3 | 0.0 | 0.3 | 0.7 | 0.0 | 444 | 352 |
| Lilongwe | 89.7 | 91.5 | 8.7 | 8.1 | 0.0 | 0.2 | 0.0 | 0.2 | 1.6 | 0.0 | 860 | 482 |
| Mchinji | 90.5 | 95.3 | 9.5 | 4.7 | 0.0 | 0.0 | 0.0 | 0.0 | 0.0 | 0.0 | 211 | 320 |
| Nkhotakota | 92.5 | 95.2 | 7.5 | 4.2 | 0.0 | 0.3 | 0.0 | 0.0 | 0.0 | 0.3 | 240 | 331 |
| Ntcheu | 91.7 | 95.8 | 8.1 | 3.6 | 0.0 | 0.6 | 0.0 | 0.0 | 0.2 | 0.0 | 432 | 360 |
| Ntchisi | 98.6 | 95.9 | 0.9 | 4.1 | 0.0 | 0.0 | 0.5 | 0.0 | 0.0 | 0.0 | 217 | 365 |
| Salima | 90.7 | 93.3 | 9.3 | 5.8 | 0.0 | 0.3 | 0.0 | 0.0 | 0.0 | 0.6 | 214 | 344 |
| Southern region | ||||||||||||
| Balaka | 95.3 | 97.2 | 4.3 | 2.2 | 0.4 | 0.6 | 0.0 | 0.0 | 0.0 | 0.0 | 235 | 361 |
| Blantyre | 84.9 | 85.6 | 9.8 | 6.3 | 2.9 | 3.1 | 0.5 | 0.0 | 2.0 | 5.0 | 205 | 320 |
| Chikwawa | 91.3 | 95.3 | 8.7 | 3.2 | 0.0 | 1.5 | 0.0 | 0.0 | 0.0 | 0.0 | 437 | 340 |
| Chiradzulu | 92.4 | 76.6 | 7.6 | 8.3 | 0.0 | 1.2 | 0.0 | 0.0 | 0.0 | 13.9 | 236 | 337 |
| Machinga | 87.6 | 95.3 | 11.3 | 2.9 | 0.0 | 1.1 | 0.0 | 0.0 | 1.1 | 0.8 | 442 | 381 |
| Mangochi | 91.2 | 96.0 | 8.4 | 3.7 | 0.0 | 0.3 | 0.3 | 0.0 | 0.0 | 0.0 | 628 | 325 |
| Mulanje | 94.4 | 95.4 | 5.1 | 4.0 | 0.2 | 0.3 | 0.0 | 0.3 | 0.2 | 0.0 | 430 | 349 |
| Mwanza | 94.8 | 98.7 | 5.2 | 0.3 | 0.0 | 1.0 | 0.0 | 0.0 | 0.0 | 0.0 | 97 | 304 |
| Neno | 98.6 | 96.4 | 1.4 | 1.3 | 0.0 | 2.3 | 0.0 | 0.0 | 0.0 | 0.0 | 139 | 386 |
| Nsanje | 89.9 | 94.1 | 9.6 | 4.3 | 0.0 | 1.1 | 0.4 | 0.3 | 0.0 | 0.3 | 228 | 372 |
| Phalombe | 74.5 | 95.8 | 10.2 | 3.7 | 0.0 | 0.6 | 0.0 | 0.0 | 15.3 | 0.0 | 196 | 354 |
| Thyolo | 94.9 | 95.5 | 4.0 | 2.6 | 0.0 | 0.8 | 0.0 | 0.8 | 1.0 | 0.3 | 396 | 379 |
| Zomba | 98.3 | 95.0 | 1.5 | 4.2 | 0.0 | 0.0 | 0.0 | 0.0 | 0.2 | 0.8 | 460 | 357 |
Table A2. Country-level percent change in land cover.
| Land cover change | 2001–2004 | 2004–2010 | |
|---|---|---|---|
| Regeneration | Savanna to Woody Savanna | 13.27 | 5.99 |
| Cropland to Woody Savanna | 3.47 | 0.66 | |
| Other to Savanna | 1.92 | 1.31 | |
| Degradation | Forest to Woody Savanna | 1.16 | 1.52 |
| Woody Savanna to Savanna | 10.91 | 17.88 | |
| Woody Savanna to Cropland | 1.16 | 2.83 | |
| Savanna to Cropland | 3.73 | 4.58 | |
| Other change | 1.74 | 1.71 | |
| No change | 62.65 | 63.5 | |
We find evidence of significant land use change with approximately 37% of land within 10 km buffers undergoing either regeneration or deforestation/degradation processes in each time period we consider. Our analysis suggests considerable heterogeneity of land use change at national scale, with surprisingly few spatially clustered districts characterized by high deforestation/degradation. We do find that deforestation and degradation processes are most pronounced in the Central and Southern Regions between 2004 and 2010 implying declining supply of above ground biomass. We also observe that deforestation/degradation processes appear to be accelerating. Somewhat unexpectedly given current narratives of land use change in Malawi we observe regeneration of forest and woody savanna in Northern Malawi. Our methodology and results correspond with other land cover change analysis of East Africa that found areal increases in savannah and woodlands in Malawi and observed a net carbon increase from 2002 to 2008 (Pfeifer et al 2012). The study found gains in biomass stock for savanna and woody savanna, especially in northern Malawi. The areal increase in savanna and woodlands offset the carbon emissions from forest loss for Malawi in particular, representing a unique carbon sink among sources in East Africa, and partially explaining the surprising result of increased biomass. Pfeifer et al (2012) also cite the prevalence of large areas of planted forest in Malawi to account for the changes.
To put the implications of observed land use change data and its' relationship to biomass availability in context we leverage analysis from the National Biomass Study in Uganda (no such study exists for Malawi). On a per hectare basis, tropical high forest provides the highest density of available woody biomass (224 tons ha−1). Degraded tropical high forest provides approximately half the per hectare woody biomass (113.0 tons ha−1), savanna is estimated at 29.9 tons per hectare of biomass, and subsistence crop land provides only 12.7 tons ha−1 (Turyareeba et al 2001). Land use change from woody savanna to subsistence cropland results in an order of magnitude reduction in above ground biomass.
We explore land use change as a potential determinant of primary fuel use testing the hypothesis that household-level decisions about fuel use are driven, at least in part, by supply side factors. Our results indicate a clear relationship between regeneration of biomass and fuel choice with two implications. The first is that areas with significant regeneration taking place may be poor locations to target fuel saving interventions. Improved cookstove interventions are most successful when the time use or monetary costs of fuel acquisition are reduced through the use of more efficient technologies. If firewood is easily obtained at little or no marginal cost to the household it may be challenging to motivate behavior change. When households feel burdened by the time involved in collecting fuel, or are experiencing longer collection times, willingness to adopt improved cookstoves may be higher (e.g., Jagger and Jumbe 2016). The second and related implication is that there is a potential paradox between relaxing financial and labor constraints for households via afforestation/reforestation initiatives and willingness to adopt technologies that mitigate health and climate impacts. Afforestation/reforestation activities that focus on biomass supply for fuelwood have long been promoted as a strategy for alleviating the economic burden of reliance on fuelwood. We caution that environmental policy that promotes afforestation/reforestation programs may have the unintended consequence of hindering adoption of modern fuels and improved technologies (assuming they are available), constraining the realization of collective benefits for climate and environment at multiple scales.
Our results for land use change reflecting deforestation/degradation and its relationship to fuel use yield less clear patterns. The ubiquity of collected fuelwood as the primary fuel source, financial constraints for poor households, and weak or missing markets for fuelwood may be influencing our results. Given high levels of poverty in Malawi, households may simply have no choice other than to collect fuelwood even in the face of deforestation/degradation. Purchasing fuelwood may be considered a luxury, particularly for households that do not face labor constraints with respect to time spent on fuel collection. In each of our models market access has no significant effect, suggesting that markets do not influence fuel decisions. Notably we do observe an increase in odds of purchasing fuelwood in urban areas, in tandem with an increase in fuel collection times. This may be a result of the opportunity cost of labor for women, who in labor markets where some women can earn more than the cost of buying fuel they may decide to purchase fuel even if there is no supply side constraint (Kelkar and Nathan 2007).
In some of our models regeneration and deforestation/degradation spatial lags have significant effects on our outcomes of interest. These neighborhood effects validate that land cover change in areas geographically contiguous with Enumeration Area centroids influence outcomes. Deforestation/degradation lags are associated with a decreased odds of purchased firewood. This is an opposite effect to deforestation/degradation within the Enumeration Area centroid. This opposite effect suggests that land cover change in the broader landscape has a strong negative effect on the odds of purchasing fuelwood, but the directionality is not what we hypothesized. The significance of the deforestation/degradation lag for collected firewood indicates that neighborhood level deforestation/degradation reduces collection time, this effect is also unexpected and may be explained by households that continue to collect biomass from nearby sources, but switch to lower quality wood (Brouwer et al 1997, Jagger and Shively 2014). Our results do not support findings by Bandyopadhyay et al (2011) who found that biomass scarcity has a small but positive effect on collection time. We also note that most fuelwood collection is undertaken on foot and carried as headloads. People in general will not travel more than 4–5 km to collect firewood unless they are facing a situation of extreme biomass scarcity. The only expected result is a neighborhood effect of an increase in fuel expenditures all else equal when there is considerable deforestation/degradation. This finding suggests that areas where people are purchasing fuel, and where deforestation/degradation at the neighborhood-level is significant, may be strategic locations for interventions that will reduce either the cost of fuel or the quantity of fuel required by households. Figure A1 indicates that spatial clustering of deforestation/degradation is not common in Malawi.
Conclusion
Our analysis aims to put a spatial lens on land use and fuel dynamics with the hope of providing guidance to policy makers and implementers working on improving access to improved cooking technologies in Malawi. Specifically we consider the role that land use change between 2001 and 2010, both regeneration and deforestation/degradation play in determining primary fuel choice, time to collect fuel, and expenditures on fuel. We find considerable dynamism in land use, with regeneration concentrated in Northern Malawi, and deforestation/degradation processes concentrated in the Central and Southern Regions. We do not find evidence of widespread change in primary fuel use over the time period we consider, but do observe trends indicating a move away from purchased fuelwood as a primary fuel source, and an increase in collecting time and expenditures in general.
We emphasize three findings. First, geographic areas with land use changes characterized as regeneration are dominated by collected fuelwood, have lower odds of purchased fuelwood as primary fuel, and have lower fuel collection times. Taken in tandem these factors suggest areas with high levels of regeneration are not ideal for targeting interventions aimed at reducing biomass reliance. Second, we find that areas with localized deforestation/degradation and urban areas have a higher odds of using purchased fuelwood as a primary fuel source. We also observe considerable increases in the real price of fuel between 2004 and 2010. Areas where households are purchasing fuelwood and face biomass scarcity are logical places to target interventions. Finally, we find evidence of a surprising level of heterogeneity in regeneration and deforestation/degradation processes throughout Malawi.
Our analysis has several limitations. We are constrained by the Integrated Household Survey instrument which only collects data on primary fuel used by households. Collection of secondary and tertiary fuels used by households would improve our ability to understand fuel use dynamics, and to understand where substitution of one type of fuel with another is taking place. We are also limited with respect to our ability to characterize how the quality of fuelwood is changing over time, a variable that though subjective would provide some insights into whether people trade-off quality for time spent collecting fuel. Additionally, we defined market access on the basis of road-based distance to nearest population center because no such data was collected from the surveys. Our analysis is also limited by the fact that the IHS2/3 are not panel surveys, but rather serial cross-sectional surveys. We are able to characterize trends at the Enumeration Area level, but we do not track changes in household behavior over time. Finally, given that the units of observation used for our analyses were IHS clusters, rather than individual households, our models did not include variables associated with household demographic and socioeconomic characteristics.
Future research could leverage panel data for a representative set of households in Malawi collected by the National Statistical Office as part of the LSMS Integrated Survey on Africa Program. Environmental degradation could potentially impact the cost and availability of biomass fuels in surrounding areas. In our current analysis, the effects of regeneration and degeneration/degradation within adjacent areas were considered as spatial lag terms in regression models; however, this could be expanded upon. Specifically, future work could investigate the spatial extent of these spillover effects to describe how widespread impacts associated with land cover change are. Replicating this analysis in a country with more variation in primary fuel use would allow us to draw broader conclusions about the changes in fuel use patterns relative to land use change and biomass availability. A country making the transition to charcoal and modern fuels including electricity and liquid petroleum gas would be of interest (e.g., Kenya and Tanzania), as would consideration of Zimbabwe, where households previously using modern fuels have been forced to revert to biomass fuels in the wake of land reform and economic crisis.
Acknowledgments
This research was funded by the Eunice Kennedy Shriver National Institute of Child Health and Human Development (K01HD073329) and the Fogarty International Center and National Heart, Lung and Blood Institute (R25 TW009340). We are grateful to the Carolina Population Center (P2C HD050924) at The University of North Carolina at Chapel Hill for general support. We also wish to thank the National Statistical Office of Malawi for their willingness to share IHS2 and IHS3 data with us. The opinions expressed herein are those of the authors and do not necessarily reflect the views of the sponsoring agency.
Appendix

Figure A1. Spatial autocorrelation of land cover change patterns at district-level.
Download figure:
Standard image High-resolution image
The plot highlights districts for which regeneration and degradation/deforestation patterns were locally clustered, according to Local Moran's I tests (Anselin 1995). Districts highlighted in red indicate locations where neighboring administrative units exhibited similarly high values of land cover changes, whereas those highlighted in blue indicate locations where neighboring administrative units exhibited similarly low values of land cover changes. Only significant clusters, after correcting for multiple comparisons using the false discovery rate approach (Benjamini and Hochberg 1995), are highlighted here.