


Abstract
Incorporation of charcoal produced by biomass pyrolysis (biochar) in agricultural soils is a potentially sustainable strategy for climate change mitigation. However, some side effects of large-scale biochar application need to be investigated. In particular a massive use of a low-reflecting material on large cropland areas may impact the climate via changes in surface albedo. Twelve years of MODIS-derived albedo data were analysed for three pairs of selected agricultural sites in central Italy. In each pair bright and dark coloured soil were identified, mimicking the effect of biochar application on the land surface albedo of complex agricultural landscapes. Over this period vegetation canopies never completely masked differences in background soil colour. This soil signal, expressed as an albedo difference, induced a local instantaneous radiative forcing of up to 4.7 W m−2 during periods of high solar irradiance. Biochar mitigation potential might therefore be reduced up to ∼30%. This study proves the importance of accounting for crop phenology and crop management when assessing biochar mitigation potential and provides more insights into the analysis of its environmental feedback.
Export citation and abstract BibTeX RIS

Content from this work may be used under the terms of the Creative Commons Attribution 3.0 licence. Any further distribution of this work must maintain attribution to the author(s) and the title of the work, journal citation and DOI.
1. Introduction
New mitigation strategies to counteract global warming through the reduction of net anthropogenic emissions of greenhouse gases (GHGs) are attracting increasing interest (Vaughan and Lenton 2011). One of the most promising of those strategies consists of steadily removing CO2 from the atmosphere, by adding biochar to agricultural soils (Lehmann et al 2006, Woodward et al 2009); an option that was estimated to potentially offset 12% of current anthropogenic GHG emissions (Woolf et al 2010). Biochar is a carbon rich residue of pyrolysis or pyrogassification of biomass that has a high mean residence time in soils (Wang et al 2015). It has been extensively shown that biochar is a soil amendant potentially enhancing soil fertility and crop yield (Jeffery et al 2011, Crane-Droesch et al 2013), increasing soil water retention capacity (Baronti et al 2014) and immobilizing a range of pollutants (Paz-Ferreiro et al 2014). Despite biochar use being depicted as a sustainable strategy (Laird 2008), there is the need to better understand the trade-offs that inevitably occur (Jeffery et al 2015), like potentially negative characteristics such as soil contamination with genotoxic compounds (i.e. polyciclic aromatic hydrocarbons) (Fabbri et al 2013) and the effects on plant defence (Elad et al 2010, Viger et al 2014).
Large-scale biochar application may change the surface radiative energy balance. Being a carbon-based substance, in fact, biochar has a very low reflectivity (Oguntunde et al 2008), and its addition to agricultural soils is demonstrated to affect the background colour of the treated cropland and, hence, surface albedo and energy flux partitioning (Genesio et al 2012). Land surface albedo is one of the most relevant geophysical drivers of the climate system (Betts et al 2007) and also conveys information about land use change, thus partially describing the effect of anthropogenic surface processes on earth's climate (IPCC 2007). Regional climate models are known to be sensitive to variations in cropland albedo parameterization (Rechid et al 2009, Singarayer et al 2009), even if arable lands only extend over 12% of the global ice-free earth's surface (Foley et al 2011). Simulations showed that a 20% increase of cropland albedo, theoretically achievable with a conversion to plant varieties having higher reflectivity (Davies-Barnard 2014), can lead, under a global application scenario, to regional cooling effects of up to 1 °C in intensively cultivated areas, such as Europe and North America (Ridgwell et al 2009). Another strategy that can enhance surface albedo over arable land is the adoption of different tillage practices: no-tillage is assumed to increase cropland reflectivity by ∼10% during summer and this may counteract heat-waves, inducing a cooling effect of the order of 2 °C (Davin et al 2014).
It is therefore clear why further investigations on the possible climatic feedback of biochar are required. Impacts on climate driven by changes in albedo are measured in terms of radiative forcing (RF) which is a quantity used to evaluate and compare the strength of the various mechanisms affecting the Earth's radiation balance and thus causing climate change (IPCC 2013). Along with the environmental benefits (negative RF) changes in cropland surface albedo from the addition of biochar can strongly counteract its C-sequestration benefits. This has already been demonstrated to occur at plot scale (Genesio et al 2012) while Meyer and co-authors (2012) estimated that biochar mitigation potential can be decreased by up to 13–22%, with an application rate of ∼30 Mg ha−1. Others assessed such an effect to range from 5–11% to 13–44%, depending on the application rate (120 or 10 Mg ha−1) and technique such as superficial or deep incorporation (Verheijen et al 2013).
Biochar effects on albedo are known to be stronger during winter (Genesio et al 2012), when bare soil is dominant in snow-free areas, while are supposed to be negligible in the presence of dense vegetation. However this assumption has not yet been investigated at the proper scale (1–10 km) where the heterogeneity of cropping systems and crop phenology plays an important role. This would complement previous studies that modelled surface albedo as function of fractional vegetation cover using remote sensing indices (Meyer et al 2012) or considered vegetation as a constant parameter (Verheijen et al 2013); and would be of help in the representation of soil signal dynamic that is of critical importance for regional and global climate models trying to evaluate albedo-related mitigation options.
This work aims to assess the biochar mitigation potential reduction (MPR) caused by the induced change in soil background albedo in a Mediterranean agricultural system in a multi-annual framework. The study focuses in particular on the masking effect of seasonal vegetation development on the background soil albedo, characterizing how the canopy dynamic and land management modulate the beneath-the-canopy soil signal and hence the RF. This was made by comparing three pairs of cropland sites with different soil albedo, with the aim of mimicking different biochar application rates (BAR). This enabled the use of 12 years of satellite-derived observations coupled with soil samples albedo measurement.
2. Materials and methods
2.1. Sites selection, ground sampling and laboratory measurements
Six agricultural sites in Tuscany (Italy) having different soil albedo were selected on the basis of soil classification maps (Regione Toscana 2014). Sites were organized into three pairs, defined as NE (North-East), NW (North-West) and SE (South-East), according to geographical criteria (figure 1). The similarity of paired sites was assessed by the examination of time series of aerial photographs which enabled to distinguish in each site the fraction of land occupied by road and infrastructures, water bodies, agricultural land use and management (see supplementary information (SI) section 1 for more detailed explanation). Each pair was formed of a bright (B) and a dark (D) soil site. For each of the six sites, three different fields (replicates) were selected for soil sampling. In each field five soil cores were taken in different points and these were mixed to obtain an average sample for each selected field and a total of three replicates for each site, for a total of 18 samples. Soil analyses and classification are reported in the SI, section 2.1.
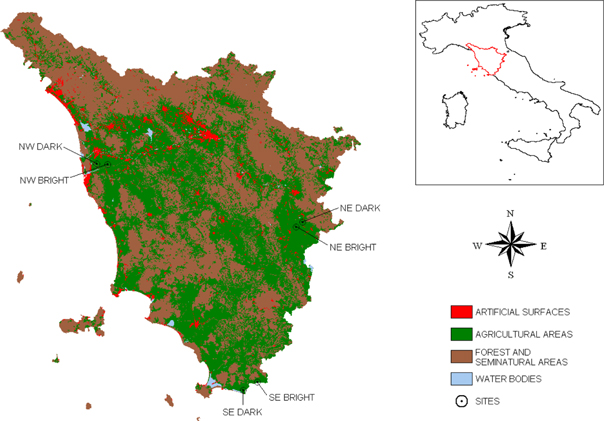
Figure 1. Map of Tuscany, central Italy, with the six sites selected for the analysis.
Download figure:
Standard image High-resolution imageSurface albedo (α) measurements were taken on oven-dried soil samples under clear sky conditions using an ASD FieldSpec Pro spectroradiometer (ASD, Boulder, CO, USA), with a range 350–2500 nm and spectral resolutions of 3 at 700 nm and 10 at 1400/2100 nm. Shortwave albedo (300–5000 nm) was computed as a linear combination of seven narrowbands, using the formula by Liang (2001). A modified Thompson tau algorithm was used to detect outliers and a one-way ANOVA was used to compare the measurements made under dry conditions. Albedo differences measured for each pair were associated to BAR using albedo measurements of each bright soil sample mixed with biochar at different doses (see SI sections 2.2 and 2.3).
2.2. MODIS data
Areas large enough to contain a 2 × 2 MODIS pixels (500 m grid) were chosen in each site. A 12-years time series (October 2000–September 2012) of the MCD43A3 (Albedo) (Schaaf et al 2002) and MOD13A1 (vegetation indices) (Huete et al 2002) products, were obtained from the NASA LPDAAC website (https://lpdaac.usgs.gov). The MCD43A3 albedo product provides both the white-sky albedos (WSA: bihemispherical reflectance) representing the diffuse component, and the black-sky albedos (BSA: directional hemispherical reflectance) representing the direct component. Stroeve et al (2005) carefully analysed the correlation between both WSA and BSA and ground-based albedo observations made in several sites to conclude that in the majority of conditions there is a clear equivalence between the two values. The choice of using shortwave broadband WSA was then made because of independence from solar zenith angle, and also considering its adoption in previous studies dealing with background albedo retrieval (Houldcroft et al 2009, Schwaab et al 2015) and in leading Earth system models such as JSBACH and ORCHIDEE (Loew et al 2014). Normalized difference vegetation index (NDVI) is a remote sensing index that has been repeatedly correlated to leaf area index (LAI) of crops and natural vegetation (Rouse et al 1973). Although it tends to saturate at high LAI, NDVI is considered to be a reliable indirect indicator of the amount of light which is absorbed by plants and hence of the fractional vegetation cover (Sellers 1985). Each pixel/period of the MCD43A3 dataset is provided with a quality flag and the available percentage of high-resolution data per grid cell; this enabled us to exclude low quality data. Missing values in albedo and NDVI were gap-filled using spatial interpolation. If a sufficient number of nearby values were not available in space, we assigned mean time-series values for that pixel/period.
Monthly mean instantaneous bottom of atmosphere (BOA) and top of atmosphere (TOA) solar irradiance data at one degree resolution were obtained from the Clouds and Earth's Radiant Energy System (CERES) energy balanced and filled for CMIP5 dataset (Loeb et al 2009). A spline interpolation was used, where needed, to uniform the temporal resolution of the data sets. Mean intra-annual profiles of the studied quantities for each site/pair were obtained averaging the entire time series over years and over pixels at each time step.
2.3. RF calculation and biochar MPR
The net instantaneous shortwave radiation flux at Earth's surface (SWFsfc) was computed using the following formula (Offerle et al 2003):

where α is the land surface albedo and SW↓ is the instantaneous solar irradiance at the BOA. The instantaneous radiative forcing (IRF) induced by a different land surface albedo was calculated using the following formula (Bright et al 2012):

where Δα = (αbright—αdark) is the albedo difference between the means of B and D, fE is the fraction of Earth's surface affected by the albedo change and Ta is the fraction of the shortwave radiation reflected from the surface that reaches back the TOA. In the case of arable land, fE was assumed equal to 0.028 (Lenton and Vaughan 2009). If the albedo variation applies to the entire considered area, then fE = 1 and (2) provides the local instantaneous radiative forcing (LIRF, Campra et al 2008). Due to a lack of direct measurements, Ta is often approximated by the clearness index KT, defined as the fraction of incoming solar radiation at TOA that reaches Earth's surface, after cloud reflections and atmosphere absorption (Bright et al 2012). We therefore assumed Ta = KT and we computed monthly values of KT as the ratio between CERES values (http://ceres.larc.nasa.gov/index.php) of downwelling shortwave radiation data at BOA and TOA (1° × 1° grid). IRF should not be directly compared with what is usually called RF. RF was calculated allowing for stratospheric temperatures to readjust to radiative equilibrium, while holding surface and tropospheric temperatures and state variables fixed at the unperturbed values, thus accounting for longer term responses of the climate system to the considered perturbation (IPCC 2013). The RF is estimated to be 78% of IRF (Gray et al 2009), even if the confidence level of this adjustment is recognized to be low (IPCC 2013):

The 12 years difference between the shortwave absorbed solar energy difference (ASED) of the dark and the bright site for each pair was computed using BOA incoming shortwave radiation data and expressed in MJ m−2.
The negative RF due to carbon sequestration (RFseq) is defined as

where CO2(t) = 500 ppm is the reference value of atmospheric CO2 in the absence of geoengineering by time t, k = 2.14 × 10⁹ MgC ppm−1 is a conversion factor and β = 5.35 W m−2 is the pre-industrial RF (Verheijen et al 2013). The value of ΔCatm, which is the amount of CO2 removed from the atmosphere (in MgC), is determined as follows:

where sT is the surface treated with biochar (in ha) and wC = 70% is a bulk gravimetric C content of the biochar used in the mixing experiment (SI section 2.3), kd is the decay fraction of carbon contained in biochar which is lost by oxidation (15%) over an arbitrary time scale of twenty years (Woolf et al 2010) and BAR is the BAR in Mg ha−1 as calculated in the mixing experiment (SI section 2.3).
Instead of providing global RF estimates, we defined the MPR, a percentage value indicating the reduction of environmental benefit due to the positive RF. This was calculated combining (2), (3), (4) and (5) as

Here,  is the carbon application rate and γ = 3.06 × 10⁻⁴ MgC W−1 is the coefficient obtained as

with sE = 5.1 × 10¹⁰ ha being the Earth's surface. The advantage of using MPR is that it does not depend on sT, i.e. is a dimensionless quantity independent of the extent of the treated surface.
3. Results
The examination of aerial photographs confirmed that the partitioning of land between infrastructures, water bodies and agriculture was very similar for each pair. The only exception was associated to different land management (crop rotation) in the B and D sites of the NE pair (SI section 1).
Spectroradiometer measurements of soil samples from the three pairs covered a wide interval of albedo values ranging from 0.12 (SE-D) to 0.22 (NW-B) under dry conditions (figure 2). Although the values showed high variability, the modified Thompson tau algorithm did not detect any outlier. Relative albedo differences between bright and dark ground samples were obtained for the three pairs: NW showed the greater difference (−41.8%), while NE and SE had a smaller albedo difference of −27.5% and −26.9%, respectively. In the mixing experiment (SI section 2.3), the BAR required to mimic the relative albedo differences between pairs of sites were 34, 112 and 36 Mg ha−1 for NE, NW and SE, respectively.

Figure 2. Soil samples albedo measurement: the boxplot show the albedo measurements of the bright (B) and dark (D) soil samples under dry conditions for each of the pair NE, NW and SE. The upper and lower borders of each box represent the 75th and the 25th percentile of the distribution (Q3 and Q1, respectively), while the horizontal segment within the box is its median. The whiskers are delimited by the lowest datum within 1.5 IQR of the lower quartile, and the highest datum still within 1.5 IQR of the upper quartile, where IQR = Q3 − Q1; values outside the whiskers range are plotted as dots.
Download figure:
Standard image High-resolution imageAnnual trends in NDVI were averaged over twelve years of data. NDVI was comparable for the two pairs NW and SE, while differences were detected for the NE pair. This is a direct consequence of the fact that sunflower was the dominant crop in the NE-D, but not in NE-B, during a large fraction of the study period (SI section 1). For all pairs the maximal NDVI value, over the 12 years mean was observed in April/May (figure 3(a)): for SE the highest value (0.71 ± 0.02) occurred in late April, while for the other two pairs it was in early May (0.65 ± 0.03 for NE, 0.67 ± 0.02 for NW). The lowest values were spread over a wider time window: SE had its minimum at the beginning of September (0.31 ± 0.02), NW in the second half of September (0.3 ± 0.02) and NE at the beginning of October (0.32 ± 0.02). The low-NDVI phase lasted 48 days for both NE and SE, and 16 days for NW, on average. Wintertime NDVI was higher in SE (∼0.54) than for NE and NW (∼0.35 and ∼0.41, respectively). The rate of change in NDVI soon after the spring/summer peak was higher for SE (figure 3(a)).

Figure 3. 2000–2012 mean satellite data intra-annual profiles. (a) Mean pair NDVI with standard errors (grey lines); temporal resolution of 16 days. (b) White sky albedo (WSA) for bright (solid line) and dark (dashed line) sites, with standard errors (grey lines); temporal resolution of eight days. (c) White sky albedo difference (ΔWSA) between bright and dark sites with standard error bars; time resolution of eight days. (d) Instantaneous radiative forcing (IRF, solid line; left axis) with standard errors (grey lines) and incoming shortwave solar radiation (SW↓, dashed lines; right axis).
Download figure:
Standard image High-resolution imageAs for NDVI, annual trends of MODIS WSA were averaged over twelve years. WSA showed a common seasonal pattern for all the paired sites (figure 3(b)), with two peaks. The first WSA peak was detected in late April in correspondence to NDVI peak for NE and NW and a few days earlier for SE. The second WSA peak was observed during the first half of July while NDVI was decreasing (NE and NW), or was close to its minimum (SE). For all pairs the minimum WSA was detected between late November and the beginning of January. The mean WSA difference between B and D pairs (ΔWSA, figure 3(c)) had a similar trend in NW and SE. WSA curves in the dark sites were always below those of the bright sites (ΔWSA always positive), with the exception of NE during summer, when a negative ΔWSA peak was observed. The maxima of ΔWSA always corresponded to minima of NDVI and a consistent WSA decrease, likely associated to increasing soil moisture, was observed everywhere in the fall period, when a consistent but variable increase in NDVI was detected, too.
The annual trends in the LIRF were calculated as twelve years means. The highest LIRF was detected in mid-October for NE and in August for NW and SE, between the peak of incoming shortwave radiation and the occurrence of the highest ΔWSA (figure 3(d)). For the pairs NW and SE, LIRF was always positive and covaried with ΔWSA, peaking at 4.3 ± 0.4 W m−2 and 4.7 ± 0.6 W m−2, respectively. LIRF curve in NE showed instead a deep negative minimum of −4.2 ± 0.7 W m−2, in July returning to positive values at the beginning of August. Yearly averaged LIRF calculated for the three pairs were 0.16 ± 0.09 W m−2 for NE, 1.65 ± 0.08 W m−2 for NW and 1.99 ± 0.09 W m−2 for SE. Biochar MPR calculated using equation (6) and considering error propagation was in the range of 1.1–3.8% for NE, 7.2–7.9% for NW and 27.1–29.7% for SE.
ASED curves were cumulated over 12 years (figure 4) delineating two main trends, one steep for both NW and SE and one almost flat for the NE pair. In this last case, positive and negative LIRF periods compensated the overall energy budget, even if a slightly increasing trend was detectable starting in 2008. For NE a final difference of 0.19 × 10³ MJ m−2 over twelve years was found, while the final ASED values measured for NW and SE were 1.16 × 10³ MJ m−2 and 1.34 × 10³ MJ m−2, respectively. Those values translated into an average annual energy surplus of 0.35% for the dark site of NE, while it exceeds 2% for those of NW and SE.
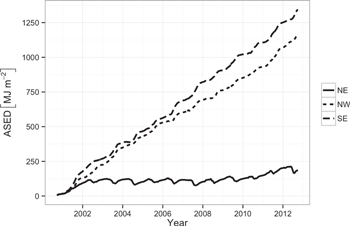
Figure 4. Cumulated absorbed solar energy difference (ASED) in MJ m–2 for the entire study period. ASED is computed as the difference of absorbed incoming shortwave radiation at BOA between the dark and bright site of each pair.
Download figure:
Standard image High-resolution image4. Discussion
A critical but often neglected consequence of large-scale biochar application to agricultural soils is the effect of changes in surface albedo. Biochar has a low reflectivity and this may offset part of its mitigation potential. In principle, the darker is the soil, the higher is the fraction of shortwave incoming solar radiation that is absorbed by the surface, even if the presence/absence of vegetation or crops can mask such an effect. The reflectance of crop leaves and canopies does not depend directly, at least for similar fertility and water availability levels, on soil albedo. The rationale of this study is that the exact quantification and validation of the net effect of this dynamic soil-canopy interaction can hardly be made by means of direct experimentation. This type of experiment would necessarily require biochar applications at scales larger that the mean size of individual fields, but also sufficient replication and, more importantly, multi-annual surface energy balance observations. The alternative method proposed assumes that soils having different colours (and albedo) can mimic differences in soil albedo that could be eventually associated with large-scale biochar application. This approach implies, in a first instance, that land use and land management of bright/dark soil pairs is the same. Quantitative analysis of aerial photographs clearly demonstrated that all the pairs have the same land use. Land management was instead the same only for two out of the three-paired sites (SI section 1). When analysed on a sufficiently long time scale (12 years), satellite data clearly demonstrated that when land management was the same crops attenuated, although not entirely, surface albedo differences caused by different soil colour. The shortwave energy load was permanently larger for darker soils even, if seasonal changes occurred. In first instance, neglecting the potential effect that biochar might have on crop establishment and leaf area development, this main result supports the idea that biochar application at farm/regional scale would induce a positive RF, at least with similar land management. This consideration requires, however, more detailed analysis and interpretation:
- In mid-high latitudes, during winter and in late autumn, even a large difference in albedo only slightly contributes to RF mainly because the solar radiation is low. This also applies to Mediterranean agriculture where the fractional vegetation cover tends to be low in winter and, as a consequence, differences in soil albedo are unavoidably large. When the interplay between irradiance (SW) and vegetation development (NDVI) is considered in its temporal dynamic, the LIRF associated to soil colour difference have a well identifiable seasonal pattern at least for site pairs having identical land use and land management patterns (figure 5-NW, 5-SE). Such pattern is likely to be reproduced in the case of possible future large-scale biochar applications and can be therefore used as a predictive tool to assess the impact of biochar-driven albedo changes on the radiation balance. During spring and in early summer when the LIRF due to albedo difference would be the highest, the masking provided by vegetation largely, but not entirely mitigates its effect. Such incomplete masking is likely to be associated to the inherent texture of farmyards that is typical of a large part of the Mediterranean region. When textural elements (fields) have a small mean size, the relative contribution to the overall albedo of unmanaged areas and the road networks where the soil is bare, inevitably increases. Inadequate agronomic management of those fields also contributes to incomplete masking, as gaps in the vegetation cover diminish the overall effect. It is also likely that within a given geographical area, land texture affects the fraction of land surface that is covered by spontaneous vegetation, and this may reduce surface reflectance if the soil is brighter than the vegetation. Similarly, it may be inferred that the MPR might scale with local climate variables, in particular precipitation, as differences in soil background albedo are minimized in the case of wet soils (data not shown). Overall, land texture, soil humidity, crop management and the relative incidence of spontaneous vegetation explain the fact that satellite estimations of albedo never matched albedo values that were experimentally assessed on soil samples, in the laboratory.
- When considered from a quantitative point of view, our data indicate that application rates theoretically corresponding to 112 and 36 Mg ha−1 (NW and SE, respectively) would lead to mean annual positive RF in the order of 1.75 and 2.13 W m−2. For the specific study region, given its current farm structure, this would actually reduce biochar mitigation potential due to C-sequestration by 7.6% and 28.4%, respectively. Values that are comparable to those estimated elsewhere (Meyer et al 2012, Verheijen et al 2013) for a similar application rate (120 Mg ha−1) but for biochar having lower C-content (table SI 7). When seen in an operational context, this supports the idea that the biochar to be applied as soil amendment should have a high Carbon content and that application rates per unit land should also be high (Genesio et al 2012, Meyer et al 2012, Verheijen et al 2013). In those cases, higher C-sequestration would be obtained with possibly smaller effects on surface albedo at higher scales. It is in fact obvious that radiative feedbacks of biochar tend to saturate with the application dose (SI figure 6).
- The specific case of the NE pair highlights another important aspect of the soil/vegetation interaction in the regulation of surface albedo. In this case, the different land management between the bright and dark sites led to an inversion of LIRF sign, and to a change in its overall dynamical pattern (figure 5-NE). When sunflower (Helianthus annuus (L.)) was cultivated in the dark but not in the bright site, this caused a substantial increase in albedo. This crop species has a relatively high albedo (0.24–0.3, Doughty et al 2010) that dramatically increases the overall surface reflectance, especially during the flowering period (figure 3, NE). This determined the existence of a well-defined seasonal time window during which the dark site gained higher reflectance than the bright one, thus annihilating the effect of the soil albedo difference. Accordingly LIRF patterns, in the interplay between irradiance and NDVI, also changed in response to land management changes (figure 5). The consequence is that for NE the computed MPR is only 2.4%, for an associated BAR of 34 Mg ha−1, while with a similar estimated BAR, for the pair SE we computed a MPR of 28.4%, almost 12 times higher. Those numbers highlight how strongly the albedo effect of the crop choice can affect shortwave reflectance, even if the relative importance of alternative land management options, such as fallow management, including no-tillage, should also not be neglected (Davin et al 2014). Agronomy matters, either for the science trying to assess and predict vegetation impact on earth's climate, or for operational climate change mitigation options that might be implemented. Climate modelling predictions made at different scales can be substantially improved by the proper computation of surface radiation fluxes. Earth systems models make use of dynamic global vegetation models (DGVMs) to compute canopy radiation scheme as a function of the LAI (Cox 2001, Loew et al 2014). Nevertheless these models do not take fully into account cropland management options (residue removal, grass as cover crop, tillage) that were shown to be important for calculating the land-atmosphere carbon flux (Lindeskog et al 2013) and represent a prominent bias in albedo parameterization (Zhou et al 2014). In our work we demonstrate that NDVI, and hence LAI, is well correlated to albedo only from seeding to harvest (figure 6) while after harvest albedo behaviour is decoupled from NDVI (figure SI 3(b)) suggesting a driving role of crop management strategies on surface reflectance. The intercept of the fitting lines in figure 6 are estimates of a mixture of dry and wet bare soil background albedo, corresponding to specific soil colour classes which are used, for instance by the CLM model (Oleson et al 2010). Our results potentially contribute to an improved parameterization of climate models to assess the occurrence of atmospheric feedbacks in response to different scenarios of biochar application in agriculture. On the other hand the results of our soil-biochar mixing experiment (figure SI 6) provide a parameterization of the biochar dose effect on soil background albedo, something that can be directly implemented in a modelling scheme to simulate potential feedback effect. It is obvious that the use of this type of transfer radiation scheme only applies to crop growth period i.e. during the transition between bare soil conditions at sowing and the full canopy cover. When the full annual cycle is considered, instead, periods with low NDVI (low LAI) and high albedo are also observed (figure 3) suggesting that the full crop cycle which includes periods in which dry crop residues are left over the soil are also affecting surface albedo. This calls for additional attention in the description of annual course of surface albedo in models as surface albedo is not only dependent on leaf area development of the crops but varies in response to other agronomic management strategies, too. We predict, in accordance to Davin et al (2014) that changes in albedo associated to crop management beyond the canopy development period may be of importance and should not be neglected. As far as climate change mitigation is concerned, an increasing attention to the radiative properties of surfaces and of future crops is required. Figure 4 shows that the ASED between dark and bright soil sites of NE substantially rose after 2007, i.e. after the new European common agricultural policy (CAP), modified subsidies to individual landowners (Eurobarometer 2008). This provides evidence of how agricultural policies, mainly driven by economic constraints, may inadvertently affect the impact of agriculture in mitigation strategies.
The approach used in this study did not consider other implications of biochar use, such as its potentials for enhancing soil fertility, soil water retention and crop growth. It neither investigated how changes in albedo may eventually affect partitioning of net radiation between sensible, latent and soil heat fluxes. This is an important aspect as changes in turbulent fluxes may be affected by changes in albedo and surface temperature (Luyssaert et al 2014). Our results call for further research on this specific aspect both by means of modelling and field experiments.

Figure 5. Graph showing for the three pairs (NE-NW-SE) the interplay between short wave incoming solar radiation (x-axis) and local instantaneous radiative forcing (y-axis) for different NDVI values (grey scale dots).
Download figure:
Standard image High-resolution image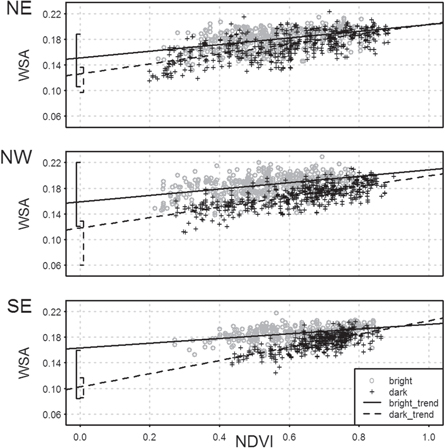
Figure 6. Twelve years values (2000–2012) of NDVI versus WSA in crop development phases (DOY 57-136 for NE and NW and DOY 57-120 for SE), for each of the four pixels framed, for both bright (grey circles) and dark (black crosses) soil sites. Solid and dashed lines represent the linear regression models relating NDVI (independent variable) and WSA (dependent variable) for bright and dark sites respectively. The segments on the left part of the graphs, in correspondence to NDVI = 0, represent the measured albedo for bright (solid line) and dark (dashed line) soil samples under both dry (upper limit) and wet (lower limit) conditions.
Download figure:
Standard image High-resolution image
5. Conclusion
This study assessed the magnitude of possible radiative feedback resulting from realistic scenarios of biochar application in a specific agricultural area of the Mediterranean region. It considered a yet unexplored spatial scale by using an innovative approach involving natural features of different soils and a combination of satellite and in situ measurements to mimic the biochar effects on surface albedo. This enables to draw some conclusions:
- Estimations of MPR due to biochar driven changes in albedo that were previously obtained at the plot and laboratory scales (Genesio et al 2012, Meyer et al 2012, Verheijen et al 2013), are fully consistent to the results presented herein at much higher scale where more complex textural patterns are analysed in a multi-annual framework.
- Such validation confirms in a robust and scalable manner that if soils will become darker, a moderate but detectable increase in RF will occur and this will offset a non-negligible fraction of biochar C-sequestration potential.
- Our result may contribute, by complementing previous studies, to model parameterization biochar-dose effect on albedo.
- The modelling experiments that may be designed to evaluate the effects of biochar on the surface radiative balance at the large scale, will require improved parameterization of agronomic management practices (e.g. tillage, residues management, crop choice etc) as those may substantially affect the land surface parameters, especially albedo, partially offsetting the MPR of biochar.
The spread of specific crops with high reflectance (Ehleringer and Mooney 1978, Johnson et al 1983, Drewry et al 2014) and the adoption of specific measures for fallow management should accompany large scale applications of biochar as biochar-induced decrease of surface albedo must be compensated by other albedo-increasing strategies to maintain its mitigation potential.
Acknowledgments
The authors acknowledge Lorenzo Gardin for support in sites selection, Alfonso Crisci for the support in the statistical approach and Silvia Baronti for her support in soil samples analysis. This work was supported by the EuroCHAR project (FP7–ENV–2010 ID–265179). The authors also acknowledge the anonymous reviewers for their valuable comments and suggestions.