
Abstract
Single molecule drug delivery systems have failed to yield functional therapeutic outcomes, triggering investigations into multi-molecular drug delivery vehicles. In the context of skin fibrosis, although multi-drug systems have been assessed, no system has assessed molecular combinations that directly and specifically reduce cell proliferation, collagen synthesis and transforming growth factor β1 (TGFβ1) expression. Herein, a core–shell collagen type I hydrogel system was developed for the dual delivery of a TGFβ trap, a soluble recombinant protein that inhibits TGFβ signalling, and Trichostatin A (TSA), a small molecule inhibitor of histone deacetylases. The antifibrotic potential of the dual delivery system was assessed in an in vitro skin fibrosis model induced by macromolecular crowding (MMC) and TGFβ1. Sodium dodecyl sulphate-polyacrylamide gel electrophoresis (SDS-PAGE) and high performance liquid chromatography analyses revealed that ∼50% of the TGFβ trap and ∼30% of the TSA were released from the core and shell compartments, respectively, of the hydrogel system after 10 d (longest time point assessed) in culture. As a direct consequence of this slow release, the core (TGFβ trap)/shell (TSA) hydrogel system induced significantly (p < 0.05) lower than the control group (MMC and TGFβ1) collagen type I deposition (assessed via SDS-PAGE and immunocytochemistry), α smooth muscle actin (αSMA) expression (assessed via immunocytochemistry) and cellular proliferation (assessed via DNA quantification) and viability (assessed via calcein AM and ethidium homodimer-I staining) after 10 d in culture. On the other hand, direct TSA-TGFβ supplementation induced the lowest (p < 0.05) collagen type I deposition, αSMA expression and cellular proliferation and viability after 10 d in culture. Our results illustrate the potential of core–shell collagen hydrogel systems for sustained delivery of antifibrotic molecules.
Export citation and abstract BibTeX RIS

Original content from this work may be used under the terms of the Creative Commons Attribution 4.0 license. Any further distribution of this work must maintain attribution to the author(s) and the title of the work, journal citation and DOI.
Abbreviations
| αSMA | α smooth muscle actin |
| ANOVA | analysis of variance |
| Col | collagen |
| C-S | core–shell modular hydrogel |
| DF | dermal fibroblasts |
| DAPI | 4,6-diamidino-2-phenylindole |
| FITC | fluorescein isothiocyanate |
| HDACs | class I and II mammalian histone deacetylases |
| MMC | macromolecular crowding or crowder |
| NCL | non-crosslinked hydrogel |
| PBS | phosphate buffered saline |
| PEG | four arm polyethylene glycol succinimidyl glutarate |
| SDS-PAGE | sodium dodecyl sulphate-polyacrylamide gel electrophoresis |
| SMAD | small mothers against decapentaplegic |
| T122bt | TGFβ type II receptor-based trap |
| TGFβ | transforming growth factor β |
| TSAz | trichostatin A |
1. Introduction
Considering that tissue development and growth and disease manifestation and progression are the result of multiple molecular and biological cascades, it is naïve to believe that single molecule therapeutic approaches will ever result in complete functional repair and regeneration. In this context, the use of multi-cargo delivery vehicles [1, 2] for a wide variety of clinical indications (e.g. ophthalmology [3], cancer [4], diabetic wounds [5], orthopaedics [6]) has been proposed. Data to-date, clearly illustrate the superiority of multi-molecular delivery systems over traditional mono-molecular administration approaches with respect to improved therapeutic effect, reduced systemic toxicity and lowered treatment cost [7–10].
Skin fibrosis is still an unmet clinical need, which affects (clinical outcomes range from cosmetic imperfections to functional impairment) over 100 million patients every year [11] and its associated annual healthcare expenditure in US alone exceeds US$ 12 billion [12]. Fibrotic skin disorders (e.g. scleroderma [13, 14], keloids and hypertrophic scars [15, 16]) are characterised by excessive and abnormal extracellular matrix (ECM) synthesis and deposition, which leads to altered tissue architecture and impaired function. Numerous cells, molecules and signalling pathways are involved in fibrosis manifestation, progression and exacerbation during the three (inflammatory, proliferative and remodelling) phases of the jeopardised wound healing process [17–19], rendering it a prime target for multi-molecular delivery. In a clinical setting, intralesional multi-molecular therapies have shown improved patient outcomes in comparison to their mono-molecular counterparts [20–25], but the mode of administration offers little control over cargo protection, localisation and bioavailability [26, 27] and the use of steroids as one of the molecular treatment modalities is often associated with numerous side effects (e.g. toxicity, pain, ulceration, atrophy) [28–31].
In the quest of the ideal carrier for localised and sustained delivery of multiple therapeutics, the use of hydrogels [32, 33] and electrospun scaffolds [34, 35] has been advocated for efficiency, simplicity and scalability purposes across all clinical indications. In hypertrophic and keloid scars, various electrospun and hydrogel dual-delivery systems (e.g. antimetabolite/glucocorticoid [36]; antioxidant/glucocorticoid [37]; anti-inflammatory/pro-wound healing [38]; cell proliferation and activation regulator/anti-inflammatory [39] combinations) have clearly demonstrated promise (details of the studies are provided in supplementary table S1 (available online at stacks.iop.org/BMM/17/025017/mmedia)). However, despite the notable results that these proof-of-principle studies have demonstrated, one cannot but note that no study has yet assessed molecular combinations that are directly and specifically involved in reducing cell proliferation, collagen synthesis and expression of TGFβ1, the major orchestrator of fibrosis [40–42].
Considering the above, herein, we ventured to develop a differentially crosslinked collagen-based multi-compartment hydrogel system for dual drug delivery. We selected pepsin extracted and PEG crosslinked collagen due to its well established cytocompatibility, low macrophage response and reduced antigenicity and immunogenicity [43–49]. Further, collagen-based devices have long history in wound management, including chronic wound management [50–53]. TSA, a HDAC inhibitor, was chosen, due to its well-established history in suppressing collagen synthesis, preventing TGFβ1 signalling, inducing fibrotic cell apoptosis, suppressing myofibroblast activation and augmenting M2 macrophage polarisation [54–57]. Similarly, a TGFβ trap was used as a second molecule, as it has been shown to reduce cell proliferation; small mothers against decapentaplegic (SMAD 2) phosphorylation; TGFβ1 induced collagen expression and synthesis; and connective tissue growth factor expression [58–61]. The efficiency and effectiveness of the produced dual delivery hydrogels systems to supress fibrosis were assessed in the improved in vitro scar model [62–64] that utilises TGFβ1 to induce fibroblast transformation to myofibroblast, which is associated with de novo αSMA expression and increased collagen synthesis [65–67] and MMC to increase collagen deposition [68–70].
2. Materials and methods
2.1. Materials
All plasticware were obtained from Sarstedt (Ireland) and Thermo Fisher Scientific (Ireland). All chemicals and reagents were purchased from Sigma–Aldrich (Ireland), unless otherwise stated. Porcine Achilles tendons were obtained from a local slaughterhouse.
2.2. Collagen type I extraction and purification
Collagen type I was extracted using the acid/pepsin digestion method [71, 72]. Briefly, using a sterile surgical scalpel, surrounding fascia and fat were removed and the tendons were cut in small pieces (1 × 1 × 1 cm). After freezing at −80 °C, the tendon pieces were cryo-milled into a powder using liquid nitrogen and a Freezer/Mill 6870 (SPEX SamplePrep, USA). The tendon powder was repeatedly washed with PBS and then suspended in 1 M ethanoic acid solution for 48 h at 4 °C. Pepsin (porcine gastric mucosa, 3200–4500 units mg−1 protein, catalogue number: P6887) was then added into the solution for further 48 h at 4 °C. The collagen suspension was then sieved, filtered and purified by repeated salt precipitation (0.9 M NaCl), centrifugation (11 000 g for 20 min) and 1 M ethanoic acid re-solubilisation at 4 °C. The collagen solution was then dialysed against 0.05 M ethanoic acid and stored at 4 °C. The purity of the final atelocollagen solution (5 mg ml−1) was determined by SDS-PAGE [73] and correlated to purified collagen type I (Symatese, France). Briefly, the extracted collagen and the Symatese obtained collagen were neutralised with 1 M NaOH, denatured at 95 °C and resolved under non-reducing conditions using in-house a 5% resolving and a 3% stacking polyacrylamide gels on a Mini-Protean 3 (Bio-Rad Laboratories, UK) system. The gels were stained with a SilverQuest™ Silver Staining Kit (Invitrogen, Ireland) according to the manufacturer's instructions. The in-house extracted collagen preparation exhibited a typical collagen type I electrophoretic mobility, comparable to the commercially available collagen type I (supplementary figure S1).
2.3. Fabrication of multi-compartment collagen type I hydrogels
Core–shell collagen hydrogels were produced in a stepwise process in ice, unless specified otherwise at specific steps (figure 1 and supplementary table S2). Firstly, the bottom part of the shell compartment was prepared by mixing the atelocollagen solution with 10× PBS, 1 M NaOH and 0.5 mM or 1 mM PEG (final concentration, JenKem Technology, USA); centrifuging to remove air bubbles; and gelling for 2 h at 37 °C. After gelling, a polylactic acid 3D-printed cubical mould (height: 2.05, 3 or 5 mm; width: 2.05, 3 or 5 mm; depth: 2.05, 3 or 5 mm) was centred on top of the bottom part of the shell compartment and a mixture of atelocollagen, 10× PBS, 1 M NaOH and 0.5 mM or 1 mM PEG (final concentration) was added up to the rim of the mould. After gelling for 2 h at 37 °C, the mould was carefully removed and the core compartment was formed by pouring in the void of the removed mould a mixture of atelocollagen, 10× PBS, 1 M NaOH and 1 mM or 2 mM PEG (final concentration) and letting it gel for 2 h at 37 °C. Afterwards, the top part of the shell compartment was formed by adding a mixture of atelocollagen, 10× PBS, 1 M NaOH and 0.5 mM or 1 mM PEG (final concentration) and letting it gel for 2 h at 37 °C, resulting in the formation of a multi-compartment core–shell hydrogel. Different crosslinking densities for each compartment (1 mM shell compartment and 2 mM core compartment) were selected in an attempt to develop a hydrogel system with sequential drug release capacity.
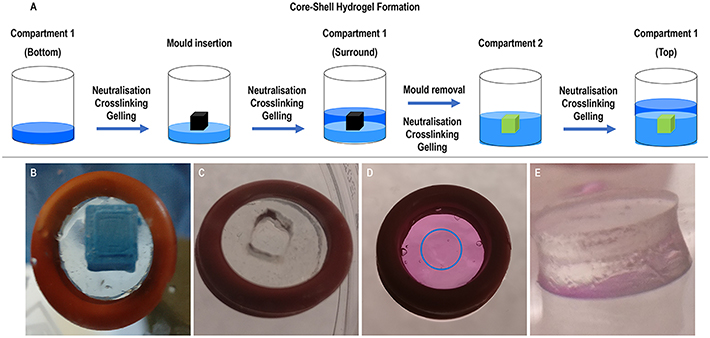
Figure 1. (A) Schematic of the formation process of the core–shell multi-compartment collagen hydrogel system using porcine Achilles tendon collagen type I solution, crosslinked with different concentrations of PEG and loaded with different anti-fibrotic substances on each compartment. (B) Optimisation of the production of the core–shell multi-compartment collagen type I hydrogels in O-rings—insertion of a PDMS-coated 3D-printed PLA mould on top of the gelled bottom collagen type I hydrogel layer in an O-ring. (C) Removal of the mould for the creation of an inner compartment in the hydrogel system. (D) Complete multi-compartment hydrogel system in an O-ring with the inner compartment (highlighted with a blue circle). (E) Side view of the complete hydrogel system when removed from the O-ring support.
Download figure:
Standard image High-resolution image2.4. FITC release assay
A solution of FITC-dextran (40 kDa) in PBS, at an initial concentration of 5 mg ml−1 was added to the core compartment of the 0.5 mM PEG shell/1 mM PEG core and 1 mM PEG shell/2 mM PEG core hydrogels at the time of their formation for a final concentration of 200 μg ml−1. After gelling, the hydrogels were immersed in 1 ml PBS. Aliquots of 100 μl were removed at the appropriate time points (0, 0.04, 0.08, 0.17, 0.33, 1, 2, 3, or 7 d) and replaced with fresh PBS. Quantification of cumulative released FITC-dextran was assessed through the measurement of fluorescence at 495 nm (Varioskan Flash, Thermo Fisher Scientific, USA).
2.5. Mechanical compression analysis
The 1 mM PEG shell/2 mM PEG core hydrogels (8 mm diameter and 8 mm thick) were subjected to compression testing using a biaxial mechanical testing equipment (ZwickRoell, Germany), operating as follows: loading speed of 5 mm min−1, maximum displacement of 50% and maximum applied force of 10 N. The compression modulus was calculated as the slope from the linear elastic behaviour region of the plotted stress–strain curve. As a control, NCL, fabricated in a single step process (i.e. non-modular), were used. These hydrogels were prepared in the same type of containers as the core–shell hydrogels by mixing the atelocollagen solution with 10× PBS, neutralising it with NaOH, homogenising the resulting solution and incubating it for 16 h at 37 °C to promote gelation.
2.6. Cell culture, induction of fibrosis and antifibrotic effect analysis
Normal adult dermal fibroblasts (DF, PCS-201-012, ATCC, USA) were cultured in media containing high glucose DMEM (4500 mg l−1 glucose, L-glutamine, sodium pyruvate and sodium bicarbonate), 10% foetal bovine serum and 1% penicillin–streptomycin at 37 °C in a humidified atmosphere of 5% CO2. Cells were routinely sub-cultured and trypsinised at 80% confluence and used between passages 3 and 6, with medium changes every 2 and 3 d. To induce fibrosis, 25 000 cells cm−2 were seeded in 24 or 48-well plates and after 24 h, the media changed to media containing 100 μM L-ascorbic acid 2-phosphate sesquimagnesium salt hydrate, 100 μg ml−1 500 kDa dextran sulphate, the MMC agent used, and 5 ng ml−1 TGFβ1 [63]. Core–shell hydrogels, loaded with antifibrotic compounds during the fabrication process (3 μM TSA and 150 nM T122bt [74] at the shell and core compartments, respectively) were added to the cells at the same time as the MMC/TGFβ1 media change and cultured for 4, 7 and 10 d. The same molecules (at 1 μM and 50 nM, respectively) were also added directly to the media (alone and together), to act as positive control groups. Media were changed every 3 d and read outs were obtained after 4, 7 and 10 d.
2.7. TSA and T122bt release assays
A solution of TSA was added to the shell compartment of the 1 mM PEG shell/2 mM PEG core hydrogels at the time of their formation for a final concentration of 3 μM. A solution of T122bt was added to the core compartment of the 1 mM PEG shell/2 mM PEG core hydrogels at the time of their formation for a final concentration of 150 nM. After gelling, the core–shell hydrogels were added to the cells under the induced fibrotic model, immersed in 0.5 ml of complete media and cultured for up to 10 d. Aliquots of 100 μl were removed at 0, 1 and 2 d, while at days 4, 7 and 10, 250 μl were removed and replaced with fresh complete culture media. Quantification of cumulative released TSA and T122bt were assessed through high performance liquid chromatography (HPLC) and SDS-PAGE, respectively.
Regarding TSA, quantification was performed using a Shimadzu Prominence-I LC-2030 Plus (Shimadzu Corporation, Japan). Chromatographic separation was achieved through an InfinityLab Poroshell 120 SB-C18 column (4.6 mm × 150 mm; 2.7 μm, Agilent, USA) with two mobile phases, A and B. As previously reported in the literature [75], mobile phase A was prepared as a 0.1% v/v orthophosphoric acid solution, while mobile phase B as a acetonitrile solution with a linear gradient program. This program was implemented by achieving certain ratios of mobile phase B at predetermined times [min/% B: 0/10, 7/65, 8/10 and 12/40], while using a 10.0 μl injection volume and maintaining a flow rate of 0.6 ml min−1 and the column temperature at 25 °C. Standard and sample solutions were prepared using a diluent solution (water, acetonitrile and formic acid at a ratio of 65:35:0.1). Samples were then detected and quantified at 272 nm and data were analysed with the Shimadzu LabSolutions CS software (Shimadzu Corporation, Japan).
As for T122bt quantification, at the appropriate time points, culture media was aspirated, the remnants of the collagen systems were removed and cell supernatant was analysed by SDS-PAGE as described elsewhere [73], with adapted polyacrylamide percentages. Briefly, culture media were aspirated, denatured at 95 °C and resolved under non-reducing conditions using in-house resolving and stacking polyacrylamide gels (12% and 6%, respectively) on a Mini-Protean 3 (Bio-Rad Laboratories, UK) system. Samples were stained using a SilverQuest™ Silver Staining Kit (Invitrogen, Ireland) according to the manufacturer's instructions. T122bt release was quantified through densitometric analysis of the present T122bt SDS-PAGE bands using ImageJ software (NIH, USA).
2.8. Electrophoresis analysis
At each time point, the cell culture media and the collagen hydrogels were removed and the cell layers were analysed by SDS-PAGE [73]. Briefly, the cell layers were washed with PBS and digested with 0.1 mg ml−1 pepsin solution (porcine gastric mucosa, 3500–4200 U mg−1, catalogue number: P6887) in 0.5 M acetic acid. The cell layers were then scraped, neutralised with 1 M NaOH, denatured at 95 °C and resolved under non-reducing conditions using in-house resolving and stacking polyacrylamide gels (5% and 3%, respectively) on a Mini-Protean 3 (Bio-Rad Laboratories, UK) system. Purified collagen type I (Symatese, France) was used as standard. Samples were stained using a SilverQuest™ Silver Staining Kit (Invitrogen, Ireland) according to the manufacturer's instructions. Densitometric analysis was performed for α1(I), α2(I), β11(I), β12(I) or γ(I) bands, as appropriate, using ImageJ software (NIH, USA) and collagen concentration was normalised to DNA quantity.
2.9. Immunocytochemistry analysis
At each time point, the cell culture media and the collagen hydrogels were removed, the cells were washed with PBS for 5 min, fixed with 4% paraformaldehyde in PBS at pH 7.4 for 15 min at room temperature and washed three times with PBS for 5 min each time. For intracellular markers, cells were permeabilised with 0.25% Triton X-100 in PBS for 10 min and then washed three times with PBS for 5 min each time. Cells were then blocked with 5%–7.5% donkey serum in PBS for 1 h at room temperature, after which they were incubated with primary antibody (rabbit anti-human collagen type I, 1:300, PA2140-2, Boosterbio, USA; mouse anti-human αSMA, 1:300, ab7817, Abcam, UK; rabbit anti-human collagen type III, 1:300, ab7778, Abcam, UK) for either 90 min (Col I and αSMA) at room temperature or overnight at 4 °C (Col III). Samples were then washed three times with PBS and incubated with secondary antibodies (Alexa Fluor™ 594 donkey anti-rabbit, 1:500, R37119 or Alexa Fluor™ 488 goat anti-mouse, 1:400, A-11 001; both from Thermo Fisher Scientific, USA) for 60 min at room temperature. Cell nuclei were counterstained with DAPI for 5 min at room temperature and samples were washed three times with PBS. Samples were then imaged with an inverted fluorescence microscope (Olympus IX-81, Olympus Corporation, Japan) and further processed with ImageJ software (NIH, USA).
2.10. Cell proliferation analysis
The Quant-iT™ PicoGreen™ dsDNA Assay Kit (Invitrogen, USA) was used to quantify DNA concentration as per the manufacturer's instructions. Briefly, at each time point, the cell culture media and the collagen hydrogels were removed, the cells were washed with PBS for 5 min, ultrapure water was added and three cycles of freezing at −80 °C and thawing at 37 °C to promote cell lysis were conducted. A range (0.2–4 μg ml−1) of standard DNA concentrations in ultrapure water was prepared. Samples and standards were mixed with 10 mM Tris-HCl and 1 mM ethylenediaminetetraacetic acid buffer (pH 7.5) and PicoGreen™ reagent and incubated in the dark for 5 min at room temperature. Fluorescence was measured at 480 nm excitation and 520 nm emission with a Varioskan Flash Spectral scanning multimode reader (Thermo Fisher Scientific, USA).
2.11. Cell metabolic activity analysis
Cell metabolic activity was quantified using the alamarBlue® Cell Viability assay (Thermo Fisher Scientific, USA) as per the manufacturer's instructions. Briefly, at each time point, the cell culture media and the collagen hydrogels were removed, the cells were washed with PBS for 5 min and incubated with a 10% alamarBlue® solution in PBS for 3 h at 37 °C in a humidified atmosphere of 5% CO2. Absorbance was then measured at 550 nm and 595 nm with a Varioskan Flash Spectral scanning multimode reader (Thermo Scientific, USA). Cell metabolic activity was expressed on terms of percentage reduction of the alamarBlue® dye and normalised to DNA content and to the non-treated control.
2.12. Cell viability analysis
Cell viability was assessed using staining with calcein AM (live cell marker, Invitrogen, USA) and ethidium homodimer I (dead cell marker, Invitrogen, USA). Briefly, at each time point, the cell culture media and the collagen hydrogels were removed, the cells were carefully washed with PBS and incubated with a solution of 4 μM calcein AM and 2 μM ethidium homodimer I in PBS for 30 min at 37 °C in a humidified atmosphere of 5% CO2. Cells were then imaged with an inverted fluorescence microscope Olympus IX-81 (Olympus Corporation, Japan), using the FITC filter for calcein AM and the Texas Red filter for ethidium homodimer and further processed with ImageJ software (NIH, USA).
2.13. Statistical analysis
Statistical evaluation of the data was performed using MiniTab® version 17 (Minitab Inc., USA). All data are expressed as mean value ± standard deviation. Datasets were assessed for normal distribution (Anderson–Darling test) and equal variance (Bartlett's and Levene's test for homogeneity of variances). When either or both assumptions were violated, non-parametric analysis was conducted using Kruskall–Wallis test for multiple comparisons and Mann–Whitney U test for pairwise comparisons. For samples that were confirmed to follow both parametric analysis assumptions, one-way ANOVA was used for multiple comparisons and Tukey's post hoc test was used for pairwise comparisons. Statistical significance was accepted at p < 0.05.
3. Results
3.1. FITC-dextran release analysis
Quantification of released FITC-dextran revealed that the 0.5 mM PEG shell/1 mM PEG core hydrogel released ∼80% of FITC-dextran within 2 d, whilst the 1 mM PEG shell/2 mM PEG core hydrogel released ∼30% of FITC-dextran after 7 d (supplementary figure S2). For this reason, the 1 mM PEG shell/2 mM PEG core hydrogel was chosen for further analysis.
3.2. Biomechanical analysis
Compression testing analysis (table 1) revealed that PEG crosslinking significantly (p < 0.05) increased stress at failure and compression modulus of both compartments and significantly (p < 0.05) reduced strain at failure of the shell compartment. Typical stress–strain curves for collagen-based materials, characterised by the presence of both elastic and plastic deformation behaviour were obtained (supplementary figure S3).
Table 1. Comparison testing biomechanical analysis of NCL non-core–shell hydrogels and crosslinked core–shell modular hydrogels. Statistical analysis through one-way ANOVA and Tukey's post-hoc comparison test or Kruskal Wallis and Mann Whitney post-hoc analysis where appropriate, +: indicates significant (p < 0.05) increase. #: indicates significant (p < 0.05) decrease. n = 6.
| Stress at failure (kPa) | Strain at failure (mm mm−1) | Compression modulus (kPa) | ||
|---|---|---|---|---|
| NCL, non-core–shell hydrogel | 4.9 ± 1.6 | 0.38 ± 0.06 | 16.6 ± 4.2 | |
| Core–shell hydrogel | Shell 1 mM PEG | 8.2 ± 1.9 + | 0.28 ± 0.03 # | 57.8 ± 21.8 + |
| Core 2 mM PEG | 13.2 ± 4.8 + | 0.42 ± 0.04 | 88.8 ± 47.6 + | |
3.3. Antifibrotic release and effect analyses
SDS-PAGE and HPLC quantification revealed that core (T122bt)-shell (TSA) hydrogels promoted a sustained release of the encapsulated cargos over time, resulting in 27.72% ± 1.98% of released TSA and 51.51% ± 20.94% of released T122bt after 10 d, which equates to concentrations of 0.83 ± 0.06 μM and 77.27 ± 31.41 nM in the media (figures 2 and S4).

Figure 2. Core (T122bt)-shell (TSA) hydrogels promoted a sustained release of TSA and T122bt over time. Release profile over time of TSA (shell) and T122bt (core) enclosed in a core–shell hydrogel system and crosslinked with 1 (shell) and 2 (core) mM PEG placed on top of cultured DF and submerged under complete culture media. The hydrogel systems resulted in an approximate release of 28% and 52% of TSA and T122bt, respectively (n = 3 and 4).
Download figure:
Standard image High-resolution imageStarting with collagen deposition via SDS-PAGE and complementary densitometric quantification of α(I)1 and α(I)2 chains (figure 3), it revealed that at day 4, the core–shell and core (T122bt)-shell groups induced significantly (p < 0.05) higher collagen deposition than the +MMC + TGFβ1 group. At day 7, all core–shell hydrogel groups induced significantly (p < 0.05) lower collagen deposition than the +MMC + TGFβ1 group. At day 10, all groups except the core–shell and T122bt alone induced significantly (p < 0.05) lower collagen deposition than the +MMC + TGFβ1 group. At the same time point, the core–shell (TSA), core (T122bt)-shell and TSA-T122bt alone groups also induced significantly (p < 0.05) lower collagen deposition than the core–shell group. Among all drug groups, at day 7, the core–shell (TSA) hydrogel group and at day 10, the TSA-T122bt alone group induced the lowest collagen deposition, in comparison to the +MMC + TGF group (p < 0.05). No significant (p > 0.05) changes in the deposition of β11(I), β12(I) dimers and γ(I) trimers were observed (supplementary figure S5).

Figure 3. Treatment with antifibrotic-loaded hydrogels affects collagen type I deposition. The dual delivery of TSA and T122bt through the core–shell collagen hydrogel resulted in a decrease of deposited collagen type I at days 7 and 10. The C-S(TSA); C(T122bt)-S and C(T122bt)-S(TSA) groups at day 7 and the C-S(TSA), C(T122bt)-S and the TSA-T122bt alone groups at day 10 induced the lowest collagen type I deposition in comparison to the +MMC + TGFβ1 group, as revealed by SDS-PAGE (A) and densitometry of α(I)1 and α(I)2 bands (B). Col I STD: 0.1 mg ml−1. Statistical analysis through one-way ANOVA and Tukey's post-hoc comparison test, + indicates a statistically significant increase compared to the +MMC + TGFβ1 group of the same time point, # indicates a statistically significant decrease compared to the +MMC + TGFβ1 group of the same time point, $ indicates a statistically significant decrease compared to the +MMC + TGFβ1 + C-S group of the same time point, p < 0.05 (n = 3).
Download figure:
Standard image High-resolution imageImmunocytochemistry (figure 4(A)) and complementary image intensity analysis (figure 4(B)) made apparent that among all drug groups, at day 7 the TSA alone group and at day 10 the TSA alone group and the TSA-T122bt alone group induced the lowest (p < 0.05) collagen type I deposition, in comparison to the +MMC + TGF group.

Figure 4. Treatment with antifibrotic-loaded hydrogels and antifibrotic drugs alone affects collagen type I deposition. Immunocytochemistry (A) and image intensity analyses (B) revealed no differences in collagen type I deposition between the groups at day 4, while the TSA group alone induced the highest decrease at days 7 and 10 when compared to the +MMC + TGFβ1 group (p < 0.05). Scale bar: 100 μm. Kruskal Wallis and Mann Whitney post-hoc analysis were conducted, + indicates a statistically significant increase compared to the +MMC + TGFβ1 group of the same time point, # indicates a statistically significant decrease compared to the +MMC + TGFβ1 group of the same time point, $ indicates a statistically significant decrease compared to the C-S group of the same time point, p < 0.05 (n = 3).
Download figure:
Standard image High-resolution imageImmunocytochemistry (figure 5(A)) and complementary image intensity analysis (figure 5(B)) made apparent that no significant (p < 0.05) differences were observed in collagen type III expression between any of the drug groups and the +MMC + TGF group, while at day 7 the core (T122bt)-shell (TSA) and TSA alone groups significantly (p < 0.05) decreased its deposition when compared to the core–shell group.

Figure 5. Different treatments did not affect collagen type III expression when compared to the +MMC + TGFβ1 group. Immunocytochemistry (A) and image intensity analyses (B) revealed no differences were observed in collagen type III expression between the groups at all time points when compared to the +MMC + TGFβ1 group, while the core (T122bt)-shell (TSA) group induced a significant difference when compared with the C-S group at day 7 (p < 0.05). Scale bar: 100 μm. One-way ANOVA and Tukey's post-hoc comparison test or Kruskal Wallis and Mann Whitney post-hoc analysis were conducted. $ indicates a statistically significant decrease compared to the core–shell group of the same time point, p < 0.05 (n = 3).
Download figure:
Standard image High-resolution imageImmunocytochemistry (figure 6(A)) and complementary image intensity analysis (figure 6(B)) made apparent that among all drug groups, at day 4, the TSA alone group and the TSA-T122bt alone group; at day 7, the core (T122bt)-shell (TSA) hydrogel group, the TSA alone group and the TSA-T122bt alone group; and at day 10, the TSA alone group and the TSA-T122bt alone group induced the lowest (p < 0.05) αSMA expression, all in comparison to the +MMC + TGF group.

Figure 6. Treatment with core (T122bt)-shell (TSA), TSA and TSA-T122bt alone resulted in the highest decrease in αSMA expression. Immunocytochemistry (A) and image intensity analyses (B) revealed that TSA and TSA-T122b alone induced the highest decrease in αSMA expression at day 4, while at day 7 this was observed for the core (T122bt)-shell (TSA), TSA and TSA-T122bt alone groups and at day 10 for the TSA and TSA-T122bt groups when compared to the +MMC + TGFβ1 group (p < 0.05). The core (T122bt)-shell (TSA) group also resulted in a decrease in αSMA expression at all time points when compared to the +MMC + TGFβ1 (p < 0.05). Scale bar: 100 μm. One-way ANOVA and Tukey's post-hoc comparison test or Kruskal Wallis and Mann Whitney post-hoc analysis were conducted, + indicates a statistically significant increase compared to the +MMC + TGFβ1 group of the same time point, # indicates a statistically significant decrease compared to the +MMC + TGFβ1 group of the same time point, $ indicates a statistically significant decrease compared to the C-S group of the same time point, p < 0.05 (n = 3).
Download figure:
Standard image High-resolution imageWith respect to basic cellular function analysis, at day 4, the TSA-T122bt alone group and at day 7 and day 10, the shell (TSA) hydrogel group and the TSA-T122bt alone group induced the lowest (p < 0.05) DNA concentration (figure 7(A)). The shell (TSA) hydrogel group induced the highest metabolic activity at day 7 and day 10 (figure 7(B)). Treatment with TSA alone at day 4 and TSA-T122bt alone at all time points decreased cell viability, which was ameliorated when delivered through the core (T122bt)-shell (TSA) system (figure 8).
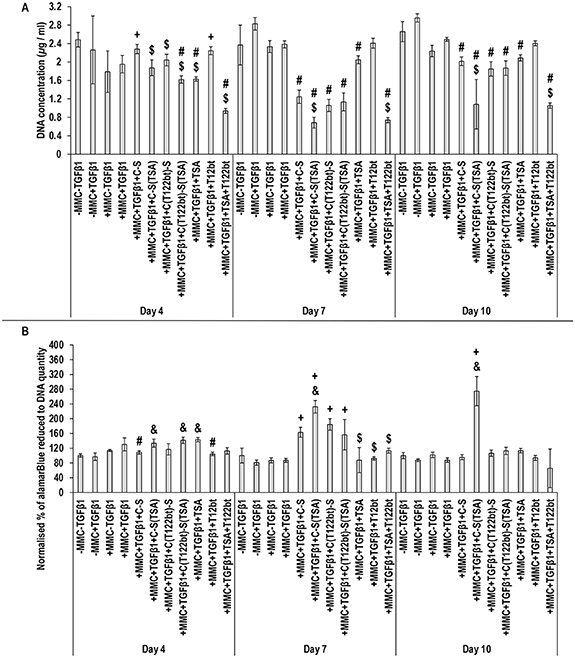
Figure 7. Treatment with an antifibrotic encapsulating modular hydrogel ameliorates the effect on cell proliferation and metabolic activity compared to supplementation with the drugs alone. Analysis of cell proliferation (PicoGreen™) (A) and normalised metabolic activity to DNA quantity (alamarBlue™) (B) after 4, 7 and 10 d in culture and supplementation with +MMC + TGFβ1 and different combinations of TSA, T122bt and a C-S hydrogel system. Treatment with TSA-T122bt alone resulted in the highest decrease of cell proliferation, which was alleviated when delivered through the hydrogel system (p < 0.05). C-S(TSA) resulted in the highest increase in metabolic activity at days 7 and 10, which was also reduced when coupled with T122bt (p < 0.05). Statistical analysis through one-way ANOVA and Tukey's post-hoc comparison test or Kruskal Wallis and Mann Whitney post-hoc analysis where appropriate, + indicates a statistically significant increase compared to the +MMC + TGFβ1 group of the same time point, # indicates a statistically significant decrease compared to the +MMC + TGFβ1 group of the same time point, & indicates a statistically significant increase compared to the +MMC + TGFβ1 + C-S group of the same time point, $ indicates a statistically significant decrease compared to the +MMC + TGFβ1 + C-S group of the same time point, p < 0.05 (n = 3).
Download figure:
Standard image High-resolution image
Figure 8. Treatment with an antifibrotic encapsulating C-S hydrogel ameliorates the decrease on cell viability compared to supplementation with the drugs alone. Analysis of cell viability through calcein AM (green, viable cells) and ethidium homodimer (red, non-viable cells) fluorescence staining after 4, 7 and 10 d in culture and supplementation with +MMC + TGFβ1 and with different combinations of hydrogels, TSA and T122bt. Treatment with TSA alone at day 4 and TSA-T122bt alone at all time points decreased cell viability, which was ameliorated when delivered through the core (T122bt)-shell (TSA) system. Scale bar: 100 μm (n = 3).
Download figure:
Standard image High-resolution image
Confocal microscopy showed that DFs migrated into the collagen hydrogels during the treatment period, presenting a lower viability in the hydrogels containing TSA (supplementary figure S6).
4. Discussion
Considering the fibrosis is a multi-stage process, it is unlikely that single-molecule therapies will lead to functional therapeutic outcomes. Although intralesional injections of multiple molecules are extensively used in clinical practice, the mode of administration offers little control over the cargos' protection, localisation and bioavailability, which has triggered investigation into vehicle-based multi-delivery systems. Considering the above, herein we developed and characterised a core (loaded with a TGFβ trap)/shell (loaded with TSA) collagen type I hydrogel system and assessed its antifibrotic potential in an in vitro fibrosis model.
Collagen crosslinking with PEG significantly improved the biomechanical and drug release properties of the produced hydrogels. Starting with biomechanical analysis, the collagen hydrogels showed a typical stress–strain curve of semi-crystalline polymers that experience both elastic and plastic deformation [76, 77]. Crosslinking resulted in increased resistance to mechanical forces, as has been well-documented previously in the literature with PEG crosslinked collagen fibres [45, 78], films [46, 47, 79], sponges [80, 81] and hydrogels [44, 82], as well as gelatin hydrogels [83] and scleral collagen [84]. Moving into molecular loading and release, crosslinking restrained the release of the encapsulated FITC-dextran, TSA and T122bt, which can be attributed to the resultant tight molecular structure that increases resistance to degradation and slows down the diffusion process [85–90]. With respect to the release profile capacity, ∼10% and 30% of the TSA was released from the shell after 1 and 10 d, respectively, and ∼30% of the TGFβ1 trap was released from the core within the 1st day and the same level of release was maintained for up to 10 d. We recognise that the TGFβ1 trap exhibited a rather burst release at the beginning, which we attribute to the fabrication method, during which some of the water-soluble TGFβ1 trap was diffused from the core layer to the shell layer and from there was released to the media. The same issue has been reported previously in the literature when a double-layer alginate-carboxymethyl cellulose hydrogel system was used [91]. It is worth noting that similar bioactive/therapeutic molecules release profiles from crosslinked collagen scaffolds have been observed over the years (details of indicative examples are provided in supplementary table S3). We feel that appropriate one-step multi-compartment scaffold fabrication, crosslinking density optimisation and/or affinity/covalent-based drug incorporation may offer more accurate pharmacokinetics of the encapsulated cargos.
When the produced collagen hydrogel system was put to the test in the in vitro fibrosis model, an increased at the early time point (day 4), followed by a decreased at the later time points (day 7 and day 10) collagen deposition was detected. We attribute the initial (day 4) collagen increase to the collagen hydrogel degradation, which may have occurred due to the action of secreted [17, 92] and media present [93] matrix metalloproteinases. Some chemoprotection of the TGFβ1 by the collagen hydrogel cannot be excluded as well, considering the strong affinity of TGFβ1 to collagen scaffolds [94] and that TGFβ1 has a half-time ranging from 2 to 100 min [95], which can be prolonged when bound to ECM molecules [96] or synthetic molecules, such as PEG [97]. At later time points (day 7 and day 10), although treatment with TGFβ trap on its own was not enough to elicit a significant decrease in collagen deposition and while TSA proved to be effective in that regard, we observed substantial additive effect when the molecules were delivered in tandem through the core–shell hydrogel system. In line with the inhibition on collagen type I expression, we also detected a reduction in myofibroblasts with the combination of TSA and TGFβ trap in the core–shell hydrogel. Both these observations validate our hypothesis, considering that TSA is an inhibitor of HDACs, which alters gene expression by altering the access of transcription factors to DNA; reduces myofibroblast transformation, collagen deposition and cellular proliferation; and promotes cellular apoptosis in experimental skin fibrosis models [54–56]. TGFβ1, in turn, is a key growth factor in many fibrotic conditions [41], due to its role in transforming fibroblasts into myofibroblasts and increasing collagen type I deposition [98, 99], and as such, a TGFβ1 trap constitutes a therapeutic agent of interest in the treatment and prevention of skin fibrosis. In addition to fibrosis modulation, it is also worth pointing out that the dual delivery of TSA and T122bt through the hydrogel system had a beneficial cellular function effect compared to monomolecular delivery or no-carrier delivery approaches. These data therefore further support the notion of combination approach to inhibit and/or restrain fibrosis, as it has been documented previously (supplementary table S1).
Considering the innate complexity (multiple cells, molecules and spatiotemporal events) of wound healing, combinational therapies are continuously gaining pace in clinical practice, especially in difficult to heal wounds (e.g. diabetic wound healing [100–104], burns [101, 105–108], hypertrophic scars and keloids [20–25]). The beneficial effects of single-compartment/dual delivery vehicles have been well established in the wound healing literature for simultaneous delivery of therapeutics [109–112]. Better understanding of biological processes coupled with recent advancements in biomaterials engineering (e.g. layer-by-layer [113–115], core–shell [116–118]) now allow for the development of multi-compartment and multi-delivery vehicles for sustained, localised and overlapping/sequential delivery of bioactive/therapeutic molecules for a diverse range of clinical indications. In this spirit, herein we developed a core–shell collagen hydrogel system for overlapping/sequential release of TSA from the shell and a TGFβ1 trap from the core in order to supress cell proliferation and simultaneously or subsequently supress αSMA expression and collagen synthesis. Pharmacokinetics analysis revealed that using a collagen hydrogel system that allows for molecular diffusion, overlapping release of the TSA and the TGFβ1 trap (∼30%) in the 1st 10 d (longest time point assessed) was observed. For sequential release, more potent, but still cytocompatible, crosslinking methods (supplementary table S3) for the core compartment should be assessed. It is also worth noting that the developed hydrogels retained their structural stability for 10 d in culture (longest time point assessed) and similar systems have been shown to maintain their integrity and cargo release capacity for up to 16 weeks in preclinical setting without any notable side effects (supplementary table S4), clearly illustrating the clinical relevance of the produced system.
5. Conclusions
Contemporary drug delivery systems aspire to target simultaneously multiple signalling pathways for functional therapeutic outcomes. Multi-molecular therapies are progressively gaining pace in scar-wars, considering the number of cells, molecules and signalling pathways involved in fibrosis manifestation, progression and establishment. In this context, we developed a core (loaded with a TGFβ trap)/shell (loaded with TSA) collagen type I hydrogel system, the antifibrotic capacity of which was assessed in an in vitro fibrosis model. Our data illustrate that the core–shell hydrogel system allowed for sustained release of the antifibrotic molecules, resulting in significant decrease, in comparison to the control group, in collagen type I deposition, αSMA expression and cellular proliferation and viability. On the other hand, direct TGFβ trap and TSA supplementation induced the lowest collagen type I deposition, αSMA expression and cellular proliferation and viability. Our data further support the use of multi-compartment and multi-delivery systems for sustained delivery of antifibrotic molecules.
Acknowledgments
The authors want to thank Mrs Marianne Karlsberg for recombinant protein expression and purification.
Data availability statement
The data that support the findings of this study are available upon reasonable request from the authors.
Conflict of interest
J Z is the owner of the TGFβ trap of the study. J Q C, A D N, U M, S P, T A H J and D I Z declare no conflict of interest. The funders had no role in the design; in the collection, analyses, or interpretation of data; in the writing of the manuscript, or in the decision to publish the results.
Author contributions
J Q C, T A H J, D I Z Methodology: J Q C, A D N, U M, S P, J Z Data analysis: J Q C. Manuscript writing and editing: J Q C, T A H J, D I Z. Final manuscript approval: All authors.
Funding
This work has received funding from the European Research Council (ERC) under the European Union's Horizon 2020 research and innovation programme, Grant Agreement No. 866126. This publication has emanated from research supported in part by grants from Science Foundation Ireland (SFI) under Grant Numbers 15/CDA/3629 and 19/FFP/6982 and Science Foundation Ireland (SFI) and European Regional Development Fund (ERDF) under Grant Number 13/RC/2073_2. This research was also funded by the Finnish National Agency for Education (EDUFI), Academy of Finland, Päivikki and Sakari Sohlberg Foundation, Tampere Tuberculosis Foundation, Tampere University Hospital Research Fund and Pirkanmaa Hospital District Research Foundation.