

Abstract
A tantalum/tantalum nitride (Ta/TaN) multilayered coating is deposited on plasma-nitridedAZ91 Mg alloy. The top TaN layer undergoes O2 + Ar plasma etching to improve the antibacterial properties and Mg plasma immersion ion implantation (MgPIII) is performed to enhance the biocompatibility and wound healing capability. A uniform, compact, homogeneous, and columnar nanostructured MgPIII and plasma-etched TaN layer with a cluster size of about 17 nm, surface roughness of 0.28 nm, and needle morphology is observed. Although, plasma etching increases the corrosion current density (icorr) from 0.02 to 0.19 µA cm−2 due to larger surface roughness and different potentials between sharp points and smooth points, MgPIII decreases icorr from 0.19 to 0.02 µA cm−2 besides a more positive corrosion potential. The amounts of Mg+2 released to the simulated body fluid (SBF) diminishes from 89.63 ± 0.54 to 60.30 ± 0.47 mg l−1 cm−2 indicating improved corrosion resistance. Under fever conditions (40 °C), icorr decreases by 63%, but the open circuit potential does not change due to the constant chemical composition of the surface as well as thicker double layer and less defects, as confirmed by the larger amount of Mg+2 of 71.49 ± 0.22 mg l−1 cm−2 leached to the SBF. In the self-healing process which occurs via the reactions between the tantalum intermediate layer and electrolytes and penetrating ions through the defects as well as formation of oxide compounds, creation and propagation of defects are deterred as shown the 24 h destructive polarization test in SBF. The combination of plasma etching and MgPIII enhance not only the bacterial resistance and biocompatibility of the super-hard TaN layer by providing the rougher surface on TaN–P–Mg, but also the nano-mechanical properties and anticorrosion properties. As a result, the hardness increases by 7%, elastic modulus decreases by 19%, and the stiffness increases by 21%.
Export citation and abstract BibTeX RIS
1. Introduction
The mechanical properties of biodegradable Mg alloys are closer to those of natural bones compared to many common biometals such as stainless steels and so they have large potential in biomedical applications such as bone fixation and hard tissue repair [1, 2]. The other advantage of Mg alloys is the natural biodegradability in the physiological environment rendering them very attractive as temporary orthopedic implants [3, 4]. However, the physiological conditions in the human body are quite corrosive due to dissolved oxygen, proteins, and electrolyte ions (chloride and hydroxide ions) [1–6], which can accelerate Mg degradation, emit excessive hydrogen, and produce alkalinity in the vicinity of the implants [7].
There are several methods to overcome these hurdles and plasma surface modification is commonly used to improve the corrosion resistance, mechanical properties, and biocompatibility of biomaterials while preserving the favorable bulk attributes [8, 9]. As for protective coatings, some transition metal nitrides such as tantalum nitride (TaN) can improve the surface properties such as corrosion resistance, wear, as well as biocompatibility [10–13]. In fact, a multilayered coating has been shown to have high hardness, excellent wear resistance, corrosion resistance, and scratch resistance due to the combined merits of ceramic and metal layers. Furthermore, the Ta intermediate layer can reduce lattice strain and improve the mechanical properties by decreasing the residual tensile stress [14, 15].
In the physiological environment, bacterial infection is one of the main complications after surgery and antibiotics such as ciprofloxacin or antibacterial elements such as Ag, Au, and so on have been used. However, some of these elements in high concentrations produce toxic effects in vivo and overuse of antibiotics can lead to strong drug resistance [16–25]. Inspired by natural materials such as lotus leaves [20, 26–31], plasma etching is utilized to alter the surface morphology to reduce the contact area between the substrate and bacteria and increase the pressure exerted on the bacteria cell wall resulting in repulsion, cell wall rupturing, and even death of the bacteria. In fact, proper surface modification can simultaneously enhance the corrosion resistance, mechanical properties, and biological properties of Mg-based implants.
The roughness of the super-hard TaN layer is increased by plasma etching in order to reduce the contact area between the TaN layer and bacteria. In this process, an antibacterial and biocompatible super-hard TaN layer is produced without the use of antibiotics or antibacterial agents such as Ag, Cu, and Zn which produce cytotoxicity in high concentrations. However, plasma etching alone cannot produce sufficient surface roughness and therefore, plasma immersion ion impanation (PIII) is carried out subsequently. In fact, the roughness introduced by plasma etching provides nucleation sites to facilitate Mg plasma immersion ion impanation (MgPIII) to produce the optimal roughness on the super-hard TaN layer while improving the biocompatibility. Although there have been investigations on altering the surface roughness of soft biomaterials such as silk [20], there has been little work on super-hard ceramic coatings by the combination of plasma etching and PIII. In this work, a hierarchical Ta/TaN multilayered coating is deposited on the plasma-nitrided AZ91 Mg alloy by high-vacuum magnetron sputtering. The top super-hard TaN layer is processed by plasma etching and MgPIII to improve the antibacterial properties and biocompatibility. The structure, morphology, corrosion characteristics, nano-mechanical properties, electrochemical characteristics, and biological properties are evaluated systematically.
2. Experimental details
2.1. Substrate preparation
The AZ91 Mg alloy obtained from Sichuan HPM Co. Ltd, China was cut into 10 × 10 mm2 pieces with a thickness of 2 mm and polished with sandpaper from 800 to 4000 and diamond paste with a diameter of 0.1–0.3 μm. The polished samples were rinsed ultrasonically for 10 min in acetone, 10 min in alcohol, and 10 min in pure water. Since fluctuations of the surface roughness of the substrate can hide the effects of plasma etching of the MgPIII sample, silicon wafer is used as the substrate for the atomic force microscopy (AFM) images in figure 1, and the AZ91 Mg alloy is used as the substrate for some analyses.
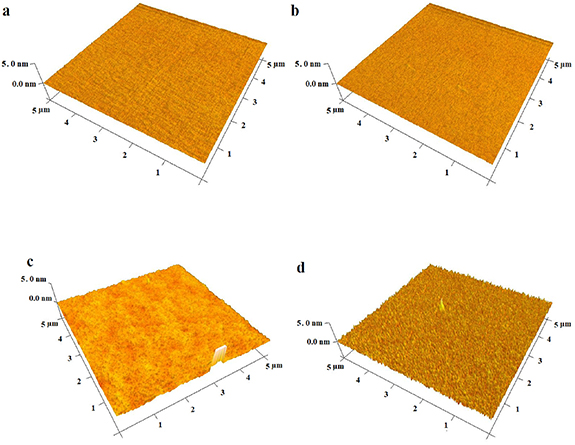
Figure 1. AFM images: (a) TaN, (b) plasma-etched TaN by O2, (c) plasma-etched TaN by O2 + Ar, and (d) TaN–P–Mg with a Z scale of 5 nm.
Download figure:
Standard image High-resolution image2.2. Coating preparation
2.2.1. Nitrogen plasma immersion ion implantation (N-PIII)
The AZ91 Mg alloy samples underwent N-PIII in the PIII and deposition system in the Plasma Laboratory of City University of Hong Kong. The important instrumental parameters were: plasma power of 700 W, frequency of 200 Hz, pulse width of 35 µs, negative high current of 45 mA, base pressure of 2; × 10−1 Pa, and high voltage pulse of −35 kV, and time of 2 h.
2.2.2. Fabrication of Ta/TaN multilayered coating by high-vacuum magnetron sputtering and PIII
The multilayered Ta/TaN coatings were deposited by high-vacuum RF magnetron sputtering (Phase II J, ATC Orion Sputtering System, AJA International Inc.) in the Plasma Laboratory of City University of Hong Kong. The distance between the 99.99% pure Ta target and substrate was 10 cm. A tantalum intermediate layer was deposited before nitrogen was bled into the vacuum chamber to deposit the TaN films on the nitrided AZ91 Mg alloy substrate. The important parameters implemented to deposit the structure, which comprises six alternating layers of Ta and TaN on the nitrided AZ91 Mg alloy, schematically illustrated in figure S1 (available online at stacks.iop.org/BMM/16/045028/mmedia) and listed in table 1. Without breaking vacuum, the Ta/TaN multilayered coating with a green color underwent plasma etching in two steps: oxygen (20 standard cubic centimeters per minute (sccm)) plasma and Ar (18 sccm) + oxygen (2 sccm) plasma for 10 min (7 mTorr and 50 W) [20]. Afterwards, MgPIII was carried out on the HEMII-80 ion implanter (Plasma Technology Ltd) equipped with a Mg cathodic arc source at 30 kV and 3.3 mA for 30 min at a base pressure of 1.3 × 10⁻³Pa. The samples with the Ta/TaN structure, plasma-etched Ta/TaN, and MgPIII plasma-etched Ta/TaN multilayered coating were designated as TaN, TaN–P, and TaN–P–Mg, respectively.
Table 1. Important instrumental conditions for the deposition of Ta/TaN multilayered nanostructured coatings.
| Parameter | Power (watt) | Pressure (mTorr) | Ar gas flow (sccm) | N2 gas flow (sccm) | Time (min) |
|---|---|---|---|---|---|
| Ta 1st layer | 250 | 3.2 | 15 | — | 10 |
| TaN 2th layer | 250 | 3.8 | 15 | 10 | 20 |
| Ta 3th layer | 250 | 3.2 | 15 | — | 10 |
| TaN 4th layer | 250 | 3.3 | 15 | 1.5 | 30 |
| Ta 5th layer | 250 | 3.2 | 15 | — | 10 |
| TaN top layer | 250 | 3.8 | 15 | 10 | 40 |
2.3. Characterization
2.3.1. Structural assessment
coating thickness is employed to phase, structure, chemical composition, and morphology of the coatings were determined by grazing‐incidence x‐ray diffraction (GIXRD; Philips PW‐1730 x‐ray diffractometer; Cu Kα, λ = 0.154056 nm), x-ray photoelectron spectroscopy (XPS, PHI 5802) using monochromatic Al Kα radiation, field‐emission scanning electron microscopy (FE-SEM; MIRA3 TESCAN) and atomic force microscopy (AFM, Nanoscope VMulti Mode System, Veeco, City University of Hong Kong). The thickness of the coatings was determined from the XPS depth profile and the contact angles were determined on the contact angle goniometer (model 200-00-115, Rameé-Hart Instrument Co.) at ambient temperature using 5 μl water droplets and ethylene glycol. The surface energy was determined by the DROP image standard software (harmonic mode) and Owens–Wendt method [20].
2.3.2. Corrosion properties
The corrosion test was performed in a simulated body fluid (SBF) containing 7.996 g of NaCl, 0.35 g of NaHCO3, 0.224 g of KCl, 0.228 g of K2HPO4.3H2O, 0.305 g of MgCl2⋅6H2O, 40 ml of 1 M HCl, 0.278 g of CaCl2, 0.071 g of Na2SO4, and 6.057 g of (CH2OH)3CNH2 at 37 °C and the pH was adjusted to 7.25 with 1 M HCl. Electrochemical impedance spectroscopy (EIS) and potentiodynamic polarization tests were performed on the electrochemical workstation (Zennium, Zahner, Germany). The corrosion characteristics were evaluated in a cell composed of the working, reference, and auxiliary electrodes in 250 ml of SBF. The surface area was about 1 cm2. The open circuit potential (OCP) was obtained from the 37 °C SBF after immersion for 2100 s and then EIS was performed from 10−1 to 105 Hz by applying 10 mV as the amplitude and a frequency of 20 mHz in the sweeping mode. In the potentiodynamic polarization test, the scanning range was from −250 mV to +1000 mV versus the OCP with a 1 mV s−1 scanning rate. The corrosion current (icorr) and voltage (Ecorr) were determined by Tafel extrapolation. To investigate the corrosion mechanism of the coatings, impedance tests were performed at 1, 24, 48, and 72 h, followed by potentiodynamic polarization after immersion in SBF for 72 h. The effects of fever conditions on the corrosion behavior of TaN–P–Mg were studied by impedance tests after immersion for 72 h in SBF solution at 37 °C (healthy condition) and 40 °C (fever condition) and the polarization test was done after immersion for 72 h in SBF solution. The self-healing behavior was investigated by impedance tests after destructive polarization tests for 1 and 24 h during immersion in SBF solution at 37 °C. The corroded surfaces of TaN and TaN–P–Mg were examined by GIXRD at an incident angle of 3° and inductively-coupled plasma mass spectrometry (ICP-MS, PerkinElmer Optima 2100 DV) was performed to determine the amount of Mg+2 ions leached into the SBF after the polarization test.
2.3.3. Nano-mechanical properties
The nano-mechanical properties such as the Young's modulus (E) and hardness were determined by nano-hardness tests conducted on the Bruker Hysitron TriboScopeat Iran University of Science and Technology. Nano-indenters with a spherical diamond tip (radius of 1 μm) by D.R. U.D. Hangen, SURFACE, Huckelhoven were installed on the NanoScope III AFM. This test was done using the load control method [32], in which the load applied to the indenter was increased gradually up to a predetermined maximum value and then reduced continuously to zero (maximum load = 1279 µN, loading and unloading rate = −0.03 µN, segment time = 0.01 s and time duration = 32 505.39 s). The load and relevant diamond tip displacement were recorded and the hardness and elastic modulus were determined from the continuous loading and unloading curves by the Oliver-Phar method [33]. Nano-scratch tests were done under a normal force of 1000 µN with a scratching length of 6 µm and scratching velocity 0.5 µm s−1 to determine the wear mechanism and friction coefficient. To improve the statistics, each test was repeated five times on five random sites on the sample surface at least 200 µm apart and also from the sample edge to determine the average. The adhesion strength was determined on a micro-scratch tester with a diamond tip (radius of 100 µm). The critical load, L, was defined as the smallest load at which the coatings started to delaminate from the nitride AZ91 Mg alloy substrate along with sharply increased depth of indenter.
2.3.4. Bacteria and cell studies
More details about the bacteria and cell procedures can be found in the literature [20]. In brief, E. coli (Escherichia coli) (ATCC 25922) bacteria were activated by growing in the Lysogeny broth medium in a 37 °C incubator and agitated at 220 rpm overnight. After activation, the optical density of the bacteria was monitored at 600 nm and tuned to 0.1 (OD600 = 0.1) by adding the fresh medium and reactivation for 3 h. Before seeding the bacteria, the samples were exposed to UV for more than 1 h. The bacteria containing the solution were diluted to (2–3) × 105 CFU ml−1 and 100 µl of the solution were spread on the surface of the nitrided AZ91 Mg alloy as the control as well as the TaN, TaN–P, and TaN–P–Mg specimens. At time points of 6 and 24 h, the samples were examined by SEM. Prior to SEM observation, the culture medium was removed and the samples were washed to remove unattached bacteria and fixed with 2.5% glutaraldehyde overnight. The samples were dehydrated with a series of ethanol solutions (10, 30, 50, 75, and 96%) and dried at room temperature.
The MC3T3-E1 (Cell bank of the Chinese Academy of Sciences) osteoblast cell line was used in the cell study. The cells were cultivated on Petri dishes in an incubator under 95% air and 5% CO2 at a relative humidity of about 90%. After detaching the cells with Trypsin (Gibco, Life Technologies Corporation, USA), 100 µl of the cell suspension with a concentration of about 20 000 MC3T3 ml−1 were seeded on the samples with 1 ml of the DMEM medium on a 24-well plate. The MTT assays were performed after one, four and seven days.
2.4. Statistical analysis
3. Result and discussion
Plasma etching was performed in two steps: O2 and a mixture of O2 and Ar [18]. Figure 1 shows the AFM images of TaN, plasma-etched TaN, and TaN–P–Mg deposited on the silicon wafer. The surface roughness (Sa ) and average maximum peak height ranges (Rz) are summarized in table 2 to compare the roughness changes without interference from surface roughness of the AZ91 Mg specimens as substrates. S-filter was used to separate the waviness from roughness and eliminate the smallest scale elements from the surface (low-pass filter). The noise due to edges is removed and the cutoff wavelength is equal to or more than three times the measurement resolution of the XY plane (horizontal plane) used. Plasma etching by O2 has a diverse effect and decreases the roughness and Z range compared to the untreated TaN sample. In comparison, plasma etching by O2 and Ar increases the surface roughness and Rz range of TaN to 0.20 nm and 0.58 nm, respectively. MgPIII increases Sa and Rz range further by 0.28 nm and 0.79 nm, respectively, and a TaN layer with a needle morphology (figure 1(d)) is formed by to provide more nucleation sites for plasma etching and PIII. Therefore, in the subsequent experiments, plasma etching by O2 + Ar is adopted.
Table 2. Surface roughness of the nitrided AZ91 Mg alloy, TaN, TaN–P, and TaN–P–Mg specimens.
| TaN–P | ||||
|---|---|---|---|---|
| Sample | TaN | O2 | O2 + Ar | TaN–P–Mg |
| Surface roughness (Sa ) (nm) | 0.07 ± 0.01 | 0.05 ± 0.01 | 0.20 ± 0.02 | 0.28 ± 0.05 |
| Rz (nm) | 0.19 ± 0.03 | 0.10 ± 0.06 | 0.58 ± 0.0.7 | 0.79 ± 0.16 |
According to the standard phase cards TaN (01-074-0226), TaNO (01-071-0178), tantalum (01-088-2338), tantalum oxide (01-071-1077), MgO (00-003-0998), Mg3N2 (00-001-1289), the GIXRD patterns of the nitrided AZ91 Mg alloy, TaN, TaN–P, and TaN–P–Mg multilayer at the two incident angles of 1° and 5° in figure 2 reveal a cubic crystalline Mg3N2 layer on the nitrided AZ91 Mg alloy with diffraction planes of (321), (400), and (611) at 34.46°, 36.72° and 57.65°, respectively, and a crystallite size of 30.42 nm (figure S2(a)). The GIXRD pattern of TaN confirms formation of tantalum nitride along with tantalum with hexagonal and cubic structures, respectively. Tantalum nitride shows diffraction planes of (110), (111), and (112) at 25.33°, 33.38°, and 52.32°, respectively, besides a crystallite size of 3.0 nm and lattice strain of 6.07% as determined by Williamson–Hall Method [38, 39]. Tantalum show diffraction planes of (111) and (220) at 37.94° and 63.84°, respectively, confirming the nanocrystalline α-Ta phase with a crystallite size of 12.0 nm and lattice strain of 0.61%. The GIXRD pattern of TaN–P demonstrate that plasma etching forms TaN in addition to TaNO with the monoclinic structure as shown by diffraction planes of (111), (002), and (−122) at 32.58°, 35.07°, and 52.89°, respectively, and crystallite size of 7.0 nm and lattice strain of 1.79%. MgPIII enhances the nanostructure of the plasma-etched TaN and introduces more Mg into the TaNO nanaostructured coating, leading to enhanced MgO, TaNO, and TaN phases with diffraction planes of (111) and (220) at 37.59° and 63.82°, respectively, together with a crystallite size of 34.0 nm and lattice strain of 0.35%. Increasing the incident angle from 1° to 5° increases the peak intensity of Ta. In addition, plasma etching decreases the thickness of the top TaNO layer and increases the intensity of Ta as shown by the GIXRD patterns of TaN–P, TaN–P–Mg, and TaN. Overall, the GIXRD results indicate that the lattice strain of the Ta/TaN, plasma etched Ta/TaN, and MgPIII samples exhibit a declining trend from 6.07%, 1.79% and 0.35%, respectively. Hence, the tensile residual stress after MgPIII decreases noticeably and therefore, the mechanical, adhesion, and corrosion properties are improved.
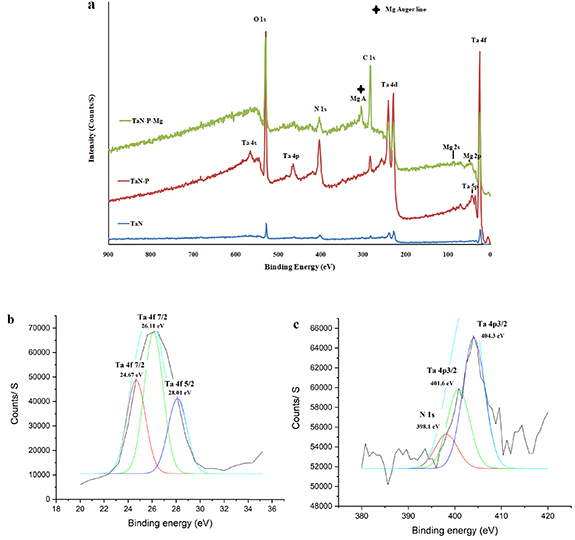
Figure 2. (a) Survey XPS spectra of TaN, TaN–P, and TaN–P–Mg; high-resolution spectra of (b) Ta (4f7/2) and (c) Ta (4p3/2) and N (1s) of TaN–P–Mg.
Download figure:
Standard image High-resolution imageAs shown in figure 2(a), the survey XPS spectra of TaN, TaN–P, and TaN–P–Mg reveal peaks of Ta (4f7/2), Ta (4f5/2), Ta (4p3/2), Ta (4d), N (1s), Mg (1s), Mg (2s), and O (1s) [40–47], demonstrating the formation of TaN with tantalum oxide and Mg. In agreement with Jara et al [40] and Wilks et al [41], the N 1s peak at 398.1 eV and Ta (4f7/2) peaks at binding energies 24.67 eV and 26.11 eV confirm the formation of the TaN layer and the Ta (4f5/2) peak at 28.01 eV becomes more intense due to TaOx Ny (figure 2(b)). The Ta (4p3/2) peaks at 401.60 and 404.30 eV are related to TaNx [42, 43] and TaOx Ny [44], respectively (figure 2(c)). The O1s peak at 530.7 eV is characteristic of lattice oxygen in Ta oxide [45] and the Ta 4d peaks at 230.50 eV and 242.20 eV represent tantalum oxide (Ta2O5) [42–46], because transition metals such as Ta and Ti have a strong affinity to oxygen [40–46]. Thermodynamic considerations suggest that TaN nucleation occur easily on the tantalum oxide islands and tantalum oxide improves the formation of the TaN layer [45].
Plasma etching increases the Ta 4d peaks at 230.50 eV and 242.20 eV, Ta (4p3/2) peak at 404.30 eV, and O1s peak at 530.7 eV suggesting formation of thicker Ta2O5 and TaOxNy layers [40]. MgPIII reduces the intensity of the Mg 2p, Mg 2s, and Mg 1s peaks at 50.0 eV, 90.1 eV, and 1302.4 eV [47, 48], indicating that the surface layer is quite thin. The C1s peak 284.7 eV arises from atmospheric contamination after plasma etching and MgPIII. The porous and needle-shaped surface coating increases the vulnerability to surface contamination. All in all, the XPS and GIXRD are consistent showing the formation of TaOx Ny after plasma etching.
The FE-SEM images of the nitrided AZ 91 Mg alloy, TaN, and TaN–P–Mg in figure 3 reveal a homogeneous and uniform nitride layer with a cluster size of about 45 nm. There is island growth on the AZ91 Mg alloy (figure 3(a)) and uniform, compact, homogenous, and nanostructured TaN and MgPIII plasma-etched TaN layers with a cluster size of about 19 nm and 17 nm are observed (figures 3(b) and (c)). The cross-sectional images of TaN and TaN–P–Mg reveal thicknesses of 1068 nm and 1080 nm, respectively (figures 3(d) and (e)), and the XPS depth profile of TaN–P–Mg (figure 3(f)) shows that the thicknesses of the MgPIII, Ta intermediate, and nitrided layers are 462 nm, 116 nm, and 160 nm, respectively. The thicknesses of the three TaN layers are 170 nm, 306 nm, and 305 nm, respectively. The thickness of middle and top TaN layer is the same, but plasma etching and MgPIII change the top layer of about 69 nm as confirmed by the larger amounts of oxygen and Mg. Two types of TaN are observed and the TaN middle layer is different from the top and underneath TaN layers. The top and bottom TaN layers improve the corrosion resistance and the middle TaN layer enhances the hardness and biocompatibility [2, 49, 50].

Figure 3. FE-SEM images: (a) nitrided AZ91 Mg alloy, (b) TaN, and (c) TaN–P–Mg (scale bar = 200 nm); cross-sectional FE-SEM images: (d) TaN and (e) TaN–P–Mg (scale bar = 500 nm); (f) XPS depth profile of TaN–P–Mg.
Download figure:
Standard image High-resolution imagePlasma etching and MgPIII produce a thicker TaN–P–Mg multilayered coating, a top layer with the columnar structure due to larger surface roughness of the TaN layer (smaller particle size of TaN), and more sites for Mg nucleation and growing as corroborated by AFM.
The time vs. potential plot of the nitrided AZ91 Mg alloy, TaN, TaN–P and TaN–P–Mg specimens in SBF (figure 3) demonstrates that plasma etching and MgPIII result in a stable and constant trend of OCPs of −1517 and −1560 mV. The shifted potentials to positive values for the nitrided AZ91 Mg alloy and TaN arise from the formation of magnesium oxide and tantalum oxide, respectively, in addition to gradual depletion of corrosion products and reduction of active anodic and cathodic sites, leading to the shift to more positive values. Formation of ceramic compounds on the nitrided AZ91 Mg alloy is due to penetration of nitrogen which creates an effective barrier against corrosion. The minor fluctuations in the potentials indicate changes with immersion time.
The more negative potentials of TaN–P and TaN–P–Mg compared to TaN make hydrogen release and cathodic reactions with water easier resulting in depletion of calcium and phosphate from the SBF solution. The low potential of TaN–P–Mg compared to TaN–P due to MgPIII increases deposition of corrosion products on the multilayered coating. In general, the OCP is more positive after deposition of the Ta/TaN multilayered coating on the nitrided AZ91 Mg alloy indicating more corrosion resistance and less corrosion reactions in SBF [51, 52].
The Nyquist, Bode, and Bode-phase plots of the nitrided AZ91 Mg alloy, TaN, TaN–P, and TaN–P–Mg specimens after immersion for 1, 24, 48, and 72 h in SBF are presented in figures 4 and S4. Because of the significant increase in the corrosion resistance on TaN–P sample after 48 h, EIS is performed on TaN–P and TaN–P–Mg after immersion for 72 h. The Ta/TaN and plasma-etched Ta/TaN coatings show three time constants with an inductive loop at low frequencies of the end of the Nyquist plot. The time constant at high frequencies is related to the resistive behavior of defects (cavities and cracks) and that at medium frequencies is associated with corrosion products and tantalum intermediate layer. The time constant at low frequencies is related to the interface between the substrate and multilayered coating. As shown in figures 4(a) and S4(a), (b), Ta/TaN exhibits the highest corrosion resistance during immersion for 1 h but the corrosion resistance of the plasma-etched Ta/TaN multilayered coating increases significantly with immersion time. It is due to increased electrolyte absorption and penetration of electrolytes into the coating as a result of higher surface roughness created by plasma etching. The larger diameter of the induction ring, especially at 1, 24 and 72 h, of the plasma-etched Ta/TaN specimen confirms dissolution of the ceramic and surface coatings. The tantalum intermediate layer reacts with electrolyte oxygen to form oxide at defects leading higher corrosion resistance compared to the Ta/TaN multilayered coating. Nitriding of the AZ91 Mg alloy blocks the anode and cathode sites thus limiting the effects of galvanic corrosion due to the presence of aluminum and zinc. Furthermore, the larger induction ring and more dissolution of the oxide layer around the cathode regions are accompanied by electrochemical reduction of water and release of hydrogen consequently facilitating deposition of calcium and phosphate compounds. The broad peak in a wide range at high frequencies in the Bode-phase plot indicates higher corrosion resistance of the plasma etched Ta/TaN multilayered coating [53, 54].

Figure 4. Nyquist plots of the nitrided AZ91 Mg alloy, TaN, and TaN–P after immersion for (a) 1 h, (b) 24 h, and (c) 48 h; (d) TaN–P and TaN–P–Mg after immersion for 72 h in SBF solution.
Download figure:
Standard image High-resolution imageAs a result of the favorable ceramic characteristics and higher corrosion resistance of the plasma-etched Ta/TaN multilayered coating, MgPIII is performed to further improve the biological properties. The Nayquist, Bode, and Bode-phase plots of Ta/TaN–P–Mg in figure 5 indicate improved corrosion resistance and protection mechanism. The similarity of the EIS curves indicates that the corrosion mechanism does not change after MgPIII plasma etching, but the changes in the diameter of the induction rings and rings at low and medium frequencies indicate enhanced interfacial reactions between the ceramic TaN top layer. It leads to better performance of the tantalum intermediate layer and formation of oxides and corrosion products (hydroxylapatite), which deposited from SBF solution, (standard No. 01-086-0740) at defects in the TaN as confirmed by the GIXRD patterns (figure S5).

Figure 5. (a) Nyquist plots and (b), (c) Bode and Bode-phase plots of TaN–P and TaN–P–Mg after immersion in SBF solution for 72 h.
Download figure:
Standard image High-resolution imageThe interactions in the human body, especially in the affected areas, can cause infection and fever (increased temperature) and temperature changes may affect the effectiveness of the implants. The Nyquist, Bode, and Bode-phase plots of TaN–P–Mg in figure 6 disclose higher corrosion resistance after immersion in SBF solution for 72 h while the corrosion mechanism is the same. Increasing the temperature may increase the thickness of the double layer and hydrate compounds at the interface between the substrate and coating by increasing the ion mobility. Moreover, it can increase the cathodic reactions and release hydrogen ions leading to increased electron transfer and deposition of calcium and phosphate from the SBF and the ability to absorb electrolytes forming tantalum oxide at defects [7, 55]. The polarization curves of nitrided AZ91 Mg alloy, TaN, TaN–P, and TaN–P–Mg after immersion in SBF solution for 72 h are displayed in figure S6 and results are summarized in table 3.
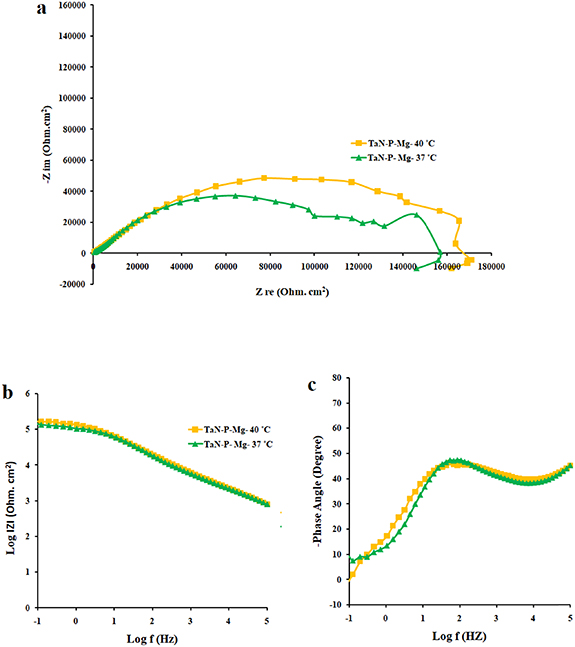
Figure 6. (a) Nyquist plots and (b), (c) Bode and Bode-phase plots of TaN–P–Mg at 37 and 40 °C after immersion in SBF solution for 72 h.
Download figure:
Standard image High-resolution imageTable 3. Polarization parameters after immersion in SBF solution for 72 h.
| Samples | Immersion time (h) |
 (mV) (mV) |
 (µA (µA  ) ) | βc (mV decade−1) |
 (mV decade−1) (mV decade−1) | Mg+2 (mg L−1 cm−2) | Corrosion rate (mm yr−1) | Efficiency (%) |
|---|---|---|---|---|---|---|---|---|
| Nitrided AZ91 alloy | 72 | −1395 ± 29 | 0.59 | 25 | 27 | 90.89 ± 0.38 | 13.13E − 3 | — |
| TaN | 72 | −1295 ± 35 | 0.02 | 47 | 41 | 84.83 ± 0.34 | 0.46E − 3 | 96.4 |
| TaN–P | 72 | −861 ± 41 | 0.19 | 29 | 47 | 89.63 ± 0.54 | 4.29E − 3 | 67.1 |
| Mg implantation | 72 | −507 ± 12 | 0.02 | 26 | 25 | 60.30 ± 0.47 | 0.42E − 3 | 96.8 |
| Fever | 72 | −511 ± 18 | 0.01 | 26 | 26 | 71.49 ± 0.22 | 0.15E − 3 | 98.8 |
The corrosion current density (icorr) is derived by extrapolating the cathodic branch of the polarization curves to the OCP as the anodic curves do not show distinct Tafel regions. The corrosion rate (υcorr) is calculated by equation (1) [56, 57]:
where K = 0.00327 defines the corrosion rate (mm yr−1), icorr is the corrosion current density in µA cm−2, ρ is the density of the corroding materials (1.84 g cm−3), and EW is the equivalent weight. The protection efficiency is defined by equation (2) [58]:
where  and
and  represent the corrosion current densities of the bare sample and coating, respectively. Table 3 shows the protection efficiency and polarization parameters after immersion for 72 h.
The Ta/TaN multilayered coating improves the corrosion resistance by reducing the corrosion current density and increasing the corrosion potential to positive values by 96.4% and 7.2%, respectively. Plasma etching and MgPIII shift the corrosion potential positively. Plasma etching increases the corrosion current densities from 0.02 to 0.19 µA cm−2 due to larger surface roughness and different potentials between the sharp points and smooth points on the surface. Hence, a rougher surface can overcome the uniform corrosion mechanism and reduction of the cathodic slope compared to the anodic slope confirming the dominant cathodic reactions. Furthermore, no coating delamination is observed due to the merits of plasma etching. Plasma etching introduces fluctuations to the cathodic and anodic branches of the polarization curve, but MgPIII decreases the corrosion current densities from 0.19 to 0.02 µA cm−2 with a more positive corrosion potential besides mitigated Mg+2 leaching to SBF solution from 89.63 ± 0.54 to 60.30 ± 0.47 mg l−1 cm−2, consequently reducing the fluctuations in the polarization plot and improving the corrosion resistance of the nitrided AZ91 Mg alloy. Fever (40 °C) decreases the corrosion current density by 63% without changing the OCP. It is due to the constant chemical composition of the surface along with thicker double layer and less defects as confirmed by leaching of magnesium ions of 71.49 ± 0.22 mg l−1 cm−2 [7, 54, 55]. Noticeably, the high voltage used in MgPIII may increase the temperature of the samples as well as the vacuum chamber. It may serve as an in situ heat treatment to cure defects in the plasma-etched Ta/TaN sample by forming tantalum oxide from the intermediate Ta layer and providing defects with more energy. Therefore, after MgPIII, the corrosion current density and amounts of Mg+2 released decrease compared to the plasma-etched Ta/TaN sample. Moreover, although the fever conditions decrease the corrosion current density, the mobility of aggressive soluble ions increases to perhaps cause other effects which require additional experiments for verification.
Owing to the high rate of degradation and corrosion of magnesium alloys due to the formation of galvanic cells of aluminum and zinc, the Ta/TaN multilayered coating (metal/ceramic nature) improves the corrosion resistance on the heels of self-healing that occurs via the reactions between the tantalum intermediate layer and electrolytes and penetrating ions through defects as well as formation of oxides to obstruct defects. The Nyquist plot in figure 7(a) illustrates improved corrosion resistance the destructive polarization test in SBF solution (24 h). The semi-ring at the end of the Nyquist plot and fluctuations in the Bode-phase plot (figures 7(b) and (c)) indicate electron transfer and formation of oxide. These results indicate self-healing which consequently enhances the corrosion resistance and increases the durability of the coatings. Disappearance of the induction ring from the Nyquist diagram indicates the stability of the protective layer in preventing local corrosion [7, 54, 55].

Figure 7. (a) Nyquist plots and (b), (c) Bode and Bode-phase plots of TaN–P–Mg before and after the polarization tests (1 min and 24 h) at 37 °C after immersion in SBF solution for 72 h.
Download figure:
Standard image High-resolution imageThe mechanism and corrosion behavior are investigated using an electrical equivalent circuit model constructed to simulate the electrochemical cell [54, 55, 59]. The electrical equivalent circuit models of the nitrided AZ91 Mg alloy, TaN, TaN–P, and TaN–P–Mg are presented in figure S7 and the results are summarized in tables 4 and 5. Rsol, Rcoat, Rpro, Rind, and Rct are related to the SBF solution resistance, Ta/TaN multilayered coating, corrosion products, inductive ring, and charge transfer resistance. CPEcoat, CPEpro, L, and CPEdl are related to the Ta/TaN multilayered coating capacitance, corrosion products coating capacitance, inductance, and charge transfer capacitance and n is a measure of the surface roughness and uniformity. The induction rings (L and Rind) may stem from dissolution of the surface oxide layer and local corrosion enhanced by plasma etching. To validate the accuracy of the electrical equivalent circuits, the fitted curves of TaN–P–Mg of the polarization test after immersion for 24 h are shown in figure S8 and the Chi-square results in tables 4 and 5 indicate a good fit.
Table 4. EIS parameters of the nitrided AZ91 Mg alloy after immersion for different immersion time in SBF solution.
| Sample | Immersion time (h) |
 (Ω cm2) (Ω cm2) |
 (Ω cm2) (Ω cm2) |
 (µF cm−2 sn−1) (µF cm−2 sn−1) |

|
 (Ω cm2) (Ω cm2) |
 (µF cm−2 sn−1) (µF cm−2 sn−1) |

| Chi-squared |
|---|---|---|---|---|---|---|---|---|---|
| Nitrided AZ91 Mg alloy | 1 | 28 | 880 | 71.91 | 0.89 | 5195 | 92.08 | 0.87 | 0.004 716 |
| 24 | 25 | 13 348 | 179.52 | 0.91 | 20 247 | 26.55 | 0.64 | 0.002 146 | |
| 48 | 27 | 98 193 | 14.25 | 0.58 | 20 061 | 1.981 | 0.89 | 0.003 792 |
Table 5. EIS parameters of TaN, TaN–P, and TaN–P–Mg after immersion in SBF solution and effects of fever and self-healing.
| Samples | Immersion time (h) |
 (Ω cm2) (Ω cm2) |
 (Ω cm2) (Ω cm2) |
 (µF cm−2 sn−1) (µF cm−2 sn−1) |

|
 (Ω cm2) (Ω cm2) |
 (µF cm−2 sn−1) (µF cm−2 sn−1) |

|
 (Ω cm2) (Ω cm2)  (Henrri) (Henrri)
|
 (nm) (nm) | Chi-squared | |
|---|---|---|---|---|---|---|---|---|---|---|---|---|
 (Ω cm2) (Ω cm2) |
 (µF cm−2 sn−1) (µF cm−2 sn−1) | |||||||||||
| TaN | 1 | 57 | 954 | 0.36 | 0.85 | 7012 | 0.82 | 0.63 | 26 884 | 1366 | 58.3 | 0.001505 |
| 102 652 | 0.76 | |||||||||||
| 24 | 32 | 5775 | 57.12 | 0.84 | 1024 | 2.41 | 0.72 | 312 | 79 | 25.0 | 0.000 308 | |
| 1076 | 1.77 | |||||||||||
| 48 | 31 | 457 | 107.28 | 0.64 | 825 | 5.37 | 0.72 | 174 | 9188 | 10.6 | 0.000 191 | |
| 363 | 4.16 | |||||||||||
| 72 | 27 | 178 | 6.27 | 0.43 | 754 | 1.45 | 0.52 | 24 231 | 11.63 | 0.2 | 0.000 448 | |
| 151 | 205.71 | |||||||||||
| TaN–P | 1 | 43 | 56 | 0.04 | 0.74 | 324 | 10.64 | 0.78 | 492 | 18.57 | 0.2 | 0.000 573 |
| 436 | 185.42 | |||||||||||
| 24 | 29 | 982 | 0.15 | 0.71 | 2710 | 1.83 | 0.53 | 1316 | 15 362 | 0.3 | 0.000 058 | |
| 42 493 710 | 141.72 | |||||||||||
| TaN–P | 48 | 25 | 1305 | 0.01 | 0.78 | 5951 | 0.98 | 0.55 | 86 394 | 1678 | 885.1 | 0.000 868 |
| 153 543 | 0.05 | |||||||||||
| 72 | 23 | 975 | 0.02 | 0.81 | 95 572 | 1.47 | 0.55 | 4293 | 1158 | 0.4 | 0.001 052 | |
| 12 296 | 105.53 | |||||||||||
| Mg implantation | 72 | 11 | 9193 | 1.19 | 0.58 | 6568 | 0.13 | 0.61 | 22 895 | 374 262 | 148.2 | 0.001 685 |
| 126 658 | 0.3 | |||||||||||
| Fever (40 °C) | 72 | 22 | 12 475 | 1.14 | 0.61 | 87 852 | 0.04 | 0.72 | 40 628 | 134 942 | 1117.9 | 0.000 786 |
| 145 128 | 0.04 | |||||||||||
| Self-healing | 1 | 24 | 429 | 1.02 | — | 9427 | 2.94 | 0.61 |
 = 0.73 = 0.73 | 1 | 0.004 375 | |
| 1645 | 42.53 | |||||||||||
| 24 | 18 | 512 | 0.04 | — | 18 735 | 1.92 | 0.64 |
 = 0.67 = 0.67 | 0.1 | 0.001 882 | ||
| 11 946 | 315.92 | |||||||||||
The calculated parameters in tables 4 and 5 indicate improved corrosion resistance of TaN–P–Mg. As the immersion time increases, penetration and absorption of water by the coating leads to a capacitive behavior at high frequencies because of tantalum oxide. The two Randles series circuits of the nitrided AZ91 Mg indicate that the oxide or nitrided layer mechanism is independent of the local corrosion mechanism caused by galvanic corrosion. A similar trend for double layer thickness changes (ddl), Rpro, and Rcoat confirms the effective role of tantalum in improving the corrosion resistance, so that increasing the immersion time reduces the thickness of the double layer in Ta/TaN. In contrast, the thickness of the double layer in Ta/TaN–P after immersion for 48 h increases by approximately 88 times and diminishes after 72 h. MgPIII increases ddl, Rpro, and Rcoat due to electron transfer and accumulated hydrated cations. Examining the self-healing behavior of TaN–P–Mg after polarization test, the larger Rpro and Rcoat after immersion for 24 h indicate deposition of corrosion products such as tantalum oxide (multilayered coating), magnesium oxide (substrate), and calcium phosphate (SBF solution), consequently reducing the thickness of the double layer as confirmed by repair of defects and damage from polarization by forming a ceramic layer. The larger ncoat after longer immersion for Ta/TaN–P indicates less surface roughness or changes in the corrosion behavior from the local to uniform states [7, 54, 55]. Comparing ncoat TaN and TaN–P after immersion for 1 and 24 h, plasma etching increases the surface roughness and improves the antibacterial properties to be discussed later.
It has been reported that the microbial medium has the capacity of producing pitting corrosion on the exposed surfaces leading to significant deterioration of the mechanical properties of implants [60, 61]. Nano-indentation is used to evaluate the mechanical properties of thin films because indenter penetration is only a few nanometers [62]. Alteration of the hardness by elastic residual stress is less than 10% of that in the un-stressed specimen [62]. The nano-mechanical properties such as hardness and wear properties are determined by nano-indentation and nano-scratch tests and the results of the nano-indentation tests are summarized in table 6. The one-tenth rule of coating thickness is employed to control the depth of indentation and eliminate contributions from the substrate [14, 63, 64]. As shown by the AFM images (figures 8(a) and (b)) and table 6, Ta/TaN shows increased hardness and elastic modulus from 0.93 GPa and 46.9 GPa to 5.41 GPa and 110.8 GPa.

Figure 8. Nano-indentation plots of (a) AZ91 Mg alloy and (b) TaN, TaN–P and TaN–P–Mg; AFM images after the nano-indentation test: (c) AZ91 Mg alloy, (d) TaN, (e) TaN–P, and (f) TaN–P–Mg.
Download figure:
Standard image High-resolution imageTable 6. Nano-indentation results of AZ91 Mg alloy, TaN, TaN–P, and TaN–P–Mg.
| Samples | Hardness (GPa) | Elastic modulus (GPa) | Stiffness (µN nm−1 ) | Max depth (nm) | Max force (µN) | Contact area (nm2) | Critical load (N) |
|---|---|---|---|---|---|---|---|
| AZ91 Mg alloy | 0.93 | 46.9 | 60.7 | 348.5 | 1230 | 1.32E + 6 | — |
| TaN | 5.41 | 110.8 | 60.7 | 95.4 | 1276 | 2.36E + 5 | 3.47 |
| TaN–P | 7.47 | 115.7 | 54.1 | 56.5 | 1283 | 1.72E + 5 | 3.69 |
| TaN–P–Mg | 5.80 | 89.9 | 47.7 | 92.8 | 1279 | 2.21E + 5 | 3.53 |
Plasma etching enhances the hardness and elastic modulus of Ta/TaN by 38% and 4%, respectively, probably due to more dislocations and residual compressive pressure. In comparison, MgPIII reduces the hardness and elastic modulus by 23% and 22% compared to plasma etched specimen, respectively and the contact area increases by 28%. Mg ions are implanted to a depth of about 462 nm to release residual stress and facilitate movement of dislocations. In fact, the combination of plasma etching and MgPIII increases the strength, toughness, and flexibility by raising the hardness, reducing the elastic modulus, and increasing the stiffness by 7%, 19%, and 21%, respectively. The critical load of 3.5 N, contact Hertzian pressure of 10 500 MPa, and shear stress of 32 549 MPa at a maximum depth of 3 µm for TaN–P–Mg indicate good adhesion [64–66]. The displacement in the constant load application at the top of the nano-indentation curve indicates increased surface length capability of TaN–P and TaN–P–Mg compared to TaN as well as improved creep behavior of Ta/TaN after plasma etching and MgPIII [14, 63].
The scratch image and roughness diagrams of the AZ91 Mg alloy, TaN, TaN–P, and TaN–P–Mg in figure S9 show that the maximum penetration depths are 166.52, 62.98, 69.71, and 78.45 nm, respectively. The results indicate wide scratches and large penetration depths with accumulation and plowing in the movement path on AZ91 Mg alloy revealing the high flexibility and dominant adhesive wear mechanism (figures S9(a) and (b)). As shown by the sharper scratches on Ta/TaN, low accumulation in the motion path, small penetration depth, and smooth end of the roughness profile are observed (figure S9(d)). The abrasion wear mechanism is dominant along with plastic deformation around the motion path of the indenter. Although the maximum penetration depths of the plasma-etched and MgPIII specimens increase compared to the Ta/TaN specimen, improved mechanical behavior is observed from the TaN–P–Mg sample [14, 63–67].
Figure S10 shows the friction vs. time plots of the AZ91 Mg alloy, TaN, TaN–P, and TaN–P–Mg specimens and the Ta/TaN multilayered coating reduces the friction coefficients from 0.79 ± 0.08 to 0.25 ± 0.06. Although plasma etching increases the hardness and stabilizes the friction coefficient curve, the higher surface roughness (figure 1) raises the friction coefficient to 0.31 ± 0.09. In addition, MgPIII decreases the friction coefficient on the nanoscale (figure 1(d)).
The contact angles of water and ethylene glycol on the nitrided AZ91 Mg alloy, TaN, TaN–P, and TaN–P–Mg specimens are shown in figure S11 and summarized in table 7. Ta/TaN is more hydrophobic showing contact angles of 65.7 ± 2.3° and 42.6 ± 1.5°, respectively. Plasma etching decreases the water and ethylene glycol contact angles by 8.1% and 1.9%, respectively, increases the surface energies from 40.22 ± 1.6 to 43.42 ± 1.1 mN m−1 due to increased surface roughness (Sa ) from 0.07 ± 0.01 to 0.19 ± 0.02 nm. After MgPIII, Ta/TaN is more hydrophilic showing contact angles of 41.6 ± 1.0° and 31.5 ± 1.1°. The wettability is related to both the surface topography and surface chemistry, and a rougher surface shows a smaller water contact angle [68–70]. Plasma etching can enhance the hydrophilicity due to addition of oxygenated functional groups to the surface [69]. It also increases the surface roughness and surface energy and creates a hydrophilic surface compared to the Ta/TaN specimen. MgPIII combined with plasma etching increases more surface roughness and the hydrophilic properties than the plasma-etched Ta/TaN specimen [71]. Indeed, on a rough surface, the real contact area at the liquid–solid interface with the droplet is larger than that on a smooth surface. If the energy of the liquid–solid interface is smaller than that of the solid–vapor interface, wetting of the rough surface decreases the energy of the system and therefore, a rough surface wets more quickly [71].
Table 7. Contact angles and surface energies of water and ethylene glycol on the nitrided AZ91 Mg alloy, TaN, TaN–P, and TaN–P–Mg.
| Contact angle, θ (degree) | Surface energy (mN m−1) | ||
|---|---|---|---|
| Materials | Water | Ethylene glycol | |
| Nitrided AZ91 Mg alloy | 56.3 ± 1.2 | 52.1 ± 1.4 | 47.78 ± 1.8 |
| TaN | 65.7 ± 2.3 | 42.6 ± 1.5 | 40.22 ± 1.6 |
| TaN–P | 60.4 ± 1.7 | 41.8 ± 1.2 | 43.42 ± 1.1 |
| TaN–P–Mg | 41.6 ± 1.0 | 31.5 ± 1.1 | 57.20 ± 2.5 |
The initial response in contact with physiological fluids is water adsorption followed by protein adsorption [20, 42, 72]. Small water contact angles and high surface free energies indicate good adhesion properties [20, 72–75] and TaN–P–Mg with reduced contact angle, increased hydrophilicity, and surface energy shows higher protein absorption [42], as well as increased cell growth and biocompatibility. The larger surface roughness of TaN–P–Mg improves cell adhesion which is also influenced by the adsorbed protein layer. A smaller water contact angle, higher surface energy, and wettability enhance bone formation boding well for bone implants [72, 74, 75].
Figure S12 illustrates the bacteria images and numbers of E. coli colonies on the nitrided AZ91 Mg alloy, TaN, TaN–P, and TaN–P–Mg after culturing for 6 and 24 h, indicating reduction of 53.6% and 79.1% after 6 h and 98.5% and 98.2% after 24 h on TaN–P and TaN–P–Mg compared to TaN. The mechanism of bacteria growth and adhesion can be divided into two parts [20]: (a) initial and reversible physical phase and (b) irreversible chemical and cellular phase. In the first stage, many factors such as the electrostatic charge, gravity, surface roughness, and surface energy affect the process. This stage usually takes 6 h, and if bacteria attach to the surface during this time, they can grow rapidly to form a biofilm and spread to other surfaces [20, 76, 77]. Ta/TaN shows the lowest antibacterial properties against E. coli of about 1896.9% compared to nitrided AZ91 Mg, but plasma etching and MgPIII decrease the number of E. coli colonies. Figure 9 shows the SEM images of the bacteria demonstrating decreased bacteria attachment on the plasma-etched TaN. MgPIII increases the surface roughness from 0.19 ± 0.02 nm to 0.28 ± 0.05 nm thus reducing bacteria attachment and minimizing the size and change shape of bacteria from rod to cocci. These translate into harsher conditions for the bacteria and in the bacterial medium because a lower pH promotes release of acidic substances from microbes increasing the corrosion rate [61]. Actually, the number of bacteria colonies and the dimensions and coherence on the nitrided AZ91 Mg alloy, Ta/TaN, and plasma-etched Ta/TaN coating increase with culturing time to 24 h resulting in biofilm formation. However, the SEM images of TaN–P–Mg show that bacteria cannot attach and form a biofilm in the first 6 h but the bacteria try to attach to TaN–P–Mg after 24 h (figure 9). However, the decrease and discontinuity indicates the lack of biofilm formation and harsh conditions for the growth of E. coli on TaN–P–Mg.
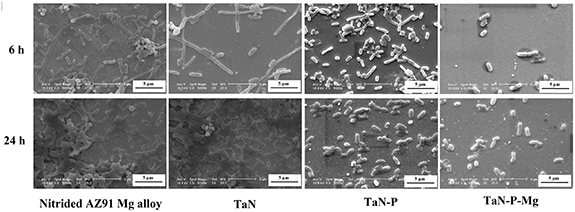
Figure 9. SEM images of E. coli on the nitrided AZ91 Mg alloy, TaN, TaN–P, and TaN–P–Mg after culturing for 6 and 24 h.
Download figure:
Standard image High-resolution imageOsteoblastic cell proliferation on Ta/TaN is crucial to potential orthopedic applications [20]. The MTT assay is based on a direct correlation between the activity of mitochondrial dehydrogenase of living cells and number of cells attached to the substrate [78]. The biocompatibility and cytoskeleton on the nitrided AZ91 Mg alloy, TaN, TaN–P, and TaN–P–Mg are assessed with MC3T3 cells by the MTT assay after culturing for one, four, and seven days (figure 10). The MTT tests indicate that the amounts of living cells on Ta/TaN at different time points of one, four and seven days are larger than those on the nitrided AZ91 Mg alloy and plasma etching increases the number of living cells by 15.5%, 56.2% and 17.3% after one, four and seven days, respectively, compared to TaN. Plasma etching of Ta/TaN and MgPIII increase the number of living cells all of time especially after four and seven days. Three reasons can be considered in the discussion of the behavior of MgPIII and plasma-etched Ta/TaN multilayered coating. The larger pressure applied to the cell walls by the rough surface reduces the contact area [76, 79] and the larger dimensions of cells compare to the surface roughness cause more tolerable pressure by cells and enhance cell adhesion. Finally, the hydrophilic state is more suitable for living organisms to attach and proliferate [20].

Figure 10. MTT assay results after incubation with MC3T3 cells on the nitrided AZ91 Mg alloy, TaN, TaN–P, and TaN–P–Mg for one, four, and seven days.
Download figure:
Standard image High-resolution image
4. Conclusion
A Ta/TaN multilayered coating is deposited on the plasma-nitrided AZ91 Mg alloy. The top TaN layer was plasma-etched by oxygen and argon to increase the bacterial resistance and MgPIII is performed to enhance the biological properties by forming a needle-shaped morphology with surface roughness of 0.28 nm.
- The Ta/TaN multilayered coating (metal/ceramic nature) improves the corrosion resistance because of self-healing via the reactions between the tantalum intermediate layer and electrolytes and penetrating ions through defects as well as formation of oxides to obstruct defects. Although plasma etching increases the corrosion current densities and can overcome the uniform corrosion mechanism due to larger surface roughness and different potentials between the sharp points and smooth points on the surface, MgPIII decreases the corrosion current densities, leading to a more positive corrosion potential in addition to reduced leaching of Mg ions into the SBF from 89.63 ± 0.54 to 60.30 ± 0.47 mg l−1 cm−2 compared to the plasma-etched Ta/TaN multilayered coating. It is because the high voltage used in MgPIII may increase the temperature of the samples to produce an in situ heating effects to cure defects in the plasma-etched Ta/TaN sample by forming tantalum oxide at the intermediate Ta layer. Furthermore, the electrochemical behavior of TaN–P–Mg enables easier release of hydrogen. The cathodic reactions with water finally cause depletion of calcium and phosphate ions from the SBF solution.
- Increasing the temperature may increase the thickness of the double layer and hydrates compounds at the interface between the substrate and coating by increasing the ion mobility. Hence, the fever conditions (40 °C) decrease the corrosion current densities by 63% but do not change the OCP and self-healing process which occur via the reactions between the tantalum intermediate layer and electrolytes, penetrating ions through the defects, and formation of oxides to obstruct defects.
- Plasma etching enhances the hardness and elastic modulus probably due to more dislocations and residual compressive pressure, and MgPIII reduces the hardness and elastic modulus to release residual stress and facilitate movement of dislocations. The combination of plasma etching and MgPIII increases the strength, toughness, and ductility of the Ta/TaN multilayered coatings.
- MgPIII and plasma etching increase the hydrophilicity as shown by the water and ethylene glycol contact angles of 41.6 ± 1.0° and 31.5 ± 1.1°, respectively. Plasma etching enhances the hydrophilicity by introducing oxygenated functional groups to the surface and MgPIII increases the surface roughness and surface energy. Therefore, the contact area at the liquid–solid interface is larger than that on a smooth surface.
- Plasma etching decreases bacteria attachment and MgPIII increases the surface roughness from 0.19 ± 0.02 nm to 0.28 ± 0.05 nm giving rise to reduced bacteria attachment. Prohibition of biofilm formation and harsh conditions for the growth of E. coli on TaN–P–Mg give rise to enhanced bacterial resistance on Mg–P–TaN.
- The initial response in contact with physiological fluids is water adsorption followed by protein adsorption. Therefore, the hydrophilic state after MgPIII is more suitable for attachment and proliferation of cells. The culturing results after four and seven days suggest that the strategy and materials described in this paper have large potential in the development of biodegradable orthopedic implants.
Acknowledgments
The authors thank the Iranian Nanotechnology Initiative Council. The work was financially supported by Malayer University Research Grant, Hong Kong Research Grants Council (RGC) General Research Funds (GRF) No. CityU 11205617, City University of Hong Kong Strategic Research Grant (GRF) No. 7005264, as well as Guangdong—Hong Kong Technology Cooperation Funding Scheme (TCFS) GHP/085/18SZ (CityU 9440230).
Data availability statement
The data generated and/or analyzed during the current study are not publicly available for legal/ethical reasons but are available from the corresponding author on reasonable request.