
Abstract
Particulate air pollution has an adverse effect on cardiovascular and respiratory health. Air filtration systems are therefore essential in closed indoor environments. While mechanical filtration is described as an efficient technology, particle filters may act as a source of pollution if not correctly installed and frequently maintained. The sandfish lizard, a sand swimmer that spends nearly its whole life in fine desert sand, inspired us to rethink traditional filtering systems due to its unique ability of filtering sand from its nasal cavity. During a slow, prolonged inhalation, strong cross-flow velocities develop in a certain region of the upper respiratory tract; these cross-flows enhance gravitational settling and force inhaled sand grains towards the wall where they adhere to mucus, which covers the walls in this region. During an intense, cough-like exhalation the particles are blasted out. In this work, the sandfish's aerodynamic filtering system was analyzed experimentally and by computational fluid dynamics simulations to study the flow profile and particle trajectories. Based on these findings, we discuss the development of a biomimetic filtering system, which could have the following advantages: due to the absence of a membrane, total pressure losses can be reduced. The mucus-covered surface would be mimicked by a specifically treated surface to trap particulate matter. Also, the device would contain a self-cleaning mechanism that simulates the lizard's exhalation. This biomimetic filtering system would therefore have an enhanced life-time and it would be low-maintenance and therefore economical and sustainable.
Export citation and abstract BibTeX RIS

Original content from this work may be used under the terms of the Creative Commons Attribution 3.0 licence. Any further distribution of this work must maintain attribution to the author(s) and the title of the work, journal citation and DOI.
1. Introduction
For hundreds of millions of years, animals have successfully adapted to all kinds of habitats (Benyus 1997), even to surroundings as hostile as the desert. Under the harsh conditions of sandy environments animals have developed innovative means of survival. Ectotherms such as lizards bury themselves in sand to regulate their body temperature. While they solved one problem another popped up: How could they breathe in sand without getting sand particles into their lungs?
Some lizards have developed an erectile tissue at the nasal opening and are capable of partially or fully closing the naris (Stebbins 1943). Others, like Uma notata and Sceloporus arenicolus, have adapted their nasal cavity to a certain sand grain size (Pough 1970, Ryberg and Fitzgerald 2015). Uma notata lives in areas with modal grain size (0.25–0.5 mm) (Pough 1970) and manages to breathe with a tilted-U-shaped filter in its nasal cavity (Stebbins 1943).
The sandfish lizard Scincus scincus inhabits sand dunes with fine grain size (0.1–0.5 mm) and has developed unique traits for a successful life as a sand-swimmer. Adaptations concerning the animal's locomotion and skin have been described and studied in detail (Baumgartner et al 2008, Maladen et al 2009, Sharpe et al 2013, 2015, Vihar et al 2016). However, the respiratory adaptations have only been briefly mentioned as 'not particularly well-adapted for preventing the entrance of fine particles' (Stebbins 1948). In 2015, Vihar et al (2015) outlined the respiratory physiology of S. scincus. Based on these findings, Stadler et al (2016) investigated the upper respiratory tract of the sandfish lizard and postulated the following hypothesis: 'when particles enter the respiratory tract during inhalation (2 s), they stay in the area superior to the vomero-nasal organ due to a great drop in velocity, where they are caught by the mucus. The cilia transport the particles either towards the naris or towards the palatine cleft. Due to the rapid cough-like exhalation (45 ms), some of the particles are coughed out through the naris. The rest may be transported into the oral chamber through the palatine cleft and swallowed.'
Particle filtration does not only play a vital role for animals that live in a granular medium but also for creatures who need to clean the breathing air from aerosols. Extensive research on particle deposition has been conducted for the human respiratory system, see e.g. Kleinstreuer and Zhang (2010), Isaacs et al (2013), Islam et al (2019) and the numerous citations therein. The deposition of micron-sized particles occurs by inertial impaction, gravitational sedimentation and diffusion. Similar research has also been carried out for rodents like mice, where the dimensions of the respiratory tract are more comparable to that of the sandfish lizard, see e.g. Oldham and Phalen (2002), Kolanjiyil et al (2019) and the sources cited therein. The focus of this research lies on the deposition of pharamaceutical particles and toxic aerosols.
These investigations lead from basic to applied research: heating, ventilation and air conditioning (HVAC) systems in combination with air filtration are used worldwide in closed spaces such as public and private buildings and vehicles to provide thermal comfort and satisfactory indoor air quality (Ortiz et al 2017). Clean air has a positive impact on cardiovascular health (Chuang et al 2017) and reduces morbidity and mortality associated with indoor exposure to outdoor air particles (Dockery et al 1993, Fisk 2013, Goodman and Hänninen 2014). The mechanical filtration mechanism is an effective method to augment indoor air quality (Zhang et al 2011); however, the particle filter is classified as problematic as it may even worsen air quality due to a lack in maintenance, contamination, poor filter fit or duct leakage (Sublett 2011, Zhang et al 2011). An aerodynamic, membrane-free filtering system based on the sandfish lizard's nasal cavity would be a promising alternative to particle filtering devices.
The primary objectives of this study were to
- I.Attain a deeper understanding of the underlying mechanism of the biological model; we therefore investigated
- (a)the flow profile in the nasal cavity during in- and exhalation,
- (b)the particle trajectories, and
- (c)the 3D-printed, original-sized model.
- II.Investigate the possibility of optimizing state-of-the-art filtering systems. We therefore addressed the following questions:
- (a)What is the minimum particle size that is still filtered by the sandfish model?
- (b)How can the geometry and the velocities be adapted, so that inhalable particulate matter (EU 2008) may be filtered?
- (c)Is an adhesive layer such as mucus essential to aerodynamically filter particles?
2. Materials and methods
To verify the hypothesis that we formulated in our previous study (see Introduction), a 3-dimensional (3D) model of one side of the symmetric upper respiratory system (Stadler et al 2016) was used to conduct further experiments and computational fluid dynamics (CFD) simulations.
2.1. CFD simulation
To better understand the filtering system and its characteristics, we studied the air flow profile and the particle trajectories during both inhalation and exhalation with the help of CFD simulations (ANSYS Fluent, version 18.0, Inc, USA). We furthermore determined the minimum capturable particle size both in theory and simulation.
Fluid flow is generally described by the Navier–Stokes equations, which are a set of non-linear partial differential equations (Chorin and Marsden 1993). ANSYS Fluent is a general purpose finite-volume Navier–Stokes solver, and was used to obtain a numerical solution. This required the discretization of the computational domain, the definition of boundary conditions and further modeling assumptions.
The 3D model of the upper respiratory organ was imported into ANSYS IcemCFD (18.0, ANSYS Inc., USA) to create an unstructured tetrahedral mesh. The meshed geometry was subsequently transferred to ANSYS Fluent.
Flow boundary conditions were defined as follows: a constant pressure was applied at the nasal opening (inlet) and a time dependent outflow velocity (simulating the respiration pattern) was set at the outlet to the trachea. The fluid was air with material parameters set according to the International Standard Atmosphere at sea level.
The Reynolds number is a dimensionless number and is defined as the ratio of the inertial forces to the viscous forces; by calculating this ratio, one can determine the dynamic response of a flow, i.e. if it shows turbulent or laminar behavior (Prandtl et al 1990). In the case under consideration, the maximum Reynolds number during exhalation was determined to be approximately 700, where the characteristic length is the diameter of the entrance to the chamber (lchar = 0.79 mm), the flow was therefore modeled as laminar.
2.1.1. Grid resolution study
Five different grids were created and simulations were performed for steady boundary conditions for the temporal average volumetric flux during inhalation of 92.8 mm3 s−1. Grid data, the results for five different flow quantities as well as the corresponding uncertainty estimates are presented in table 1. Grid convergence is mostly monotonic. Since curvature based grid refinement was used in the grid creation, local grid sizes in areas of complex geometry can differ significantly from the average cell edge length given in table 1, this is especially true for the coarser grids. Since the flow is laminar, the dependence of the results on wall resolution is not particularly pronounced. Uncertainty measures for the medium grid with approximately 400 000 cells are around 5% or lower. This mesh was chosen for all further simulations.
Table 1. Results of the grid resolution study for five quantities:  denotes the total pressure difference between inlet and outlet,
  is the average wall shear stress,
  denotes the average cross-flow velocity in the cut-plane,
  is the maximum cross-flow velocity in the cut-plane, and
  denotes the maximum normal velocity in the cut-plane. The cut-plane is located 2.2 mm downstream of inlet;
  is the average cell edge length, U is the estimate of uncertainty with 95% coverage and has been calculated by the procedure presented in Eça and Hoekstra (2014).
| Mesh | Very coarse | Coarse | Medium | Fine | Very fine |
|---|---|---|---|---|---|
| Index | 1 | 2 | 3 | 4 | 5 |
| Number of cells | 100 640 | 200 005 | 401 730 | 1202 333 | 8010 356 |
 (mm) (mm) |
0.1251 | 0.0995 | 0.0790 | 0.0550 | 0.0294 |
 |
4.255 | 3.384 | 2.687 | 1.871 | 1.000 |
 (Pa) (Pa) |
1.6866 | 1.7112 | 1.7664 | 1.8087 | 1.8314 |
 (Pa) (Pa) |
0.1981 | 0.1275 | 0.0965 | 0.0449 | 0.0104 |
 |
0.1081 | 0.0696 | 0.0527 | 0.0245 | 0.0057 |
 (Pa) (Pa) |
0.011 33 | 0.011 48 | 0.011 80 | 0.012 03 | 0.012 15 |
 (Pa) (Pa) |
 |
 |
 |
 |
 |
 |
0.0914 | 0.0570 | 0.0416 | 0.0186 | 0.0032 |
 (m s−1) (m s−1) |
0.030 63 | 0.030 95 | 0.031 35 | 0.031 64 | 0.031 82 |
 (m s−1) (m s−1) |
 |
 |
 |
 |
 |
 |
0.0501 | 0.0317 | 0.0218 | 0.0102 | 0.0022 |
 (m s−1) (m s−1) |
0.059 62 | 0.060 42 | 0.061 57 | 0.062 24 | 0.062 16 |
 (m s−1) (m s−1) |
 |
 |
 |
 |
 |
 |
0.0551 | 0.0297 | 0.0165 | 0.0032 | 0.0049 |
 (m s−1) (m s−1) |
0.2533 | 0.2550 | 0.2589 | 0.2627 | 0.2655 |
 (m s−1) (m s−1) |
0.0195 | 0.0147 | 0.0123 | 0.0078 | 0.0038 |
 |
0.0734 | 0.0555 | 0.0465 | 0.0292 | 0.0144 |
2.1.2. Simulation of the air flow
The sandfish lizard has a characteristic respiratory pattern that was described in our previous work (Stadler et al 2016, 2018, Stadler et al 2019). For simulation, each phase of the ventilation cycle (exhalation, inhalation, relaxation and pause) was integrated and interpolated by quadratic and cubic spline functions in MATLAB (R2016a, MathWorks, USA), and subsequently programmed in C to create a user defined function (UDF), which was compiled and integrated in ANSYS Fluent.
To understand if the respiratory patterns are a necessary requirement for the filtering system to work, we also performed a simulation with constant velocities, being equal to 80% of the maximum inhalation and exhalation velocity ( ), respectively, which is the temporal average of the inhalation and exhalation velocity profile.
2.1.3. Simulation of particle trajectories
To analyze the trajectories of individual particles, an Euler–Lagrangian modeling approach was used. It allows the observer to follow a single particle as it moves through space and time (Batchelor 2001). For a detailed description of the capabilities of ANSYS Fluent discrete phase model (DPM) to predict the trajectories of discrete Lagrangian particles, see the ANSYS Fluent Theory Guide (ANSYS 2016).
In ANSYS Fluent the particle trajectories are calculated by integrating the following force balance (Newton's second principle):
where  is the particle velocity,
  the particle drag force per unit mass,
  the effective gravitational force and
  represents additional forces like virtual mass and Saffman force. In this study, the additional forces could be neglected, since the density difference between sand particles and air is high and the particle size is relatively large.
The drag force per unit mass is given by
where  denotes the flow velocity, and with
  being the particle relaxation time
Here,  denotes the molecular viscosity of the fluid,
  the density of the particle, dp the particle diameter, and CD stands for the particle's drag coefficient. Rep is the particle Reynolds number, which is defined as
with  being the fluid density. The highest particle Reynolds numbers were estimated to be approximately 5 during inhalation and 250 during exhalation (for dp = 0.3 mm).
For spherical particles, the relationships provided by Morsi and Alexander (1972) can be applied to determine the relationship between drag coefficient and Reynolds number for various flow regimes. Morsi and Alexander Morsi and Alexander (1972) describe that the response of a particle depends on the relative velocity of the particle and the fluid. The relative velocity specifies the drag. If we assume that particles do not interact with each other and have no impact on the basic flow pattern, the drag is the only force determining the trajectory of the particle.
Since the particles are relatively large, we included the particle torque balance in our simulation. The rotational lift force was taken into account; this lift is caused by a pressure differential along a particle's surface. To determine the rotational lift coefficient the Oesterle & Bui Dinh formulation was used, which has been obtained from experiments of  (Oesterlé and Dinh 1998), and is suggested by ANSYS (2016) Theory Guide to be used for Rep < 2000.
Additionally, the gravitational force, i.e. the magnitude (g = 9.81 m s−1) and direction of the gravity vector, was included.
We strived for a coherent approach to mimic the dynamics of the sandfish lizard's filtering system by simulating two different cases.
- Case (A) Reflection: Particles were reflected at the walls of the respiratory tract. ANSYS Fluent provides a reflection model that can account for wall friction and particle rotation. The standard friction coefficient of 0.2 was applied. The reader should refer to the ANSYS Theory Guide (ANSYS 2016) and references therein for further information regarding this model.
- Case (B) Capture: To mimic the mucus-covered surface, a trapping model was used. Particles were captured as soon as they reached the wall. We then injected the particles at the beginning of the exhalation phase exactly at that location, where they got trapped during the inhalation. This model was also useful for studying the minimum capturable particle size.
Sand grains were approximated to be of spherical shape and modeled as single Lagrangian particles. They were injected at a central position at the naris with a starting velocity of  m s−1; the sand grains were injected with a starting velocity, because it can be assumed that they were already accelerated by the air flow caused by the inhalation. Four particles of different diameters were introduced: 0.1, 0.15, 0.2 and 0.3 mm, respectively. For the determination of the minimum particle size, both starting velocity and particle size were varied (see section 2.3.2).
In the natural habitat of the sandfish lizard, sand particle diameters range between 0.1 and 0.5 mm (Hartmann 1989). Theoretically, all these particles can enter the nasal cavity as it is opening diameter is approximately 0.84 mm. Because the nasal opening can be constricted by an erectile tissue (Stadler et al 2016), particles >0.3 mm were thus not considered for simulation. For each particle the flow rate ( ), time of injection (at the beginning of the inhalation or exhalation) and the material were defined. We approximated the density of the sand particles by applying the density of quartz (SiO2,
  kg m−3).
The density of indoor dust particles is approximately 1000 kg m−3 (Molhave 2009). We therefore adapted the particle density to observe particle trajectories with lower density in the sandfish lizard's nasal cavity.
2.2. Experiments
The 3D model was printed in the original size with a 3D printer (Objet30 Pro, RTC Rapid Technologies, Germany) at a resolution of  dpi (see figure 1(a)). The printing material, synthetic resin (RGD720), was translucent. The 3D model was divided into two parts and a flange was added for handling purposes (using the CAD software CATIA, Dassault Systémes, France). We could then easily remove the support material by placing it in 6% sodium hydroxide for 10 min and rinsing it with distilled
  . The model was assembled with Parafilm M (Sigma-Aldrich, Germany).
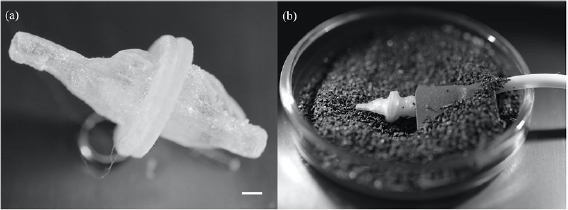
Figure 1. The 3D printed model and the experimental setup. (a) The model was printed in original size with translucent resin, scale bar 0.5 mm. (b) The experimental setup comprises the model that is assembled with Parafilm and connected to a tube at the outlet. It is fixed with a tape in a glass petri dish and buried in fine black desert sand. The tube is connected with a syringe to manually simulate the respiratory pattern of the sandfish lizard.
Download figure:
Standard image High-resolution imageFor the experiment a syringe was connected with a silicone tube (Rotilabo, Germany) to one end of the model (outlet to the lungs). The connection was wrapped with parafilm to assure fixation between the tube and the model. The model was taped onto a glass petri dish. The petri dish was filled with black desert sand for a higher contrast between model and sand particles (see figure 1(b)). The inhalation and exhalation were simulated manually with the help of the syringe. The respiration cycle was repeated 10 times; then the sand was carefully removed before the model was cleaned outside with a brush. We thoroughly examined the respiratory tract for sand particles with the help of a stereo microscope (Motic SMZ-171, Wetzlar, Germany) and a microscopy halogen light source (KL 1500 electronic, Schott, Germany). In total, the experiment was repeated 10 times; the cycle was finished with either an exhalation or inhalation, five times each.
To study the influence of mucus on the filtering system we conducted the experiments under two different conditions. (a) The model was rinsed with artificial mucus prior to the experiment. (b) The model was not pretreated with mucus. For each condition a new model was used to avoid contamination.
The artificial mucus composition is based on Ugwoke et al (2005). The mucus was prepared using 9.5 g double-distilled  , 0.01 g cholesterol, 0.1 g NaCl, 0.1 g albumin, 0.09 g lecithin and 0.2 g mucin (all chemicals from Roth, Germany).
2.2.1. A modified particle Froude number
In a previous study (Stadler et al 2016), the above described experiment was conducted with two distinct differences: (a) the model was scaled-up for handling purposes and the experimental setup was adapted (particle magnification, helium atmosphere) to guarantee similar Reynolds numbers, (b) the model was not rinsed with mucus prior to the experiment.
While Reynolds number similarity and hence similar geometric flow behavior was achieved for both experiments, the settling behavior of the particles was not characterized. In a work by Dávila and Hunt (2001), the settling of particles near vortices and in turbulence was studied. The authors state that the trajectories of small heavy particles are determined by a balance between the settling process and the centrifugal effects of the particles' inertia, and defined a particle Froude number as
In the case under investigation, we have stationary flow characteristics with symmetrical separation during the inhalation (the maximum Reynolds number results in Re ), and we stay in the subcritical range during exhalation (where the maximum Reynolds number results in Re
 ) (Schlichting and Gersten 1997). In both calculations the characteristic length is the diameter of the entrance to the chamber (lchar = 0.79 mm).
According to Zhu and Fan (2016) in a multiphase gas-solid flow, the motion of a single particle may be described by a spherical particle accelerating and rotating in a flow field. If we assume that particles are not interacting, we can define four different forces acting on a particle: the drag force, Basset force, Saffmann force and Magnus force. In this study, the Basset force is negligible because the gas-particle density ratio is small and the acceleration rate is low. The Saffmann force may not be taken into account, when gradient related forces are neglected. The lift force due to particle spin is small compared to the drag force. The Magnus effect can hence be neglected for similarity estimates, nonetheless it has been taken into account in the particle trajectory simulations (section 2.1.3).
Taking into account the above mentioned considerations, we defined a modified particle Froude number  as a measure of the ratio of the horizontal to the vertical acceleration forces experienced by a particle. The modified particle Froude number is hence defined as the ratio between drag force and effective gravitational force. In fluid dynamics the drag force can be expressed as a function of the particle drag coefficient CD in the following way:
where  is the flow velocity relative to the particle,
  the density of the fluid, and Ap denotes the projected area of the particle. If we assume that the particle is of spherical shape,
  .
.
The effective gravitational force (Archimedes' principle) denotes the difference between gravitational and buoyancy force and is defined as
 denotes the particle volume. The modified particle Froude number results therefore in
2.3. Minimum particle size
2.3.1. Theoretical approach
The sandfish filters all sand grains (0.1–0.5 mm) of its natural habitat. We estimated the minimal particle size that could still be filtered by the geometry of the sandfish lizard's nasal cavity. A previous study Stadler et al (2018) shows that both gravitational and inertial forces are relevant in order to trap sand particles on a sticky, mucus-covered surface. Both mechanisms depend on particle size and density; smaller and lighter particles would closely follow the flow streamlines into the trachea. A rough estimate of the critical size of captured particles can be performed using the relationships presented in Kaufmann et al (1993).
Gravity-dominated separation
For gravity- and buoyancy-dominated separation a particle drift velocity can be calculated by equating the buoyancy and the particle friction forces: if the particle Reynolds number is sufficiently small (Re ), Stokes' law can be applied, where the dependency between particle Reynolds number and the drag coefficient is inversely proportional (
 ). The critical particle diameter that is still separated can be determined by the following equation (Kaufmann et al 1993):
where dpg denotes the minimum particle size for gravity-driven separation,  the critical drift velocity,
  the kinematic viscosity of the fluid, g the magnitude of gravity, and
  is the difference between particle and fluid density. For a general drag law
  equation (9) reads
which is an implicit relationship due to the diameter-dependency of the particle Reynolds number.
The critical drift velocity is  , where
  denotes the volume flux. A is the lower surface area of the characteristic section, where mucus and cilia are present, subsequently referred to as the ' chamber'. We can assume here that particle deposition occurs only in the lower surface area of the chamber due to both gravitational forces and the strong cross-flow velocities acting on the particles. This chamber is about 1.50 mm long and has a cross-section area of
  mm2 (figure 2). The lower part of the surface area is hence estimated as
  mm2 (Stadler et al 2016). For steady flow situations,
  could be approximated as tidal volume divided by total inhalation time. Since the inhalation velocity is however time dependent, we estimated
  with 80% of the maximum outflow velocity
  .
.

Figure 2. The 3D model of one part of the bilateral symmetric upper respiratory tract of the sandfish lizard. (a) 3D model with sectioning for a better visualization. Color code: the main air flow goes through the red area; the yellow channel represents the olfactory chamber. Scale bar, 0.5 mm. (b) Visualization of the air flow through the tract. The main air flows through the respiratory tract with velocities of up to 0.43 m s−1 during inhalation. The air flow in sections A–D is shown in figure 3. (c) A 3D view of the model left non-transparent and right semi-transparent to visualize the air flow.
Download figure:
Standard image High-resolution imageInertial impaction
When particles are transported in a moving fluid, they do not perfectly follow the flow streamline when the fluid is accelerated. Due to inertia, particle trajectories do not coincide with streamlines in areas of high streamline curvature. Inertial impaction is described by the Stokes number
where  is the particle relaxation time,
  is the undisturbed fluid velocity and L a characteristic length scale. For impactors with circular nozzles, L is equal to the nozzle radius and the Stokes number for 50% impaction efficiency is 0.24 (Zhang 2005). Adopting this criterion, in the Stokes regime, where
the critical particle size can be estimated from
where dpi denotes the minimum particle size for inertia-driven separation, r the radius of the chamber,  the particle density and
  is the reference velocity where
  (
( m s−1). For higher particle Reynolds numbers, equation (3) must be applied using a Reynolds number dependent drag law
  .
.
2.3.2. Simulation
Based on the results of the theoretical approach, we injected particles of various sizes ranging from 20  m–90
m–90  m (step size 10
  m) with different particle densities (for dust and sand) and a particle starting velocity of
  m s−1. The starting velocity considers not only the dynamics of the particles, but also the dynamics of the sandfish lizard, that moves through sand with velocities of up to 0.5 m s−1, while breathing and therefore possibly simultaneously inhaling particles.
3. Results and discussion
The morphology of the sandfish lizard's respiratory organ may be described as follows: the nasal cavity can be separated into two sections, the respiratory and the olfactory tract (see figure 2(a)). The main air flow goes through the respiratory tract, as shown in figure 2(b). The tract starts with a tubular section (vestibulum). Mucus and cilia are found in a adjacent 'chamber' of 1.5 mm in length (Stadler et al 2016). Particles are filtered in this section.
3.1. Experiments with the 3D model
3.1.1. Experiments with and without mucus
During the experiments, we did not only observe strong adhesion forces between the sand particles and the mucus, but also between the sand particles and the artificial resin (the material used for the 3D model). The reason for this lies in the properties of the artificial resin and the sand grains. We noticed that the adhesion and friction forces are high enough to let particles settle in the chamber during inhalation. During the strong exhalation process, particles are blown out of the cavity, and the bond between the resin and the sand particles is overcome.
The experiments showed that all particles, if present, were found in the front section of the nasal cavity (vestibulum and chamber, see figure 2(a)). No particles were observed in the posterior section. The detailed results are listed in table 2.
Table 2. Results of the experiments with the 3D model. Ten experiments were conducted with mucus, and ten without mucus. The first row shows the results, when the experiments ended with an inhalation, the second row shows the number of particles deposited in the chamber, when the experiments were finalized with an exhalation.
| End with inhalation | End with exhalation | |||||||
|---|---|---|---|---|---|---|---|---|
| Particles in the chamber | ||||||||
| Mucus-rinsed model | 3 | 1 | ||||||
| 2 | 0 | |||||||
| 3 | 1 | |||||||
| 1 | 0 | |||||||
| 4 | 1 | |||||||
| Mucus-free model | 1 | 0 | ||||||
| 2 | 1 | |||||||
| 3 | 1 | |||||||
| 5 | 0 | |||||||
| 1 | 0 | |||||||
The mucus enhances the adhesion forces between the sand particles and the wall, and is therefore indispensable for the sandfish lizard's filtering mechanism.
For the design of a biomimetic filter device the results are promising, because a liquid-covered surface such as mucus would not be feasible for a particle filtering unit. A surface with specific properties to enhance adhesion and friction forces between particulate matter and the wall however is achievable.
3.1.2. The modified particle Froude number and its impact on the experimental results
The experiment with the scaled-up model (Stadler et al 2016) had the advantage that adhesion forces such as electrostatic forces were irrelevant. The disadvantage though was that the modified particle Froude number  was not similar; gravitational forces were hence more dominant and particles tended to settle with higher probability. The modified particle Froude number was approximately 400 times higher in the experiment than in reality. It is therefore not surprising that the results of the experiments with the original-sized model (see table 2) are in agreement with the results of the experiment with the scaled-up model (Stadler et al 2016).
3.2. Flow simulation
The main air flow goes through the respiratory tract both during in- and exhalation. During inhalation the velocity magnitude ranges between 0 and 0.43 m s−1. The highest velocities are observed in the vestibulum, where the cavity is tubular. As soon as the respiratory tract starts to change its shape and forms the chamber, the maximum velocity magnitude starts to decrease (figure 3). The vector plots in figure 4 show the development of the cross-flow velocity during inhalation in different cross-sections (A)–(E) (figure 2(b)) with increasing distance from the inlet. Due to the characteristic shape of the nasal cavity a strong cross-flow develops. At first the direction of the air flow is predominantly in a negative y -direction (figures 4(A)–(C)); as the shape of the nasal tract changes from spherical to sickle-shaped, the cross-flow slowly begins to change its direction towards the left wall (figures 4(D) and (E)). This flow behavior is essential for the filtering mechanism of the respiratory tract, because it forces the particles towards the wall, where they adhere to mucus. The velocities change when the end of the chamber is reached. Here, the velocity vectors support the gravitational forces towards the bottom of the nasal tract. Even light and small particles that are not influenced by gravitational settling are likely to settle in this area of the nasal cavity. We previously demonstrated this by carrying out a particle simulation without taking the impact of gravitational acceleration into account (Stadler et al 2018). The described development of the cross-flow velocities did not significantly depend on whether the time-dependent inhalation pattern or the constant velocity of  was prescribed at the outlet to the trachea.

Figure 3. Contour plots of the velocity magnitude during inhalation in 3 representative sections A, C and D. The highest velocities of 0.43 m s−1 are found in the vestibulum, where the nasal cavity is of tubular shape.
Download figure:
Standard image High-resolution image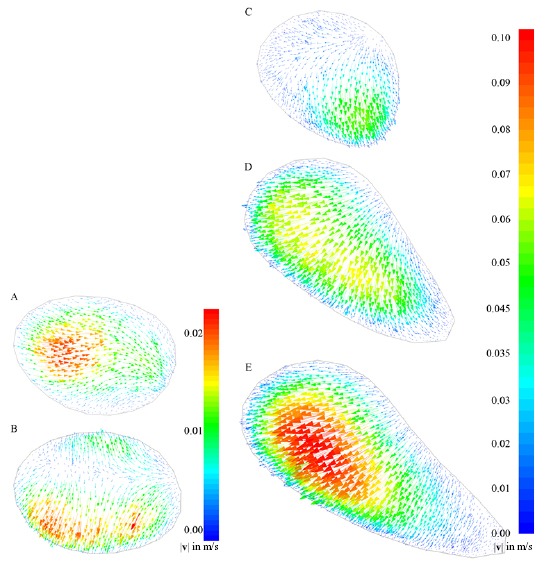
Figure 4. Cross-flow velocity vectors colored by cross-flow velocity magnitude during inhalation in five different sections (A)–(E) of the vestibulum and the chamber. The position of sections (A)–(E) is shown in figure 2. The vestibulum (A) and (B) is rounded in shape. When the channel starts to change its shape (C) and (D), cross-flow velocities that force particles towards the lower wall start to develop. The velocity is constantly increasing and reaches a maximum of 0.1 m s−1 in section (E).
Download figure:
Standard image High-resolution imageDuring exhalation the velocities range between 0 and 13 m s−1; throughout the respiratory tract we observed strong velocities towards the outlet of the nasal cavity (in z-direction). Some important aspects of the air flow are visualized in the figures 2 and 3. Figures 2(b) and (c) show pathlines of the velocity magnitude during inhalation (air flow in positive z-direction) in the 3D model of the sandfish lizard's nasal cavity. The simulation demonstrates that the flow velocities remain close to zero in the olfactory channel and that the main air flow hence goes into the respiratory chamber during the entire respiration pattern.
3.3. Particle simulation
Particles of different sizes (0.1, 0.15, 0.2 and 0.3 mm in diameter) were injected at the entrance (position vector ![$\vec {p} = [0\; 0.5 \; 0.54]$](https://content.cld.iop.org/journals/1748-3190/15/3/036003/revision2/bbab6137ieqn089.gif) ) to the naris at the beginning of the inhalation. All particles were trapped on the mucus-covered surface (capture model, described in section 2.1.3). Gravitational impaction in combination with characteristic cross-flow velocities forced sand grains towards the wall (the flow time is approximately 20 ms until a 0.1 mm particle is trapped). During the exhalation simulation all particles were exhaled within several milliseconds.
) to the naris at the beginning of the inhalation. All particles were trapped on the mucus-covered surface (capture model, described in section 2.1.3). Gravitational impaction in combination with characteristic cross-flow velocities forced sand grains towards the wall (the flow time is approximately 20 ms until a 0.1 mm particle is trapped). During the exhalation simulation all particles were exhaled within several milliseconds.
All particles followed a similar path towards the 'chamber' (see figure 5 for one exemplary particle trajectory). At first the particles moved towards the lower wall of the nasal tract due to gravitational acceleration. The trajectory remained close to the wall until the particles reached the chamber. The previously described experiments prove that particles settle here. Particle trajectories never reached the olfactory tract since velocities remain close to zero there during the entire respiratory cycle.
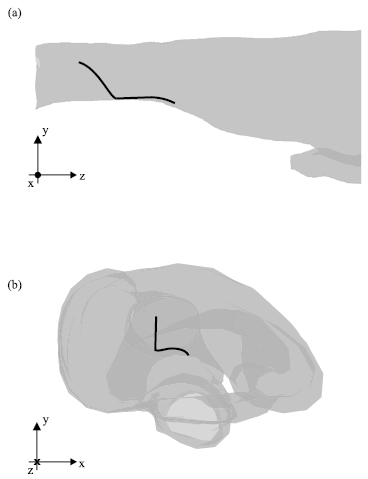
Figure 5. Particle trajectories during inhalation for particles with a diameter of 0.1 mm in (a) lateral, and (b) front view.
Download figure:
Standard image High-resolution image3.3.1. Description of the filtering principle
The nasal cavity of the sandfish lizard has the ability to filter sand particles without a specific physiological filtering system that hinders particles from entering the lungs. Instead, the animal filters particles with an aerodynamic filtering system. The morphology of the upper nasal cavity in combination with characteristic respiration patterns and a mucus-covered wall is designed to aerodynamically filter particles of a certain size.
The filtering system of the sandfish lizard not only prevents sand particles from reaching the trachea but also from reaching the olfactory tract. The geometric properties of the respiratory tract produce a flow-field which hinders particles from entering the olfactory tract. This filtering mechanism comprises a combination of various factors: size and shape of the nasal cavity and the corresponding flow-field, the properties of thin layers of mucus and the respiration pattern. This enables sand grains to be trapped when flow velocities are low during inhalation, and to be released during a fast and intense exhalation.
3.4. Minimum particle size
To roughly estimate the critical particle diameter, we applied a theoretical approach based on Kaufmann et al (1993). The authors described two different contributors to separate particles from a fluid: the gravity-driven and the inertia-driven separation. The critical particle diameter is defined as particle size, where a deposition is no longer possible for 100% of the particles. The theoretically calculated particle size is a rough approximation that has to be validated by simulations or experiments. The results of the theoretical estimation and the simulations are summarized in table 3.
Table 3. Results of minimum particle size estimation and simulation and respective Stokes numbers (St) evaluated for the chamber.
| Approach | Separation mechanism | Density 2650 kg m−3 | Density 1000 kg m−3 | ||
|---|---|---|---|---|---|
dmin ( m) m) |
St | dmin ( m) m) |
St | ||
| Analytical estimation | Gravity | 39 | 4.58 | 63 | 4.51 |
| Inertia | 6 | 0.108 | 9 | 0.092 | |
CFD simulation ( m s−1) m s−1) |
40 | 4.81 | 70 | 5.56 | |
The critical particle diameter for gravity-driven separation is approximately 39  m and was determined by equation (9).
For an estimate of inertia-dominated separation, the particle-relaxation time must be evaluated (equation (12)). This is a characteristic timescale for particles to respond to changes in the flow velocity, which allows for an estimate of the streamline deviation of particles. Considering the flow channel diameter and the mean air velocity during inhalation, the critical diameter for the sandfish is roughly 6  m.
m.
The theoretical calculations were verified by simulations. They show that particles with a diameter of up to 40  m are deposited.
The inertial impaction theory considers an impactor with a circular nozzle. The chamber (see figure 2(a)) could be seen as a biological impactor because of the characteristic shape, which has similarities with a nozzle. Particles however are deposited not after the chamber but in the chamber; therefore inertial impaction plays a minor role in the biological deposition mechanism, whereas the gravity-driven separation is mainly responsible for particle deposition. This statement reflects the simulation results, as the critical particle diameter estimated by gravity-dominated separation (36  m) is in the range of the simulation results (40
  m).
m).
3.4.1. Density adaptation to inhalable particulate matter
Dust particles have a significantly lower density of 1000 kg m−3 (Molhave 2009) than sand particles (2652 kg m−3). Therefore, we also estimated the critical particle diameter for particulate matter. The theoretical approach (Kaufmann et al 1993) lead to a critical particle diameter of 63  m and 9
  m for gravity-driven and inertia-driven separation, respectively. The simulation results show that particles up to 70
  m are filtered.
3.4.2. Stokes numbers of minimum filtered particle size
The Stokes number defined equation (11) has been evaluated for the resulting minimum diameter estimates based on the velocity and length scales of the chamber. The results are also provided in table 3. A comparison of results of particle deposition in the nasopharyngeal region of mice and humans has been conducted by Kolanjiyil et al (2019). Despite the size differences of the respective organs they detected a good agreement of deposition fractions of particles of different sizes based on the Stokes number, especially during inhalation. Kolanjiyil et al (2019) also provide a correlation formula for the deposition rate

Evaluating this relation for the Stokes number estimates for inertial impaction of the sandfish lizard leads to deposition rates of 0.98 and 0.94, respectively, indicating that these would be reasonable estimates of critical particle diameters, if inertial impaction was the primary separation mechanism. This further demonstrates that the sandfish lizard mainly relies on gravitational separation to prevent sand grains from entering its lungs and cannot effectively filter smaller aerosols in its upper respiratory tract.
3.4.3. Analytical estimation for non-spherical particles
A common definition for the sphericity of a particle, sometimes called true sphericity (e.g. Rorato et al (2019)) is
with Aparticle as the particle's surface area and  as the surface area of a sphere of equal volume. The sphericity of sand grains can deviate significantly from the ideal value of one. The minimum sphericity out of samples of two different sand specimens measured by Rorato et al (2019) is 0.5075. Particle drag rises with decreasing sphericity. A comprehensive analytical equation for
  has been developed by Haider and Levenspiel (1989) based on measurements for particles of non-spherical isometric shapes and on free-fall experiments of disk-shaped particles:
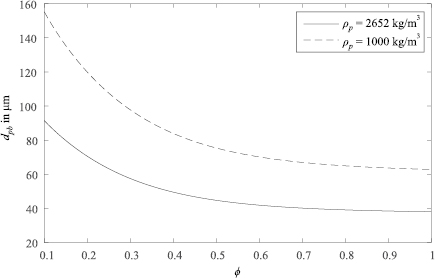
The particle Reynolds number is calculated using the equivalent spherical diameter (diameter of a sphere of equal volume), and the coefficients A, B, C and D are empirical functions of sphericity. The result of Haider and Levenspiel (1989) correlation shows that for low particle Reynolds numbers, relevant during the sandfish lizard's inhalation, the drag coefficient increase of compact particles  is relatively low. Hence, non-spherical sand grain shapes have little impact on particle separation in the chamber of the sandfish's respiratory tract. Estimates of the critical equivalent spherical diameter for buoyancy driven separation according to equation (10) are shown in figure 6. The critical diameter increases with decreasing sphericity. In the sphericity range relevant for sand grains (
 ) the critical diameter estimates change by less than 18%.
Figure 6. Impact of particle sphericity on the critical equivalent spherical particle diameter for gravity-dominated separation for particles of two different densities.
Download figure:
Standard image High-resolution image
3.5. Discussion of a biomimetic filter design
The separation method of the sandfish lizard relies on two main mechanisms, (a) gravitational settling and (b) inertial impaction. Gravitational settling is enhanced by cross-flow in the chamber, where particles settle. The inertial impaction only plays a minor role in the nasal cavities of the sandfish, due to the morphology of the channel. For a biomimetic filtering system this impaction mechanism could be additionally used and hence the critical particle diameter could be significantly reduced, as it was calculated by the theoretical approach (critical particle diameter was determined to be 6  m).
m).
The relevant parameters for both inertial and gravity-driven separation may be adapted to draft a biomimetic particle filter. The gravity-driven separation depends on the critical drift velocity  . This velocity denotes the ratio between the total volume flux and the mucus-covered area
  . By changing these two parameters we can tune the drift velocity and hence the critical particle diameter. The inertia-driven settlement depends on the radius of the nozzle r and the maximum velocity in this area
  . Both parameters can be adapted to change the critical particle diameter. By tuning these separation parameters a particulate filter device based on the sandfish lizard's nasal cavity was designed and recently a patent was filed (Stadler and Krieger 2019). The mucus-covered surface has to be mimicked by a surface that shows equally strong adhesion forces with particulate matter. This could be achieved by (i) treating the surface with an adhesive, (ii) charging it, or (iii) applying a specific structure to the surface.
The filtering unit could be equipped with a self-cleaning mechanism based on the exhalation of the biological model: the filtered particles would be periodically blown out by high velocities that interrupt the adhesion between particles and surface.
4. Conclusion
The nasal cavity of the sandfish lizard has the ability to filter sand particles without a specific physiological filtering system that hinders particles from entering the lungs. Instead, the animal filters particles with an aerodynamic filtering system. The morphology of the upper nasal cavity in combination with characteristic respiration patterns and the mucus-covered wall is designed to aerodynamically filter particles of a certain size. This system is a promising biological model for a novel, membrane-free aerodynamic particle filter including a self-cleaning mechanism.
Acknowledgments
We would like to thank L Leopold for her assistance during simulations, B Mayrhofer for printing the 3D model and P Sloan for proof-reading the manuscript. We declare we have no conflicts of interest.
Author contributions
ATS, MK and WB conceived the study. ATS and MK designed the methodology. ATS designed and conducted the experiments. ATS and MK conceived and carried out the simulations. ATS and MK processed and analyzed the data. ATS and MK wrote and edited the manuscript. All authors gave final approval for publication.