
Abstract
In this study we aim to show how the peltate leaves of Colocasia fallax Schott and Tropaeolum majus L., despite their compact design, achieve a rigid connection between petiole and lamina. We have combined various microscopy techniques and computed tomography (CT) scanning for the analysis of the basic structure of the plant's stabilization system. Mechanical tests yielded key mechanical parameters and allowed us to assess the mode of failure. The results of the tests were further processed in a finite element method (FEM) analysis. We were able to show that both plants are able to endure high loads irrespective of the different composition of the supporting structure. C. fallax forms many separate branched strands, whereas T. majus forms fewer strands of greater diameter interconnected in the centre of the transition area, forming a bundle of irregular orientation. This results in different ways to dissipate loads on the lamina. In C. fallax we observed the outer strands of the strengthening tissue under high stress while the inner bundle carries little load. In T. majus the load is distributed more evenly through the juncture in the middle of the transition area. Potential applications include the construction of biomimetical flying roofs.
Export citation and abstract BibTeX RIS

Original content from this work may be used under the terms of the Creative Commons Attribution 3.0 licence. Any further distribution of this work must maintain attribution to the author(s) and the title of the work, journal citation and DOI.
1. Introduction
Leaves are the main photosynthetic plant organs. Therefore, to collect direct sun light, the orientation of the leaf towards the sun is paramount [1]. As the petiole props up the lamina towards the sun, the leaves are subjected to a multitude of mechanical loads such as gravitational pull, or environmental factors like wind and rain [2–5]. Their petiole, tasked to prop up the leaf 'orthogonally to the local gravity field' [1], hence has to provide mechanical support against bending and twisting actuation induced through the lamina [6] whilst being sufficiently flexible to yield without sustaining damage [2, 5, 7]. Petioles thus can essentially be described as elastic cantilevered beams in a good approximation [8], whereas laminae of foliage leaves operate as stress-skin panels [7]. Although biomechanics of petiole and lamina have each been studied extensively [1–3, 6–11], the transition area from petiole to lamina, has not been the focus of studies so far.
In this regard, peltate leaves are biomechanically especially interesting as the transition area from petiole to lamina realises a substantial change of geometry in a very compact shape. Loads induced through the lamina are redirected into the strengthening structures of the petiole while achieving high stiffness levels. Conversely, in many non-peltate leaves the supporting structures of the petiole merge rectilinearly into the midribs [11, 12].
Leaves with peltate shape are rather scarce in the plant kingdom [13]. They are nonetheless worth further studies, since ground-cover plants often developed a lamina that, like a parasol, spreads out from a central point. From an engineers' perspective this shape allows for the hope of possible applications in civil and mechanical engineering, providing inspiration for the construction of lightweight structures that deform under load without damage instead of rigid and heavyweight structures withstanding the load, similar to the reconfiguration of leaves in high winds [2, 5].
Both Colocasia fallax Schott and Tropaeolum majus L. feature peltate leaves, yet they thrive under different conditions. While both plants are perennial, C. fallax is native to southeastern Asia and the Indian subcontinent where it grows under tropical to subtropical conditions [14]. T. majus originates in the Andes from Bolivia north to Colombia but is today introduced to Europe, North America, Asia, Africa and Australia [15, 16].
As we are examining two species from different plant families in our study, we intend to determine whether the strengthening structures that have evolved in these two plant species differ and how the strengthening structures affect the stability of the leaf with perpendicular load, for instance through rain.
2. Materials and methods
2.1. Plant material
Samples of Colocasia fallax Schott and Tropaeolum majus L. were provided by the Botanical Garden of Technische Universität Dresden, Germany in October and November of 2017. The leaves were selected for external intactness (e.g. no frost or feeding damage) and medium to large size.
C. fallax was cultivated in the greenhouse under tropical conditions. T. majus was cultivated under open air conditions and collected towards the end of the growing season. The different conditions the plants were subjected to have likely affected the plant structure. We would expect the plants to respond by building more strengthening tissue. As the Young's modulus and tensile strength are a measure of force per area, we do not expect a significant effect on the mechanical properties [3].
2.2. Anatomy
Leaf and petiole sizes were measured using a digital calliper with an accuracy of ±0.1 mm for dimensions greater than 1 mm. For smaller dimensions (e.g. leaf thickness) a digital micrometer with an accuracy of ±0.001 mm was used. Cross sections and tangential cuts from leaves and petioles were dissected using a razor blade, then stained with Astra-blue/Safranin (Morphisto GmbH, Frankfurt am Main, Germany) and examined using a reflected light microscope (Olympus SZX16, Olympus Corporation, Tokyo, Japan). Sizes of lignified areas in petiole and leaf venation were assessed via images extracted from the reflected light microscope using the image-processing program ImageJ (National Institutes of Health, Bethesda, Maryland, USA). Additionally, leaf venation was separated up to the second level of branching from the lamina using a razor blade and weighted to compare proportion of venation in the lamina. Weights were determined through a precision scale (Mettler Toledo XA205DU, Mettler Toledo, Columbus, Ohio, USA). Samples were dehydrated following Neinhuis and Edelmann [17], critical-point dried (Bal-Tec CPD030, Balzers, Liechtenstein), gold-sputtered (Emitech K550, Quorum Technologies Ltd, Ashford, UK) and mounted on aluminium stubs with conductive pads. Additionally, some critical-point dried samples were examined using a scanning electron microscope (SEM, Zeiss Supra 40VP, Carl Zeiss Microscopy GmbH, Jena, Germany).
2.3. Computed tomography (CT) scanning
The region of interest was the transition area from petiole to lamina. Therefore, laminae were cut to roughly rotationally symmetric shape (approx. 20 mm diameter of lamina and length of petiole) and critical-point dried.
The CT scanning was performed in a phoenix nanotom 180NF (General Electric, Boston, Massachusetts, USA) with a 5-megapixel detector (CMOS Flat Panel Sensor C7942SK-25, Hamamatsu Photonics K.K., Hamamatsu City, Japan) using a molybdenum target to improve the contrast of samples with low absorbance. The sample was fixed on a horizontal rotary disk between the source and the detector. The volume model was generated by rotating the sample 360° in 0.18° increments. During scanning a tube voltage of 50 kV with a current of 250 µA was applied. Distance between source and object was set to 18 mm with source-detector distance of 330 mm providing a voxel size of 2.7 µm. For the reconstruction of the volume model the software datos|aq (General Electric, Boston, Massachusetts, USA) was used. Further analysis of the 3D model was conducted utilising VGStudio (Volume Graphics GmbH, Heidelberg, Germany).
2.4. Mechanical analysis
Petioles, vascular bundles and intercostal areas of the leaves were examined concerning their Young's modulus, tensile strength, breaking strain as well as mode of failure.
Three different types of leaf areas were examined (see figure 1). The intercostal areas of the lamina (A) were cut to strips of approx. 5 × 40 mm with a razor blade using a wooden template. The veins (B) were separated from the lamina and cut to a length of approx. 40 mm. The petiole was cut into pieces of 40 mm. 49 samples of type A, 50 samples of type B and 11 samples of type C were tested. To avoid rapid dehydration, all samples were stored in water (max. 5 min) until tensile testing to minimize loss of turgor pressure, as in living, water-saturated plants, cell wall pressure is equal to the osmotic pressure so that the suction power of the cell is zero [18, 19].

Figure 1. Sample preparation for tensile testing of C. fallax (left) and T. majus (right). Sections for testing of lamina (A), leaf venation (B) and petiole (C).
Download figure:
Standard image High-resolution imageYoung's modulus, tensile strength and breaking strain were determined using a tensile testing machine (zwickiLine Z2.5 TS, Zwick Roell Group, Ulm, Germany) with screw grips type 8133. Jaw inserts type 313902 were equipped with an additional layer of thin thermoplastic polyurethane to prevent slippage of the tensile specimens. Clamping length was set to 10 mm, pre-load to 0.01 N and testing speed to 1 mm min−1. Resulting forces were recorded by the 50 N load cell (KAP-S/50 N, AST GmbH, Dresden, Germany) through the software testXpert (Zwick Roell Group, Ulm, Germany). All tests were performed until failure.
To check for statistical significance the measured values were checked for normal distribution using the Shapiro–Wilk test. Normally distributed values were verified using the Student's t-test. Non-normally distributed values were verified using the Mann–Whitney U-test.
All values were analysed using Excel 2016 (Microsoft Corporation, Redmond, Washington, USA) with the add-in XLSTAT (Addinsoft, Paris, France) and Origin 2017 (OriginLab Corporation, Northampton, Massachusetts, USA).
To obtain approximate mechanical properties for both strengthening tissue and ground tissue, the measured values from the tensile tests were put in proportion with their respective share in the total area of the cuts of the petiole and leaf venation. As the lamina contains very little strengthening tissue its mechanical properties were accepted as those of the ground tissue (EG). With the tensile test yielding the upper-bound Young's modulus EC (combined Young's modulus of strengthening and ground tissue with loading parallel to the fibres) it was thus possible to use the rule of mixtures [20, 21] to calculate ES (Young's modulus of the strengthening tissue):
where  is the area fraction of the strengthening tissue while the subscript indicates either strengthening tissue or ground tissue. Values for maximum tensile strength were calculated accordingly.
To determine the mode of failure of the intact leaf a single leaf was placed in a custom-made mechanical mount (figure 7). The mount does not allow the petiole to flex, thus forcing the deformation to occur in the transition zone rather than in the petiole. A uniformly distributed load was applied by adding layers of fabric pre-cut to match the outline of the leaf. All tests were performed until buckling of the lamina or slippage of stack of fabric. Resulting deformation was captured by digital camera (Sony a6000, Sony Corporation, Tokyo, Japan) and manually aligned with Adobe Photoshop CS7 (Adobe Systems Software Ltd, Ireland). Leaf dimensions, weight of load applied, displacement and angular change of leaf were analysed using Microsoft Excel 2016 and ImageJ.
2.5. CAD modelling and FE analysis
The data obtained through anatomical analysis were idealised and adapted to a computer aided design (CAD) model (figure 8) in Solidworks 2017 (Dassault Systèmes, Vélizy-Villacoublay, France). Model dimensions were defined as: lamina diameter 20 mm, petiole diameter 2 mm and length 6 mm. Finite element analysis was used to compare the behaviour of the structures of C. fallax and T. majus in regards to stress distribution and displacement with loads applied.
The simulations were carried out with a geometrically nonlinear static solver to obtain accurate results for large displacements (SOL 106 with large displacement option enabled) in NX 11 (Siemens PLM Software, Plano, Texas, USA). Material properties were treated as linear. All models were discretized by 3D tetrahedral elements. For the xylem rods, we chose six evenly distributed elements per cross section. The model was halved lengthwise along the mirror axis to reduce the computing power needed. A symmetric constraint was applied to the cross section, the petiole base was set as fixed. Parenchyma and strengthening tissue were meshed separately, nodes on adjoining faces of the two bodies were mated to block displacement between parenchyma and strengthening tissue. Regions where mesh mating could not be used were joined using surface-to-surface glue with a very high Young's modulus.
As load the force of a single rain drop located on a horizontal leaf (50 mN) [22] was chosen. In conjunction with the maximum resulting pressure of 113.2 kPa [23] the area of contact was calculated to 0.442 mm2 or a circle with a diameter of 0.75 mm. The force was applied as a static distributed load along the Y-axis. Effects of gravity were neglected.
To evaluate the effect of the strengthening tissue in C. fallax and T. majus both models were calculated in two variants, one using a composite of ground and strengthening tissue and one using solely ground tissue for the entire structure.
Equivalent (von Mises) stress distribution is used to predict whether a material will yield or fracture [24].
3. Results and discussion
3.1. Morphology and anatomy
The leaves of T. majus had a diameter of 95 ± 5 mm with a fresh weight of 981 ± 98 mg (dry weight: 164 ± 17 mg), while the petiole diameter measured 2.6 ± 0.2 mm at the point closest to the leaf. The leaves of C. fallax were 133 ± 23 mm long and 823 ± 13 mm wide with fresh weights of 886 ± 329 mg (dry weight: 166 ± 54 mg). The petiole diameter measured 2.7 ± 0.4 mm.
Samples of petiole of C. fallax and T. majus were analysed by reflected light microscope to determine the area ratio of strengthening tissue in the specimen. Figure 2 shows cross sections of petiole. As strengthening tissue both samples contain xylem, additionally C. fallax forms sclerenchymatic tissue next to the vascular bundles whereas T. majus forms collenchymatic strengthening tissue in peripheral areas of the petiole. The vascular bundles are embedded in parenchyma (distinguished through thin cell walls), epidermal tissue delimits the petiole.
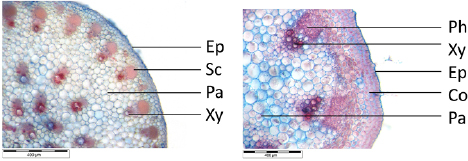
Figure 2. Anatomy of petiole cross section of C. fallax (left) and T. majus (right) as seen in light microscope. Co—collenchyma, Ep—epidermis, Pa—parenchyma, Ph—phloem, Sc—sclerenchyma cap, Xy—xylem.
Download figure:
Standard image High-resolution imageAs shown in table 1, analysis of areas with strengthening tissue (xylem and sclerenchyma) compared to total area of the cross section demonstrated higher content of strengthening tissue in C. fallax than in T. majus. Determined values were used for CAD modelling and FE simulation.
Table 1. Ratio of strengthening tissue in petiole and lamina of C. fallax and T. majus.
| C. fallax | T. majus | |
|---|---|---|
| Petiole | 5.9% ± 0.8% | 3.4% ± 0.4% |
| Lamina | 3.0% ± 0.2% | 2.7% ± 0.3% |
| Average | 4.45% | 3.05% |
Several cuttings in the transition area from petiole to lamina help obtain a better impression of the arrangement of the strengthening tissue in the region of interest (figure 3). As revealed C. fallax uses a multitude of non-interconnected branched strands (figures 4(A1) and (A2), whereas T. majus utilises fewer strands of greater diameter interconnected in the centre of the transition area (figures 4(B1) and (B2), where they form a bundle of irregular orientation.
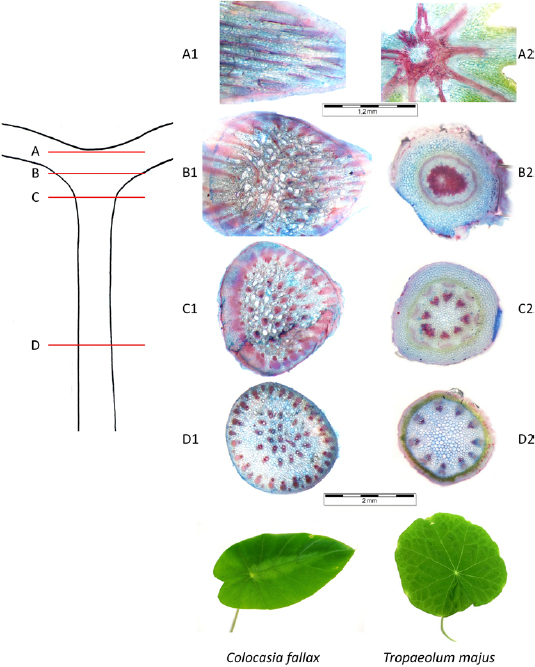
Figure 3. Arrangement of lignified tissue (red) in the transition area between petiole and lamina in C. fallax and T. majus. Position of cuttings is shown in schematic diagram on the left (markings (A)–(D)). Isolated fibre strands (D1) and (C1) branch in B1 and proceed to further single strands (A1). Isolated fibre strands in D2 approximate continuously over C2 to one knot in B2 prior to subdividing into radial branches (A2).
Download figure:
Standard image High-resolution image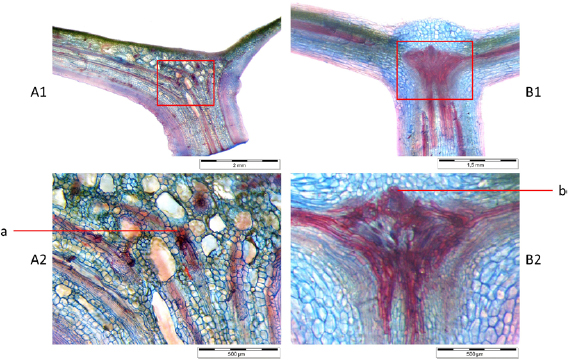
Figure 4. Longitudinal sections of transition area showing lignified tissue (red) that acts as strengthening structure in C. fallax (left) and T. majus (right). (A1) and (A2) Fibre strands branch (a) into multiple strands. (B1) and (B2) Fibre stands approximate and assemble in a knot with noticeable tip (b) from where they separate into the leaf venation.
Download figure:
Standard image High-resolution imageLongitudinal sections were analysed using a reflected light microscope to verify the findings of the different fibre orientations in C. fallax and T. majus. Figures 4(A2(a)) reveals the branching of the strands of sclerenchyma in C. fallax. B1 and B2 show how the lignified tissue converges in a knot in T. majus.
SEM analysis was used to document the area of interest in more detail (figure 5). Results confirm findings from reflected light microscopy. In C. fallax the sclerenchymatic fibres follow a clear orientation whereas T. majus shows a tangled configuration of xylem vessels in the central knot. Only C. fallax contains strands of sclerenchyma whereas T. majus utilizes xylem vessels and collenchyma for reinforcement.

Figure 5. Longitudinal sections as seen in SEM of C. fallax (left) and T. majus (right). (a) longitudinal cut of sclerenchyma strand, (b) cross section of sclerenchyma, (c) vascular bundle, (d) cross section of xylem vessel. (A1)–(A3) Clear orientation of sclerenchymatic fibres. (B1)–(B3) Tangled configuration of xylem vessels. Images by Markus Günther.
Download figure:
Standard image High-resolution image3.2. CT analysis
3D model generated by reconstruction software enables pursuance of the fibre arrangement in the samples. Tissue of low density was hidden from the visualisation so mainly the strengthening tissue remains visible in figure 6. The top view in (A2) shows the sclerenchymatic strands in the transition area of C. fallax. The individual strands branch several times, whereas no merging of separate strands could be observed.

Figure 6. Areas of strengthening tissue in C. fallax (left) and T. majus (right) made visible through CT scanning. A/B1—Longitudinal sections. A/B2—Top view of sample.
Download figure:
Standard image High-resolution imageApart from the lignified tissue the samples of T. majus contain collenchymatic tissue beneath the epidermis. Since no material properties for the collenchyma could be determined it was not separately considered for further analysis.
As visible in figure 6, the samples of T. majus contain small spherical particles of a density similar to the analysed strengthening tissue. The origin of these artefacts remains unclear. They were not visible through any of the microscopy techniques and can therefore presumably be traced back to the drying process.
Information on the fibre arrangement gathered trough CT scanning was abstracted and then used as basis for the generation of the CAD model.
3.3. Mechanical analysis
By means of the distributed load test the modes of failure of the leaves could be identified as either tilting or folding of the lamina (figure 7). All deformation was elastic, no permanent deformation or damage could be observed. Permanent damage was avoided by sliding of applied loads. C. fallax showed only tilting of the lamina, whereas in T. majus either folding or tilting of the lamina could be observed. For C. fallax, deformation occurred mainly in the petiole due to a seemingly rigid lamina and transition zone, whereas in T. majus most deformation took place at the junction where the petiole merges into the lamina (figure 7).
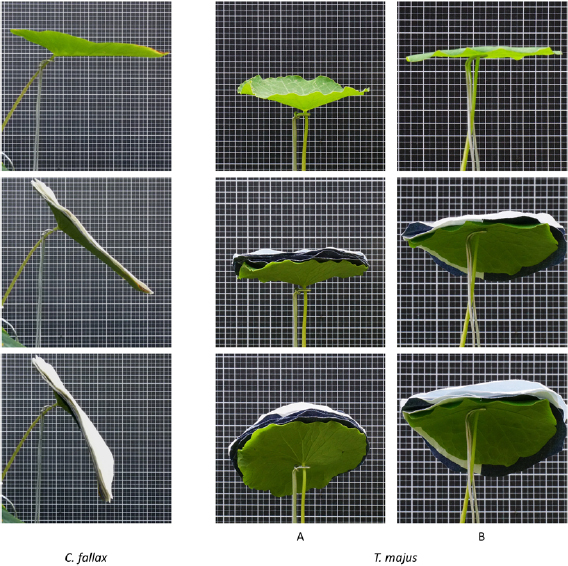
Figure 7. Comparison of mode of failure for C. fallax and T. majus. (A) Tilting of lamina. (B) Folding of lamina.
Download figure:
Standard image High-resolution imageThe tests assert no claim of quantitative description but merely seek to compare the deformation behaviour of the two plant species as well as to give a rough estimate of the expectable deformation (table 2).
Table 2. Deformation with distributed load applied. Leaf dimensions were measured as maximum length for C. fallax or maximum diameter for T. majus.
| C. fallax | T. majus A | T. majus B | |
|---|---|---|---|
| Deformation behaviour | Tilting | Tilting | Folding |
| Average dimension of leaf [cm] | 14.8 ± 2.6 | 12.1 ± 0.9 | 12.0 ± 0.4 |
| Average load applied per iteration [g] | 0.96 ± 0.07 | 1.39 ± 0.02 | 1.36 ± 0.01 |
| Maximum load applied [g] | 7.30 ± 1.02 | 10.27 ± 1.08 | 8.14 ± 1.00 |
| Average deformation [deg] | 3.81 ± 0.62 | 6.29 ± 1.68 | 8.06 ± 2.73 |
| Max deformation [deg] | 28.17 ± 4.01 | 40.05 ± 9.28 | 52.72 ± 3.22 |
| Avg. deformation/weight [deg g−1] | 3.96 | 4.52 | 5.95 |
Values determined through tensile testing for structural Young's modulus (E), tensile strength and breaking strain are summarised in tables 3 and 4. Material properties for collenchyma could not be determined, however since the collenchyma was not removed from the test samples its influence is included in the results shown in table 4.
Table 3. Results of mechanical testing of C. fallax.
| n | Structural E [N mm−2] | Tensile strength [N mm−2] | Breaking strain [%] | |
|---|---|---|---|---|
| Venation | 49 | 95.04 ± 12.06 | 7.00 ± 1.32 | 14.97 ± 5.34 |
| Blade | 50 | 8.06 ± 2.61 | 0.97 ± 0.18 | 16.69 ± 2.33 |
| Petiole | 11 | 45.49 ± 9.23 | 2.15 ± 0.24 | 14.29 ± 3.61 |
Table 4. Results of mechanical testing of T. majus.
| n | Structural E [N mm−2] | Tensile strength [N mm−2] | Breaking strain [%] | |
|---|---|---|---|---|
| Venation | 49 | 61.32 ± 11.79 | 5.46 ± 0.83 | 24.76 ± 6.81 |
| Blade | 50 | 3.00 ± 0.62 | 0.48 ± 0.10 | 29.31 ± 6.87 |
| Petiole | 11 | 21.39 ± 2.40 | 3.32 ± 0.86 | 33.37 ± 13.42 |
The results show more rigid structures in the test series of C. fallax with the exception of the tensile strength in the petiole. Compared to T. majus the average structural Young's modulus of C. fallax is 2.1 times and the tensile strength is 1.3 times higher while the breaking strain is 1.9 times higher in T. majus.
Overall, the highest mechanical strength can be found in the venation of both plants. The leaf seems to be propped up in large part by the venation as the mechanical properties of the lamina are considerably lower.
Shapiro–Wilk test shows normal distribution for most test series. T and u-test showed p -values smaller than 0.0001 (alpha set to 0.95), verifying that each two sets of data are significantly different from each other.
The calculations according to the rule of mixtures produced a mean value of 591.9 N mm−2 for the Young's modulus of the strengthening tissue in C. fallax and 440.1 N mm−2 for T. majus. These values will serve as data basis for the FEM calculations (see table 5).
Table 5. Structural E and tensile strength of strengthening tissue according to the rule of mixtures.
| Structural E [N mm−2] | Tensile strength [N mm−2] | |
|---|---|---|
| C. fallax | 591.9 | 38.6 |
| T. majus | 440.1 | 46.7 |
Owing to natural variability, i.e. differences in cell wall thickness and shape, it is common for biological materials to show large variability in their mechanical properties [3, 7, 25, 26]. The mechanical properties within the tissue type of one and the same plant can vary considerably owing to physiological changes, especially in thin-walled living tissues like parenchyma or collenchyma, where the cell turgor has a dramatic effect on stiffness [6, 7, 27–31].
In summation, the values determined for Young's modulus (E) and tensile strength according to the rule of mixtures (see table 5) seem plausible [10, 32].
3.4. FEM analysis
Material properties of the plant tissues in the model were derived from tensile testing according to lamina, vein and petiole. By idealising the tissue isotropic and linear elastic behaviour was assumed. Since no material properties for the collenchyma could be determined it was not separately considered for the CAD model. CAD models contain similar shares of strengthening tissue as plants analysed (see table 1).
As the material model is simple and the related parameters are not accurately known, it neglects the complexity of the biological tissue. For this reason, no quantitative values for stresses could be evaluated, but the given values allow for a good first-order estimation. All values calculated for the stresses in the strengthening tissue are lower than the tensile strength and comply with the range of expectations (see tables 5 and 6 for comparison). In summary, this implies that the load acting on the lamina does not cause structural damage.
Table 6. Values for load tests calculated by Siemens NX Nastran, SOL106.
| Composition | max. deflection [mm] | max. stress [N mm−2] | |
|---|---|---|---|
| C. fallax | Ground + strengthening tissue | 2.59 | 10.21 |
| Ground tissue | 6.49 | 0.74 | |
| T. majus | Ground + strengthening tissue | 3.90 | 23.72 |
| Ground tissue | 8.93 | 1.07 |
FEM calculations revealed y-deflections more than two times higher in the models consisting entirely of ground tissue (see table 6 and figure 9). This shows a considerable influence of the strengthening tissue even at small proportions. Tilting of the side of the lamina without load is more pronounced in C. fallax than in T. majus.

Figure 8. CAD models of C. fallax (left) and T. majus (right). Red = xylem (T. majus) or sclerenchyma (C. fallax), green = parenchyma and epidermis.
Download figure:
Standard image High-resolution image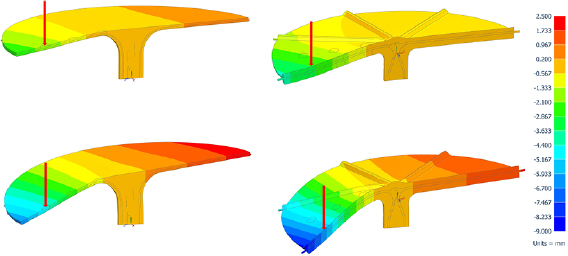
Figure 9. y -deflection for models of C. fallax (left) and T. majus (right). Upper row calculated using composite of ground and strengthening tissue. Lower row calculated as solely ground tissue for comparison. Blue areas show negative displacement and red areas show postive displacement.
Download figure:
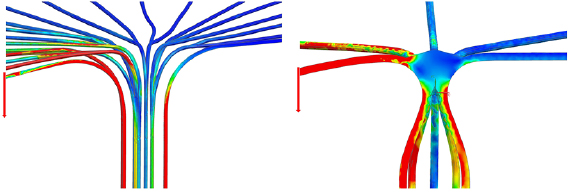
Standard image High-resolution imageLoad transfer from lamina to petiole (figure 10) is visualized using von Mises stress distribution. The model of C. fallax shows single outer strands of the strengthening tissue under high stress while the inner bundle carries little load. In T. majus the load is distributed more evenly through the juncture in the middle of the transition area, with each of the strands carrying part of the load.
Figure 10. Stress distribution (von Mises) along the strengthening tissue of C. fallax (left) and T. majus (right). Areas of high stress shown in red, areas of low stress shown in blue.
Download figure:
Standard image High-resolution image
Since all FEM calculations were performed on the idealised models, the outcome provides a qualitative picture of deformation and stress. The aim of the FEM calculation was to examine the behaviour of the plant species under load, however, this does not yet allow direct conclusions for technical applications. Future studies might use a more detailed model to obtain more detailed results.
As both plants underwent countless adaptation processes along their evolution, different variants are likely, of which no discernible preferred variant could be found in this study. Each species has adapted to the predominant conditions in their respective area of distribution, evolving their own structure to transfer the load from the lamina into the petiole. Further studies with other species will help to derive overall principles for the construction and functionability of peltate leaves.
Both variants seem to have their advantage, while the structure of the strengthening tissue in C. fallax is more delicate than in T. majus, due to the multitude of strands the lamina of C. fallax constitutes a more homogenous and thus more robust tissue. In T. majus, loads striking the lamina have a much higher chance of hitting ground tissue only as the strengthening structure is built more sturdily, but with fewer strands (see figure 6). On the other hand, the knot in the transition area of T. majus helps distributing loads induced through the lamina more evenly into the petiole and thus causes the minimization of the tilting of the side of the leaf without load. Furthermore, in T. majus tensile forces acting on opposing sides of the lamina can be dissipated entirely through the strengthening tissue, whereas in C. fallax the strands of strengthening tissue turn towards the petiole in the transition area—there is no direct connection of strengthening tissue from one part of the lamina to another. This means that loads pulling on opposing sides have to be transferred entirely through the ground tissue for short distances. Due to the material properties being much lower in the ground tissue (see table 3) this might lead to damage. Admittedly, this scenario is rather uncommon in nature. Moreover, as the real leaf is not rotationally symmetric it will most likely tilt or, through other forms of reconfiguration, evade most loads strong enough to damage the lamina.
When transferring the structures studied into civil or mechanical engineering structures that require a flexible yet strong connecting element come to mind, to be used in sun shades or tree-like, branching structures [33].
However, when scaling, the structures would have to be adapted and evaluated extensively owing to the increasing amount of building material required if the system is to remain stable [34–36]. Choice of materials, manufacturing method and other variables have to be considered to be able to weigh the feasibility.
Previous studies have examined how various plants deal with loading [2, 5]. A well-known phenomenon is that plants evolved elastic structures that deform in high winds to reduce drag. We, too, studied the reaction of leaves to mechanical stress, but the focus of our analysis was on the effect of forces exerted perpendicular to the lamina, as T. majus and C. fallax are ground-covering plants. Our model also differs from the one in the leaf reconfiguration studies in that we focus on the junction of lamina and petiole. In our study it was possible to show how forces are absorbed by the supporting structure if they cannot be evaded. Therefore, our study helps with the transfer to lightweight structures, such as fibre reinforced composites, since those fibres are often processed in elongated strands and could be used to trace the path of the supporting structure in the examined plants.
4. Conclusion
In this paper we analysed strengthening structures in leaves of C. fallax and T. majus to help explain how peltate plant leaves handle mechanical stress.
Mechanical testing shows that the strengthening structures in both plant species meet high requirements. Still, microscopic analysis revealed different designs of support structures. Both plant species contain xylem as strengthening tissue, while C. fallax forms sclerenchymatic tissue next to the vascular bundles, T. majus forms collenchymatic tissue underneath the epidermis. Samples of C. fallax contained approx. 50% more strengthening tissue than T. majus.
C. fallax forms many separate branched strands, whereas T. majus forms fewer strands of greater diameter interconnected in the centre of the transition area, forming a bundle of irregular orientation. Distributed load tests showed that for C. fallax, deformation occurred mainly in the petiole due to a seemingly rigid lamina and transition zone. In T. majus most deformation took place at the junction where the petiole morphs into the lamina.
FEM calculations based on material properties determined through mechanical testing show single outer strands of the strengthening tissue of C. fallax under high stress while the inner bundle carries little load. In T. majus the load is distributed more evenly through the juncture in the middle of the transition area, with each of the strands carrying part of the load.
Both structures are well suited for the design of flying roofs or sunshades. Due to the different construction both have their respective strengths: As the knot-like junction in T. majus distributes the forces evenly over the cross-section into the petiole, the deformation mainly takes place in the junction area. Thus, the junction is theoretically well suited as a template for flexible transitions between stable load-bearing structures and flying roofs or similar flat structures. In C. fallax the deformation mainly takes place in the petiole. Designs inspired by the strengthening structure consisting of individual strands, allow for better adaptation to specific load cases, while at the same time providing greater failure tolerance.
Acknowledgments
The authors would like to thank the Botanical Garden of Technische Universität Dresden for the plant samples, and Dipl.-Ing. Marek Danczak, Dipl.-Ing. Vinzenz Geske, Markus Günther and Dipl.-Ing. Moritz Kuhtz for their support.