

Abstract
Owls are widely known for silent flight, achieving remarkably low noise gliding and flapping flights owing to their unique wing morphologies, which are normally characterized by leading-edge serrations, trailing-edge fringes and velvet-like surfaces. How these morphological features affect aerodynamic force production and sound suppression or noise reduction, however, is still not well known. Here we address an integrated study of owl-inspired single feather wing models with and without leading-edge serrations by combining large-eddy simulations (LES) with particle-image velocimetry (PIV) and force measurements in a low-speed wind tunnel. With velocity and pressure spectra analysis, we demonstrate that leading-edge serrations can passively control the laminar-turbulent transition over the upper wing surface, i.e. the suction surface at all angles of attack (0° < AoA < 20°), and hence play a crucial role in aerodynamic force and sound production. We find that there exists a tradeoff between force production and sound suppression: serrated leading-edges reduce aerodynamic performance at lower AoAs < 15° compared to clean leading-edges but are capable of achieving both noise reduction and aerodynamic performance at higher AoAs > 15° where owl wings often reach in flight. Our results indicate that the owl-inspired leading-edge serrations may be a useful device for aero-acoustic control in biomimetic rotor designs for wind turbines, aircrafts, multi-rotor drones as well as other fluid machinery.
Export citation and abstract BibTeX RIS
1. Introduction
Owls are widely known for silent flight, achieving remarkably low noise gliding and flapping flights owing to their unique wing morphologies, which are normally characterized by leading-edge serrations [1–8], trailing-edge fringes [1, 9–12] and velvet-like surfaces [1, 13–15]. Barn owls (Tyto alba) and barred owls (Strix varia) can suppress the wing-induced aerodynamic sound to an extremely lower level of a frequency below 2 kHz during gliding or flapping flight [16], which allows them to be capable of attacking prey like mice and voles easily. Such aerodynamic sound suppression is achieved even below the hearing ranges of owls themselves [16], which is also important for them to refrain from distracting because owls require extreme concentration on their bi-aural hearing systems to localize prey during flight. Novel mechanisms associated with silent owl flight have therefore considerable potential for shedding light on improving the technologies of noise reduction in blades or rotors of wind turbines, aircrafts as well as multi-rotor drones [17–21].
While being a long-standing problem that the unique owl-wing morphologies show apparent association with aerodynamic force production and sound suppression, it remains unclear how the three morphological characteristics correlate with the aero-acoustic mechanisms. Graham [22] first reported that most species of owl evolved a unique wing structure with adaptations such as the comb-like serrations at leading-edge, fringes at trailing-edge and a velvety wing surface. Kroeger et al [23] later demonstrated experimentally that without leading-edge serrations and trailing-edge fringes, modified owl wings emitted sounds as noisy as other birds with a similar body mass did while flying at a similar speed. Bachmann et al [3] presented a study of morphometric characterization of wing feathers of the barn owl, including characteristics and morphology of feathers, barbs, radiates in detail. A specific focus was given on the comb-like serrations, which could merely be found in very few feathers that form the distal part of the wing's leading-edge. They reported that each serration was indeed the tip of a single barb, having a very complicated 3D shape, and the size and orientation of the serration differed depending on its spanwise position.
Bachmann et al [3] reported that owls have much larger wing areas compared to pigeon with the same body mass, which results in a reduced wing loading. This allows owls to glide at a relative lower speed of 2.5–7.5 m s−1 [7] while approaching the prey, and hence prevents extra noise emission. However, around a wing moving at the lower Reynolds numbers of owl flight, i.e. 20 000 < Re < 80 000 based on a chord length of approximately 150 mm, an inevitable separation bubble or leading-edge vortex is normally observed on the suction surface due to laminar-turbulent transition. This bubble or leading-edge vortex varies in shape and strength dependent upon moving velocities and angles of attack, normally enhancing aerodynamic noise production. And the unsteadiness of the separation bubble may lower the aerodynamic performance in flight maneuvers. Therefore, in addition to the general wing morphology and geometry, owls further require some novel flow control mechanisms, likely by using their unique wing structures to stabilize the suction surface flow and hence achieve silent flight. Bachmann et al [4] further investigated the 3D characterization of natural serrations and reconstructed a highly approximated serration model for biomimetic applications based on quantitative morphometric data. Klän et al [13] digitized natural wings through the scanning 3D surface of dead owls and reconstructed geometric wing models to yield a smooth surface while fixing the increased camber based on drying or narcotizing of the birds. They then built up a clean wing model and used it as a reference case resembling the basic wing geometry. Aerodynamic characteristics of the artificial models were then studied through particle-image velocimetry (PIV) and force measurements, for both clean and serrated wing models in a wind tunnel [6, 7]. It was found that, at lower angles of attack (0° ⩽ AoA ⩽ 6°), the serrations seemed to stabilize the flow by passively controlling the boundary layer and separation bubble, but the artificial leading-edge serrations obviously lowered the aerodynamic performance compared to a clean model. More recently, acoustic measurements on live owls [24] or realistic owl wing specimens [2, 25, 26] identified the sound suppression characteristics compared with non-silent common buzzard (Buteo buteo) or non-serrated wings.
As known the leading-edge serrations likely provide a trade-off between aerodynamic force production and sound suppression, and hence play a crucial role in achieving silent flight of owls. However, the essential underlying mechanisms, such as how the serrated-structures influence the flow separations (or instability) and how this affects the force production, remain unclear so far. In this study, aiming at providing a comprehensive understanding of the underlying serration-based aero-acoustic phenomenon, we herein address an integrated study by combining low-speed wind tunnel experiments (section 2.2) and computational fluid dynamic (CFD) modeling (section 2.3) with owl-inspired single-feather wing models (section 2.1). Based on the simulated flow structures around clean and serrated models (section 3.1), we give an extensive discussion on how the serrations are capable of passively controlling laminar-turbulent transition and the associated swirling features of leading-edge vortices (section 4.1). Further with an integrated analysis of the simulated velocity spectra, sound spectra, as well as aerodynamic forces (section 3.2), we discuss how the serration-based flows can suppress the vortex shedding-induced instability and hence sound emission, as well as their correlations with lift and drag coefficients, and lift-to-drag ratios (section 4.2).
2. Material and methods
2.1. An owl-inspired single-feather wing model with leading-edge serrations
An owl-inspired single-feather wing model with leading-edge serrations is chosen for both experiments and simulations, which is based on the distal single feather at the vane of the outermost remex of the right wing of a female Ural owl (Strix uralensis) (figure 1(A)). The specimen was collected in Iwate Prefecture, Japan and provided by Yamashina Institute for Ornithology. As illustrated in figure 1(A), the owl's wing consists of an arm-wing (colored cyan) and a hand-wing (colored orange). The arm-wing is structured by bones and muscles, and covered by velvety coverts that densely overlapped on the skin, forming a rounded leading-edge. The hand-wing is made up of remiges (or flight feathers) only with sharp leading- and trailing-edge. The vane of the outermost remex shows a comb-like serrated leading-edge (figure 1(B)). The second outermost remex has smaller serrations on its vane, overlapping with adjacent feathers to form a continuous wing surface, which acts as a secondary serrated leading-edge.
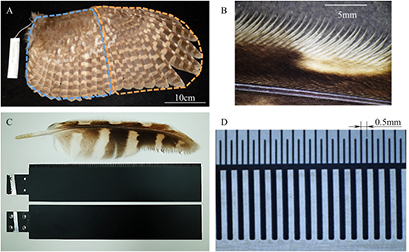
Figure 1. (A) Right wing of a female ural owl (strix uralensis). The arm and hand wings are highlighted by cyan and orange dashed lines, respectively. (B) The comb-like serrated leading-edge at the vane of the outermost remex. (C) Owl single feather (top)-inspired wing models with serrated (middle) and clean (bottom) leading-edges. (D) Close-up view of the leading-edge serrations of the wing models.
Download figure:
Standard image High-resolution imageMotivated by the serrated leading-edge at the vane of the outermost remex, we fabricated two artificial single-feather wing models (figure 1(C)) as 2D rectangular models of leading-edge serrations with different configurations by using a wire electric discharge machine. Note that with a specific focus on the essential aerodynamic effects of comb-like serrations we here neglected the inclination (bend and twist) angles and the realistic 3D shapes of the serrations. Both models have dimensions of 150 × 30 mm with an aspect ratio of AR = 5, identical to the outermost remex. For simplicity and tractability, the cross-section is set to be rectangular with a uniform thickness of 0.5 or 1 mm for both models. The serration-like leading-edge structures of the model are distributed uniformly with a length of 3 mm, matching the real serrations of the owl, approximately 10% of the chord length, with the same spacing and width of 0.5 mm (figure 1(D)).
Although the wing motions of free-flying owls generally show complex patterns in wing kinematics and deformations as reported by Wolf et al [27], as our first step to investigate the essential mechanisms of the leading-edge serrations in steady flow condition, here we pay specific attention to the aerodynamic characteristics of the single-feather models traveling in a uniform incoming flow.
2.2. Low-speed wind tunnel experiments
Flow fields and aerodynamic characteristics of the single-feather wing model with leading-edge serrations were firstly measured with an ultra low-speed wind tunnel, which was specifically designed to have a test section of 1 × 1 × 2 m and to be capable for achieving a smooth air-flow (⩽2% turbulence) ranging from 0.5 to 11.0 m s−1. The airflow speed was set to be 3.0 m s−1, which is within the range of the normal flying speed of owls when attacking prey [7].
The single-feather wing models that sit at the center of the test section were put on a rotational motorized stage (SGSP-80YAW, SIGMAKOKI) and attached onto a 6DoF load cell (Nano17Ti, ATI). Time-varying dynamic forces (3000 Hz) acting upon the models were measured and averaged over 10 s to obtain the time-averaged (steady) aerodynamic forces. Near-field flow structures around the models were measured with a PIV system equipped into the low-speed wind tunnel, which was seeded with DEHS mist (1 µm of diameter) generated by a seeding generator (PivPart14, PivTec). The vertical streamwise plane at mid-wing span was illuminated by a laser light generated by a pulsed laser (532 nm, LDP-100 MQG, LeeLaser), which is guided to the top of the test section through optic fiber and then diverged into a 2 mm band sheet through a cylindrical lens with a pulse separation interval of 120 µs. The laser-sheeted area around the wing model (70 × 70 mm) was filmed at 350 Hz by a high-speed camera (FASTCAM SA3, Photron) fitted with a macro lens (150 mm F2.8, SIGMA). The PIV-based filming system was driven by a controller, LC880, LabSmith; and the images were processed by commercial software, Koncerto II, Seika Digital Image. The correlation window was set to have 24 × 24 pixels with 50% overlapped to yield 84 × 84 vectors within one PIV image. The average pixel separation during 120 µs is about 4–5 pixels, with the sub-pixel accuracy of 0.2 pixel according to the manufacturer, which leads to the estimated error of the velocity field between 4–5%. The resulting vectors were further filtered through a threshold to remove the vectors with relatively higher values, which was defined by the standard deviation and the median. The flow velocity field was then calculated by averaging the vectors over 2 s.
2.3. CFD modeling
To investigate the feature and mechanisms of the near-field flow structures as well as their correlations with aerodynamic force produciton, we then carried out an extensive simulation-based study through CFD modeling of large-scale separated flows with consideration of laminar-turbulent transition.
As illustrated in figure 2(A), we here introduced two idealized single-feather wing models with an infinite wingspan, involving a leading-edge-serrated wing model and a clean wing model without serrations. Note that with consideration of the infinite wingspan it is reasonable to make CFD modeling of merely one element of the infinite wing and apply transitional periodic boundary conditions on two sides, which leads to a large reduction in computing time. This infinite wingspan model makes it capable to focus on investigating the essential 2D mechanisms associated with leading-edge serrations while neglecting the complexity of 3D effects. The basic geometric characteristics are summarized in table 1. The coordinate system is defined as in figure 2(A) with its origin at the left side of the leading-edge and located in the middle of the upper and lower surfaces. With consideration of the fact that the force (lift and drag forces) measurements of the artificial single-feather wing models showed little differences associated with the wing thickness, here we defined our CFD wing model with a thickness of 0.67 mm in-between the range (0.5–1.0 mm) of the artificial wing models.
Table 1. Basic geometric characteristics of the computational models.
| Chord length | c | 30 mm |
| Span | b | 3 mm |
| Thickness | s | 0.67 mm |
| Length of serrations | l | 3 mm |
| Width of serrations | w | 0.5 mm |
| Interval between serrations | d | 1 mm |

Figure 2. (A) Computational model of an owl-inspired single-feather wing, with clean and serrated leading-edges. Computational domains and grids: (B) H-type structured grids (green) for far-field domain and (C) 'Octree' unstructured grids (purple) for near-field domain. (D) Close-up view of the grids at leading-edge.
Download figure:
Standard image High-resolution imageTo resolve boundary layers and laminar-turbulent transition as well as flow separation around the wing model, a multi-blocked hybrid grid system (figures 2(B) and (C)) was employed with the near-field domain of 0.5c from the wing surface, where c is the chord length. The grids were clustered to the wing surface with the minimum grid spacing adjacent to the surface controlled by a formula  , where Re is the chord-based Reynolds number. H-type structured grids were generated for the far-field domain with a distance of 20c from the wing surface. Given the free-stream velocity Uref = 3 m s−1 and the chord length c = 3 cm, a chord-based Reynolds number was calculated to be Re = 6000. An initial velocity fluctuation was set as 2% Uref, which is identical to the turbulence intensity of the wind tunnel. A broad range of angles of attack (AoAs) over 0° ⩽ AoA ⩽ 20° was taken into consideration in the CFD modeling based on the measurements by Wolf et al [27] in which the effective angle of attack was observed to range from −20° to 20° in flapping flights of barn owls. All simulations were performed with a time step of 5 × 10⁻⁵ s up to 1 s when the flow fields turned to be stable.
With consideration of the large scale separated flows at a moderate Reynolds number of 6000 in this study, modeling of large-eddy simulation (LES) was adopted, which is capable of resolving laminar-turbulent transition as well as turbulent flow without applying turbulent models rather than RANS (Reynolds-averaged Navier–Stokes equations) modeling. All simulations were herein conducted with commercial software ANSYS CFX (ANSYS, Inc.). Those eddies with smaller scales than the grid size were filtered and involved in a subgrid-scale model in order to reduce computational cost. For incompressible flows, the filtered governing equations involving the equations of continuity and the momentum can be written such as:
where the subgrid-scale stress tensor τij accounts for the influence of the filtered small scale eddies, and is defined by
Here an eddy-viscosity assumption is used to close the τij term, modeled as
where δij is the Kronecker symbol, vt is the turbulent eddy viscosity, and  denotes the strain rate tensor of the resolved field defined by
We further used the wall-adapted local eddy-viscosity (WALE) model, proposed by Nicoud et al [28], to compute the eddy viscosity vt. The WALE model reads as
where  is the traceless symmetric part of the square of the velocity gradient tensor
where  and
and  denote the velocity gradient tensors. The default value of the constant Cω is taken to be 0.5. More details on the WALE model can be found in Nicoud et al [28].
3. Results
3.1. Flow structures around clean and serrated wing models
The main flow features around the clean and serrated wing models were visualized by mean velocities in terms of flow separation and reattachment, and compared between the two wing configurations. With ANSYS CFX, it was actually realized by running arithmetic averages of instantaneous velocities, which were statistically generated from the transient velocity fields during LES simulation. Contours of the time-averaged streamwise velocities normalized by the free-stream velocity are illustrated in figure 3 for both serrated and clean wing models at AoAs of 5°, 10°, and 15°, respectively. For comparison and validation of the CFD-based simulations, contours of the PIV-based mean velocity fields measured in wind tunnel experiments are further plotted in figure 4 in the same manner, which are in reasonable agreement with the simulated results (to be discussed in section 4.1), and hence validates the reliability of LES-based simulations.

Figure 3. Contours of time-averaged velocities normalized by uniform incoming velocity Uref around a clean leading-edge wing model (left: (A), (C) and (E)), and a serrated leading-edge wing model (right: (B), (D) and (F)) at AoAs of 5° (A) and (B), 10° (C) and (D), and 15° (E) and (F), respectively.
Download figure:
Standard image High-resolution image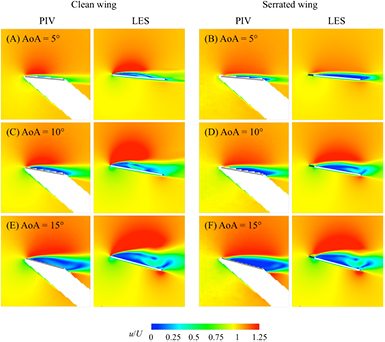
Figure 4. Comparison of contours of time-averaged velocities normalized by uniform incoming velocity Uref between PIV measurements (left) and LES results (right): a clean leading-edge wing model (A), (C) and (E) and a serrated leading-edge wing model (B), (D) and (F) at AoAs of 5° (A) and (B), 10° (C) and (D), and15° (E) and (F), respectively. In PIV-based contours, the wing locations are illustrated with grey lines and the white parts are shadows created by the wing.
Download figure:
Standard image High-resolution imageTo evaluate the turbulent fluctuations in fluid momentum we further plotted the contours of streamwise Reynolds shear stress Ruu (see equations (9) and (10)) in figure 5 to visualize the features of laminar-turbulent transition on upper surface. Here the time-averaged Reynolds stress component  , where
  and
and  denote the fluctuation of the corresponding velocity components, is defined as

where the arithmetic averages of the velocity correlation  are statistically generated during the LES computation. The statistical Reynolds shear stresses can be non-dimensionalized as
whereas the streamwise component is as
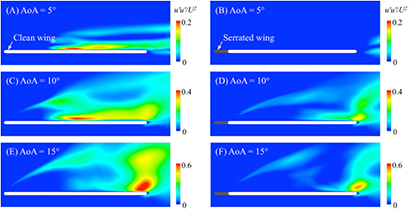
Figure 5. Contours of normalized streamwise Reynolds shear stresses (Ruu): a clean leading-edge wing model (A), (C) and (E) and a serrated leading-edge wing model (B), (D) and (F) at AoAs of 5° (A) and (B), 10° (C) and (D), and 15° (E) and (F), respectively.
Download figure:
Standard image High-resolution imageBecause the laminar-turbulent transition is characterized by vortical structures at leading- and trailing-edge as well as vortex shedding and break-up, we further visualized the instantaneous iso-surfaces of swirling strength that identifies and frames the vortical structure as the region of strengthened vorticity as shown in figure 6, with snapshots of the instantaneous iso-surfaces of swirling strength of 500 s−1 at AoAs of 5° and 15°. The normalized helicity density [29] is employed simultaneously to visualize the helical feature of the vortical structures (see ESM movie S1 (stacks.iop.org/BB/12/046008/mmedia)), which is defined by
where U and  denote velocity and vortical vectors, respectively. Note that the normalized helicity density h is defined as the projection of a fluid's spin vector in the direction of its momentum vector, being positive (red) if it points in the same direction but negative (blue) in the opposite direction.
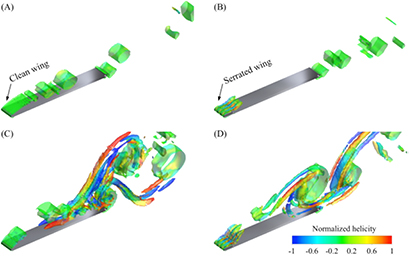
Figure 6. Instantaneous iso-surfaces of swirling strength = 500 s−1, highlighted by normalized helicity density: a clean leading-edge wing model (A) and (C) and a serrated leading-edge wing model (B) and (D) at AoAs of 5° (A) and (B), and 15° (C) and (D), respectively.
Download figure:
Standard image High-resolution image3.2. Velocity spectra, self-noise spectra and aerodynamic forces
In order to investigate the nature of flow-fluctuation phenomenon during laminar-turbulent transition we further made an analysis and comparison of velocity spectra between the two wing models at three feature points over the upper surface to identify the dominant frequencies of the local velocity fluctuations. The spectrum was obtained via a fast Fourier transform (FFT) algorithm for the time varying streamwise velocities of the last 4096 time steps. Figure 7 illustrates the spectra of streamwise velocities at the leading-edge (x/c = 0), the mid-chord (x/c = 0.5) and the trailing-edge (x/c = 1) and at AoA = 5°, 20°.
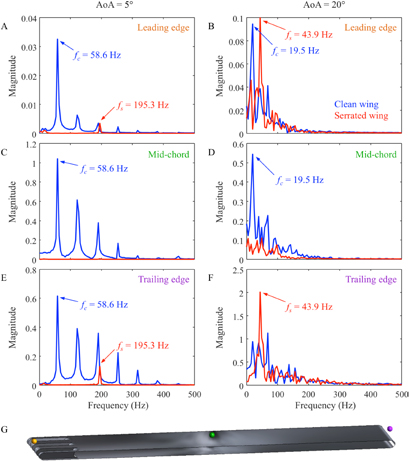
Figure 7. Streamwise velocity spectra at leading-edge (A) and (B), mid-chord (C) and (D), and trailing-edge (E) and (F) of a clean leading-edge wing model (blue) and a serrated leading-edge wing model (red) at AoAs of 5° (A), (C) and (E), and 20° (B), (D) and (F), respectively. (G) Colour balls display the positions of three points.
Download figure:
Standard image High-resolution imageWith the LES-based transient information of the flow fields we can further conduct an aero-acoustic analysis of the so-called self-noise or near-field noise, which are generally caused by the interaction between a rigid surface and its near-field boundary layer. In general, since the compressible Navier–Stokes equation describes both the flow and the aero-acoustic fields and thus both may be solved for directly. However, this requires very high numerical resolution due to the large differences in the length scale present between the acoustic variables and the flow variables. On the other hand, it has been widely recognized [30] that the approach splitting the computational domain into two different regions to solve the governing acoustic or flow field with different equations and numerical techniques. This usually involves using two different numerical solvers, first a CFD solver to solve the flow field (i.e. the LES-based transient flow fields) and secondly an acoustic solver (i.e. the formula of Lighthill–Curle) to the acoustical propagation. Note that it is reasonable to assume an incompressible fluid in the LES simulations and then use the computed flow fields for the aero-acoustic analysis for a compact computational domain around the wing model [30].
The calculation of the self-noise spectrum was then done with a post-processing function of CFD-Post (ANSYS, Inc.) through a FFT of time-varying surface pressures. The signal power of the self-noise spectrum can be calculated in decibel (dB) to give the sound amplitude,
where  denotes the distribution of pressure in the frequency domain, and pref the reference acoustic pressure, which is equal to 20 µPa. With the computational time step of 5 × 10⁻⁵ s, the upper limit of the spectrum can be calculated up to 20 kHz. As seen in figure 5, compared to the leading-edge distinguished turbulent fluctuations are observed at the trailing-edge. This may lead to a significant increase in the radiated sound power and thus implies that the trailing-edge noise is apparently a key noise source. To quantify the aerodynamic noise production, we computed the sound amplitude spectra of the trailing-edge self-noise and compared between the clean and serrated wing models at AoA = 20° (figure 8), which are identical to an effective angle of attack observed in forward flight of barn owls [27]. Note that the aerodynamic noise is not completely evaluated here because additional noise production may also occur due to flow transition and reattachment, and/or vortex shedding in the separated shear layer and/or in the wake. However, it is obvious that the serrated wing model seems to be capable of remarkably suppressing the level of turbulent fluctuations and hence the noise production at the trailing-edge.
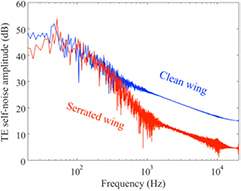
Figure 8. Self-noise amplitude spectra at trailing-edge of a clean leading-edge wing model (blue) and a serrated leading-edge wing model (red) at AoA = 20°.
Download figure:
Standard image High-resolution imageAs shown in figure 9 effects of the leading-edge serrations on aerodynamic performance was further evaluated through a comparison of the time-averaged lift and drag coefficients as well as lift-to-drag ratios via angles of attack between the measurements and simulations. The lift and drag coefficients are defined as follows,
where ρ denotes the air density of 1.185 kg m−3 at 25 °C and 1 atm, and S the wing area of the upper surface that takes into account the area of serrations in the serrated model. It should be noted that the measured aerodynamic force coefficients are for the 3D artificial wing models (see section 2.2) whereas the computed ones are for the 2D infinite wing models without consideration of the 3D effects. In this respect, although we see that the lift-to-drag ratios and the trend of lift and drag coefficients are in very good agreement with each other, there does exist pronounced differences in the magnitudes of lift and drag coefficients. The CFD models overpredict both lift and drag coefficients in comparison to the EXP models. It would be reasonable to consider that the 3D effect owing to the interplay among the leading-edge vortex, the wing tip vortex and the trailing-edge vortex for the low aspect ratio wing (AR = 5) may largely reduce the aerodynamic force production, in particular at larger angles of attack (figure 9).
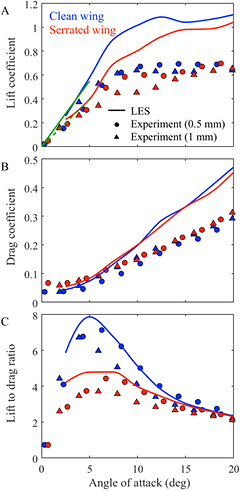
Figure 9. Comparison of lift (A) and drag (B) coefficients, and lift-to-drag ratios (C) versus angles of attack between LES (lines) and wind tunnel experiments (0.5 mm: circles, 1 mm: triangles): a clean leading-edge wing model (blue) and a serrated leading-edge wing model (red). Green lines denote lift-curve slopes of a 2D infinite plate (green solid line) and a 3D plate with aspect ratio AR = 5 (green dashed line), respectively, estimated by lifting-line theory.
Download figure:
Standard image High-resolution image
To further validate our CFD-based results of the 2D wing models, we herein predict the slope of the lift-curve by introducing the thin airfoil theory for 2D flow, which (green solid line) is equal to 2π, agreeing well with our LES-based results (blue solid line) at lower AoAs (figure 9). Moreover, the lifting-line theory by Prandtl [31] can be used to quantitatively estimate the lift-curve slope (a) of a 3D plate with medium to large ARs in the following way [32],
where a0 = 2π is taken to be the lift-curve slope of a 2D infinite plate, and AR = 5 the aspect ratio of the artificial wing models. Apparently the estimated slope (green dashed line) matches better the measured lift and drag coefficients (blue circles) at low angles of attack. Note that the lifting-line model does not hold for the cases of larger AoAs and stalls.
4. Discussion
In the following we discuss extensively about the serration-based passive flow control mechanisms and the tradeoff between aerodynamic force production and sound suppression.
4.1. Serration-based passive flow control mechanisms
Here we investigate how the leading-edge serrations passively control the flows during laminar-turbulent transition with a focus on the features of flow separation and reattachment as well as their correlations with the aerodynamic force production of lift and drag.
As shown in figure 3 the normalized mean velocity fields demonstrate obvious discrepancy between clean and serrated wing models. An immediate flow separation at the leading-edge is observed in the clean wing model at all AoAs (figures 3(A), (C), (E) and 4(A), (C), (E)), which is likely owing to the sharp leading-edge and the adverse pressure gradient. The serrated model, however, seems to be capable of filtering the flow via serrations and generates a partial-slip boundary layer in the vicinity of the leading-edge (figures 3(B), (D), (F) and 4(B), (D), (F)), which obviously delays and mitigates the flow separation downstream. This consequently leads to significantly different flow characteristics on the suction surface.
At a lower AoA of 5°, it is seen that in the clean model (figures 3(A) and 4(A)) the separated flow reattaches onto the upper surface in the vicinity of approximately x/c = 0.65, forming a separation bubble, i.e. the leading-edge vortex, which supports the results by Winzen et al [7]. This phenomenon is normally observed in the low Reynolds-number flow regime associated with laminar-turbulent transition on the suction surface [13–15]. The distributions of Reynolds shear stress in figure 5(A) further demonstrate a laminar flow region at the leading-edge, followed by a rapid transition immediately upstream of the reattachment point as well as an attached turbulent boundary layer. In contrast, the serrated wing model corresponds with a long suction-flow region without reattachment (figures 3(B) and 4(B)) throughout the upper surface, and shows almost no variations in the Reynolds shear stresses associated with the turbulent fluctuations (figure 5(B)). This indicates that the suction-flow remains in a completely laminar state owing to the serrations. On the other hand, due to the lack of the leading-edge vortex, i.e. the leading-edge separation bubble, the serrated wing model obviously shows poor aerodynamic performance in lift and drag coefficients (figures 9(A) and (B)) as well as in lift-to-drag ratio (figure 9(C)). This implies that at such a lower angle of attack the serrated wing seems to pay a cost on stabilizing the flow through delaying the laminar-turbulent transition with a reduction in aerodynamic performance.
Along with increasing of AoA to 10°, it is observed that the leading-edge vortex grows up quickly and it turns out to be difficult to localize the mean reattachment point from the velocity fields (figures 3(C), (D) and 4(C), (D)). A shear layer is then detected in both clean and serrated wing models at the leading-edge where the flows separate completely from the upper surface as seen in the Reynolds shear stresses (figures 5(C) and (D)). The clean wing model (figure 5(C)) shows a complicated phase of laminar-turbulent transition with a shear layer initiated at the leading-edge but growing rapidly over the mid-chord, and substantially developing into fully turbulent at the trailing-edge. The serrated wing model (figure 5(D)), however, shows a larger shear layer region with more moderate turbulent fluctuations within it, and the suction-flow remains laminar over most parts of the upper surface, eventually transiting to fully turbulent at the trailing-edge.
Further increasing AoA to 15° or beyond leads to enlarging the flow separation, which eventually results in an apparently similar nature of the mean flow fields for the two wing models (figures 3(E), (F) and 4(E), (F)). The Reynolds shear stress distribution, however, still remains apparently different: the clean wing model (figure 5(E)) shows significantly higher instability within the shear layer compared to the serrated wing model (figure 5(F)), corresponding to a much larger region of laminar-turbulent transition. Clearly, the turbulent fluctuations in the vicinity of the trailing-edge become much more pronounced with increasing AoAs because of the interplay between the shedding vortices induced by the separated shear layers and the trailing-edge vortices.
To investigate the shear layer-induced flow instability we further look at the swirling features associated with laminar-turbulent transition. For the clean wing model, it is seen that a free shear layer is formed at the separation point, where the Kelvin–Helmholtz (KH) instability occurs causing oscillations of the separated shear layer, which as shown in figures 6(A) and (C) substantially leads to vortex shedding. As seen in ESM movie S1, these shedding vortices dynamically interact with each other and substantially merge together at the mid-chord, which enhances the flow instability, resulting in an intense transition to turbulence. At the lower AoA of 5°, over the mid-chord the turbulent flow entrains momentum to reattach and forms a fully developed turbulent boundary layer downstream (figures 3(A) and 4(A)) while the shedding vortices flow over the upper surface and shed off from the trailing-edge (figure 6(A)). At the higher AoA of 15°, the shedding vortices obviously roll away quickly from the upper surface, growing up to a large-scale vortex sheet in the wake (figure 6(C)). In contrast, the serrated wing model shows an obvious different phase: the leading-edge vortex is broken up into numbers of small eddies (figures 6(B) and (D)), which likely scatters and mitigates the KH instability within the separated shear layer and hence suppresses the vortex shedding efficiently and consequently leads to enhanced stability of the suction flow.
4.2. Tradeoff between force production and sound suppression
Here we give an extensive discussion on whether serrations may be capable of providing a novel solution to the tradeoff between flow fluctuation-induced sound suppression and force production in owl silent flight. We investigate the dominant frequencies of the flow fluctuations through FFT-based velocity spectrum analysis to clarify how the leading-edge serrations contribute to suppressing the local velocity fluctuations. We further use an FFT-based pressure spectrum analysis to quantify how the discrepancy in the flow fluctuations leads to distinguishable sound generation between the serrated and clean wing models.
At a lower AoA of 5°, we see a pronounced difference of velocity spectra between the serrated and clean wing models. The clean model presents a highest peak at f = 58.6 Hz at leading-edge (figure 7(A)), pointing to the dominant fluctuation frequency of the separated shear layer; and several prominent peaks are also notable at mid-chord and trailing-edge (figures 7(C) and (E)), corresponding to high harmonic-frequency eddies in figure 6(A), associated with the laminar-turbulent transition (figure 5(A)). The serrated wing model, however, obviously shows much lower magnitudes of the dominant fluctuation frequencies throughout the upper surface, merely with a spectral prominence at f = 195.3 Hz (figure 7(E)) corresponding to the shedding of trailing-edge vortices. This indicates that the leading-edge serrations are capable of suppressing velocity fluctuations to a lower level from leading-edge (figure 7(A)) to trailing-edge (figure 7(E)), and hence stabilizing the flows due to laminar-turbulent transition at mid-chord (figure 7(C)).
At a larger AoA of 20°, the clean wing model presents a notable increase in the magnitude of flow fluctuations corresponding to the intense laminar-turbulent transition at mid-chord whereas the serrated wing model is obviously capable of suppressing the velocity fluctuations to a lower level (figures 7(B) and (D)). At trailing-edge the clean wing model presents a feature of multiple peaks while one single spectral spike is observed in the serrated wing model at the dominant frequency, f = 43.9 Hz (figure 7(F)), which is identical to that observed at the leading-edge (figure 7(B)). This indicates that the vortices shedding off separately from both leading-edge and trailing-edge likely share the same frequency, which implies that the interactions due to the laminar-turbulent transition at mid-chord have been suppressed remarkably (figure 7(D)).
Furthermore, through the FFT-based pressure spectrum analysis we investigated the sound amplitude spectrum of the trailing-edge self-noise at AoA = 20° (figure 8). Obviously, the serrated wing model distinguishably reduces the sound amplitudes by approximately 10 dB in the case when the dominant sound frequency is greater than 2 kHz. This demonstrates that the leading-edge serrations are capable of suppressing high-frequency sound amplitudes at trailing-edge, which are initially induced by the high frequency eddies owing to intense laminar-turbulent transition.
With respect to the force production as illustrated in figure 9 the leading-edge serrations demonstrate a distinguished aerodynamic performance between lower and higher angles of attack: reducing the lift coefficient and lift-to-drag ratio at AoAs less than 15° but being capable of achieving an even aerodynamic performance at AoAs greater than 15° compared to the clean wing model. Therefore, with consideration of the tradeoff between aerodynamic force production and sound suppression, it would be fair to say that the serrated wing model pays a cost of lowering aerodynamic performance to achieve sound suppression at lower AoAs < 15° but is capable of resolving the tradeoff to achieve both sound suppression and aerodynamic performance at higher AoAs > 15° where owl wings often reach at in flight [27].
It should be mentioned that the measurements and simulations are all conducted in steady state in order to investigate the essential mechanisms of the leading-edge serrations in gliding flight specifically. The transient conditions based on measured kinematics of owl's flapping flight will be considered in our further studies to analyze the aerodynamic robustness of the serrated feathers. Also note that, for simplicity, in this study we neglected the inclination angles and the realistic 3D shapes of the serrations, as well as the 3D effects induced by wing tip vortices. In addition, other morphological characteristics such as trailing-edge fringes [10–12] and velvety surfaces [13–15] that are not taken into account in this study may also play some role in flow control and aero-acoustic suppression of serrated wings. Particularly the modifications of the trailing-edge to suppress the aerodynamic noise have been widely studied [33–35]. Furthermore, the flexibility of the natural feathers leads to fluid-structure interactions during flight. The resulting deformation or aeroelastic flutter of the serrated feather may alter the flow field and the sound production significantly. Therefore, a realistic modeling of owl wings is our next task to unveil how owls utilize an integration of those morphological characteristics complimentarily to achieve silent gliding and flapping flights.
5. Conclusions
In this study, we conducted an integrated study by combining LES-based simulations and low-speed wind tunnel experiments on highly unsteady flows associated with laminar-turbulent transition around owl-inspired single-feather wing models with and without leading-edge serrations. We find that the serrated wing model can passively control the laminar-turbulent transition to suppress the high frequency eddies, and hence leads to sound suppression. This mechanism is likely achieved by the leading-edge serrations, which, as a flow filter, break up the leading-edge vortex into numbers of small eddies and hence suppress the KH instability within the separated shear layer. With velocity spectrum analysis we confirm that the leading-edge serrations are capable of stabilizing the flow fluctuations due to laminar-turbulent transition. Further combining with pressure spectrum analysis we discover that a distinguishable reduction in sound amplitudes of the trailing-edge self-noise can be achieved at a dominant sound frequency greater than 2 kHz. Moreover, the leading-edge serrations seem to be capable of providing a strategy in resolving the tradeoff between sound suppression and force production. We find that, compared to the clean single-feather wing model, the serrated wing model shows a reduction in aerodynamic force production at lower AoAs < 15° but obviously a capability to achieve an even aerodynamic performance at higher AoAs > 15° while significantly suppressing the aerodynamic noise production. Our results further indicate that the owl-inspired leading-edge serrations may provide a useful biomimetic design for flow control and noise suppression in wind turbines, aircrafts, multi-rotor drones as well as other fluid machinery.
Acknowledgments
The authors acknowledge Dr Hiroto Tanaka and Dr Dmitry Kolomenskiy for valuable discussions. Special thanks go to Mr Tetsuya Ueda and Dr Takeo Fujii for assistance in data collection during the experiments.
Funding
HL and TN were partly supported by the Grant-in-Aid for Scientific Research on Innovative Areas of No. 24120007, JSPS, and Tough Robotics Challenge-Impulsing Paradigm Change through Disruptive Technologies Program (Cabinet Office, Government of Japan), JST. CR acknowledges the financial support from Japanese Government MEXT scholarship.
Electronic supplementary material
ESM movie S1: LES-based vortical structures around both clean and serrated models at Re = 6000.