

Abstract
Cracked media are a common geophysical phenomena. It is important to study the propagation characteristics in boreholes for sonic logging theory, as this can provide the basis for the sonic log interpretation. This paper derives velocity–stress staggered finite difference equations of elastic wave propagation in cylindrical coordinates for cracked media. The sound field in the borehole is numerically simulated using the finite-difference technique with second order in time and tenth order in space. It gives the relationship curves between the P-wave, S-wave velocity, anisotropy factor and crack density, and aspect ratio. Furthermore, it gives snapshots of the borehole acoustic wave field in cracked media with different crack densities and aspect ratios. The calculated results show that in dry conditions the P-wave velocity in both the axial and radial directions decreases, and more rapidly in the axial direction while the crack density increases. The S-wave velocity decreases slowly with increasing crack density. The attenuation of the wave energy increases with the increase in crack density. In fluid-saturated cracked media, both the P-wave and S-wave velocity increases with the aspect ratio of the cracks. The anisotropy of the P-wave decreases with the aspect ratio of the cracks. The aspect ratio of the crack does not obviously affect the energy attenuation.
Export citation and abstract BibTeX RIS

Original content from this work may be used under the terms of the Creative Commons Attribution 3.0 licence. Any further distribution of this work must maintain attribution to the author(s) and the title of the work, journal citation and DOI.
1. Introduction
Logging and drilling data show that there are many aligned cracks in crustal rock (Crampin 1985). The cracks in formations are caused by directional tectonic stress. The characteristics of acoustic wave propagation are transversely isotropic in the cracked rock (Crampin 1978). With the development of oil and gas exploration, cracked media have become an important topic in reservoir research. Continental clastic and carbonate reservoirs have widely developed cracks. Cracks not only provide space for fluid but also obviously increase the permeability of the reservoir fluid. It is an important geophysical factor in oil exploration and exploitation.
Detection and identification of cracked reservoirs has become a difficult problem to solve. In recent years, researchers have paid a great deal of attention to cracked media.
There are two main effective-medium theories for cracked media. One was proposed by Schoenberg et al (1995) based on the normal and tangential compliance from linear slide compliance theory. The other one was proposed by Hudson (1990, 2000, 2010) based on wave scattering theory for high frequency. The former is not limited to pore shape and microstructure. It has better applicability to different cracks, but does not consider the factors of rock porosity and permeability. The latter can be applied to calculate the acoustic field of a cracked medium that contains uniform cracks, and the aspect ratio is small.
For cracked effective-medium theories, many researchers have carried out a lot of work. Andrey et al (2000a, 2000b, 2000c) gave a method for calculating crack parameters from seismic data. Cheng (1993) proposed an effective-medium theory for transversely isotropic (TI) cracked media. Kazatchenko et al (2004) simulated the full waveforms generated by an impulse source placed on the borehole axis with the method integral at the real axis. Grechka (2005) validated Hudson's approach by numerical simulation with the finite element method (FEM).
Zhang et al (2014) simulated seismic wave propagation in two-phase anisotropic media by velocity–stress wave equations. Rao and Wang (2015) analyzed seismic attenuation in fractured media based on numerical experiments for frequency-domain wave equations with three different parameters.
To study the influence of cracks, this paper simulated the borehole acoustic field propagation in vertical transverse isotropic (VTI) cracked formations. The paper discusses the influence of crack parameters on borehole acoustic field propagation.
2. Hudson's approach
Hudson's approach was derived from theory of the average wave-field scattering for high frequency. It is used to calculate the elastic modulus of an elastic medium containing thin coin-shaped cracks. This approach is applied to simulate acoustic field propagation in a cracked formation with the following conditions: crack density in the formation is less than 0.1, coin-shaped, the crack radius is small, and the crack interval is much smaller relative to the wavelength.
Hudson gave a method to calculate the elastic modulus. In isotropic media, if there are aligned coin-shaped cracks that are independently distributed, Hudson considered the medium as a transversely isotropic (TI) medium. If the isotropic medium is regarded as a background medium, the elastic modulus of the TI medium can be calculated from the elastic modulus of the background medium and crack parameters, and can be presented in the following form

where  is the matrix formed by the elastic parameters of the background medium,
  is the first-order corrected matrix and regards each crack as having independent behavior,
  is the second-order corrected matrix and regards crack coupling as pairwise mutual,
  is the higher-order perturbation produced by
 is the crack density, and
  is the average radius of the cracks. In general, the higher-order perturbations can be ignored.
For the normal direction of cracks aligned along the Z-axis, cracked media exhibit vertical transversely isotropic symmetry. The background medium can be presented in the following form
where  is the Lame coefficient of the background medium and
  is the shear modulus. As

 denote elements of

 the matrix
  can be represented as

and the first-order corrected matrix  can be presented as
where  is the crack density and
 are determined by the elastic parameters of the background medium. For dry cracked media, the forms of
 are given by the functions

For saturated fluids, 
 are given by the functions

where  and
and  are parameters related to the nature of the crack inclusions and background, and they can be given as the following functions
where  is the bulk modulus of the crack inclusions,
  is the shear modulus of the crack inclusions,
  as the crack inclusion is fluid and
  is the average aspect ratio of the cracks.
  can be presented as the following expression
where  was given by the function

The crack density can be calculated by the following expression

where  is the crack porosity. The elastic parameters of the cracked medium
  can be obtained as

Using the relationship between the acoustic velocity and the elastic parameters, we can give the P-wave velocity in the axial direction as  the P-wave velocity in radial direction as
  the S-wave velocity as
  and the anisotropy coefficient of the P-wave as
  .
.
3. Acoustic wave equation
In cylindrical coordinates, the three-dimensional wave equation can be transformed into two-dimensions for VTI media with cracks about the axial symmetry distribution. Ignoring external forces, the stress-displacement elastic wave equation can be presented as the following expression
where  and
and  respectively indicate displacement in the
  and
and  directions,
  and
and  are normal stress in the
  and
and  directions,
  is the bulk density and


 are elastic constants of cracked media. If
 then we can transform equation (12) into the following expression
so, the function (13) is the speed-stress equation in cylindrical coordinates.
4. Scheme of staggered grid finite difference
In cylindrical coordinates, we set grids for the computing space.  and
and  are computing steps in the radial and axial directions respectively.
  and
and  are the numbers of meshes in the radial and axial directions respectively. So,
  is the calculation area. We transform the wave equation (13) into a high-order staggered grid difference format as the following functions
where  and
and  denote
  and
and  respectively,
 and
and  denote
 and
and  respectively,
 are high order difference operators with backward and forward direction respectively, which are about the first order derivation in the radial direction. Similarly,
  and
and  denote the operators in the axial direction. They can be presented as the following expression

where  is the differential coefficient,
  2,...,
  is the number of discrete points in the radial direction, j = 1, 2,...,
  is the number of discrete points in the axial direction.
5. Numerical computation
We simulated the acoustic field in a borehole in cylindrical coordinates based on the functions in (14). The borehole radius r = 0.12 m, step  and the point source was placed on the Z axis at the center of the borehole, as shown in figure 1.

Figure 1. Coordinate system for borehole acoustic field calculation.
Download figure:
Standard image High-resolution image5.1. Acoustic source function
The first order derivative of Gaussian function was modeled as the sound source, and can be presented as the following expression

where  is a parameter related to the bandwidth of the pulse,
  is a time translation parameter,
  is the center frequency of the sound source,
  is maximum frequency, and their values are presented in table 1.
5.2. Dispersion with the size of the grid and time step
If the mesh size is too large, the sound waves will cause dispersion. Conversely, if the mesh size is too small, the computational efficiency will be decreased. Alford et al (1974) gave an empirical formula to decide the grid size
where  is the maximum size of the grid,
  is the minimum P-wave velocity and
  is the maximum frequency. The time step can be determined according to the following formula

where  is the maximum speed of the wave. In this paper, we calculated using the grid spacing interval
  and the time interval
  in line with formulas (18) and (19).
Table 1. Parameters of the sound source function.
 (kHz) (kHz) |
 (kHz) (kHz) |

|
 (ms) (ms) |
|---|---|---|---|
| 10.6 | 20.3 | 0.22 | 0.056 |
5.3. Boundary conditions
We used an exponential function (Alford et al 1974) in an expanding attenuation band for the upper and lower boundaries, as well as the outer boundary in the radial direction. We considered adding an attenuation band out of the boundary, the physical quantity of which attenuates exponentially in this field. In addition, the axis of the borehole and several grids near the axis can be assumed as r < 0. Then, it can be calculated according to the symmetry of the sound field as the following conditions

6. Numerical simulation and wave field analysis
The elastic properties influenced by cracks are connected mainly to the shape and density of the cracks. This paper pays attention to these two factors to study the acoustic wave propagation characteristics in a borehole surrounded by vertical transversely isotropic cracked media.
6.1. Influence of crack density
According to Hudson's approach, the elastic modulus of dry rock is connected to crack density, so we simulated the borehole acoustic field with different cracked densities in order to study the influence of crack density on dry rock. It is numerically simulated using a finite-difference technique with second order in time and tenth order in space. The petrophysical parameters of the background medium are shown in table 2.
Table 2. Petrophysical parameters of background media.
| Parameters |
 (GPa) (GPa) |
 (GPa) (GPa) |
 (GPa) (GPa) |
 (GPa) (GPa) |
 (kg m−3) (kg m−3) |

|
|---|---|---|---|---|---|---|
| Value | 32.218 | 1.5175 | 32.218 | 8.5212 | 2630 | 0.01 |
As shown in figure 2, the curves illustrate the relationship between the velocity of the P-wave and S-wave, as well as the anisotropy factor and crack density. In figure 2, the abscissa is the crack density and the ordinate is the velocity of the wave. In the figure,  is the velocity of the P-wave in the radial direction, and
  is the velocity of the P-wave in the axial direction. As can be seen from figure 2, the velocity of the P-wave in both axial and radial directions decrease as the crack density varies from 0 to 0.1, but more rapidly in the axial direction while the crack density increases. The velocity of the S-wave decreases slowly with the increase in crack density.

Figure 2. Relationship between the wave velocity and crack density.
Download figure:
Standard image High-resolution imageAs shown in figure 3, the curve illustrates the relationship between the anisotropy factor of the P-wave and crack density. The abscissa is the crack density and the ordinate is the anisotropy coefficient of the P-wave. As can be seen from figure 3, the anisotropy of the medium increases linearly while the crack density increases.
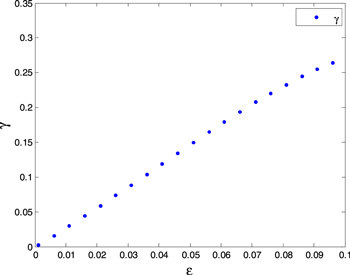
Figure 3. Relationship between the crack density and anisotropy factor of the P-wave.
Download figure:
Standard image High-resolution imageAs shown in figure 4, panels (a), (b) and (c) are snapshots of the borehole acoustic wave field when the cracked density  0.03, 0.05 respectively at time t = 280 μs (take the grid units as coordinate units). From the three panels we can see there are spherical waves reflected by the wall of the borehole. Furthermore, there are two arcs linking the slashes which are symmetrically distributed in the wellbore outside. The outer arc is the P-wave of formation and the inside arc is the S-wave. Comparing these three figures, the velocities of the P-wave and the S-wave decrease with decreasing crack density, but more rapidly in the axial direction. The S-wave velocity decreases slowly with increasing crack density. So, the velocity of the P-wave is more sensitive than the S-wave.
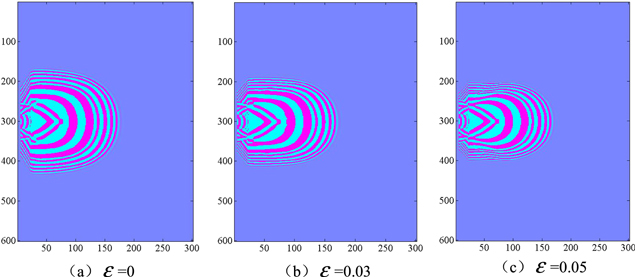
Figure 4. Snapshots of the sound field for different crack densities.
Download figure:
Standard image High-resolution imageAs shown in figure 5, panels (a), (b) and (c) are waveforms received at the axis from a distance between the sound source 1 m, when the cracked density  0.03, 0.05 respectively. From the three panels we can see there are P-waves, S-waves, pseudo-Rayleigh waves and Stoneley-waveforms in the time axis. Comparing these three figures, the velocities of the P-wave and S-wave decrease with increasing crack density, while the wave amplitude of the P-wave, S-wave, pseudo-Rayleigh waves and Stoneley-wave decrease with increasing crack density.
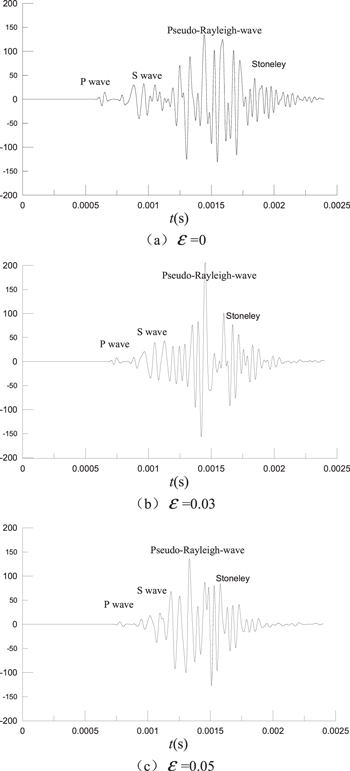
Figure 5. Calculated full waveforms in the borehole for different crack densities.
Download figure:
Standard image High-resolution image6.2. Influence of the aspect ratio of cracks
According to Hudson's approach, the elastic modulus of fluid-saturated rock is connected with the aspect ratio of the cracks. So we simulated the borehole acoustic field with cracks of different aspect ratios in order to study the influence of the aspect ratio of cracks on fluid-saturated rock. It is numerically simulated using the finite-difference technique with second order in time and tenth order in space. The petrophysical parameters of the background medium are shown in table 2.
As shown in figure 6, the curves illustrate the relationship between the anisotropy factor of the P-wave, S-wave and aspect ratio of the cracks. From figure 6, it can be seen that the velocity of the P-wave in the radial direction is greater than in the axial direction, the velocity in both the radial and axial directions linearly increases with increasing aspect ratio in the range of 0–0.1. Furthermore, from the curve of the relationship with the S-wave and the aspect ratio, it can be seen that the velocity of the S-wave increases with increasing aspect ratio, more quickly in the range of 0–0.02 and after that almost linearly increasing.

Figure 6. Relationship between the wave velocity and the aspect ratio of the cracks.
Download figure:
Standard image High-resolution imageFigure 7 shows the relationship curve between the anisotropy coefficient and the aspect ratio of the cracks. In figure 7, the abscissa is the aspect ratio and the ordinate is the anisotropy coefficient of the P-wave. It can be seen that the anisotropy coefficient decreases with increasing aspect ratio.

Figure 7. Relationship between the anisotropy factor and the aspect ratio of the cracks.
Download figure:
Standard image High-resolution imageAs shown in figure 8, panels (a), (b) and (c) are snapshots of the borehole acoustic wave field where the cracked density  0.03, 0.05 respectively at time t = 280 μs (take the grid units as coordinate units). Comparing these three panels, the distance of the P-wave and S-wave wave field spread increases with increasing aspect ratio. From the shape of the P-wave field in the snapshots, with an increase in the aspect ratio it varys from oblate to round. Obviously, the anisotropy factor of the P-wave decreases with the aspect ratio.
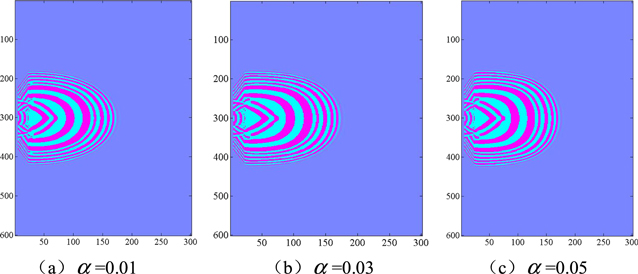
Figure 8. Snapshots of the sound field for cracks of different aspect ratio.
Download figure:
Standard image High-resolution imageAs shown in figure 9, panels (a), (b) and (c) are the are waveforms received at the axis from a distance between the sound source 1 m and aspect ratio α = 0, 0.03, 0.05 respectively. Comparing these three panels, the velocity of the P-wave and S-wave increases with increasing aspect ratio, while the wave amplitude of the P-wave, S-wave, pseudo-Rayleigh waves and Stoneley-wave does not obviously change obviously with increasing aspect ratio.

Figure 9. Calculated full waveforms in the borehole for cracks of different aspect ratio.
Download figure:
Standard image High-resolution image
7. Conclusions
This paper simulated a borehole acoustic field using the finite difference method based on Hudson's approach. It studied the propagation characteristics of a borehole acoustic field surrounded by vertical transversely isotropic cracked media and also the effects of crack density and crack aspect ratio on the propagation of acoustic waves.
Numerical simulation shows that, in dry rock, the velocity of the P-wave and S-wave decreases with increasing crack density, while it decreases more rapidly for the S-wave. The attenuation of the wave amplitude increases with increasing crack density. In the saturated fluid medium, the velocity of the P-wave and S-wave increases with the aspect ratio of cracks. The anisotropy factor of the P-wave decreases with the aspect ratio. The influence of the aspect ratio of the cracks on attenuation is not obvious.
It should be noted that the simulation satisfied the presupposition of effective-medium theories in Hudson's approach.
Acknowledgments
We are grateful to the School of Geology Engineering and Geomatics, Chang'an University, where this study was carried out in the framework of the research program 'Study on the characteristics of acoustic wave in a borehole surrounded by unconsolidated sandstone' subsidized by the Natural Science Foundation of China.