


Abstract
Electron cyclotron wall conditioning with neon gas (Ne-ECWC) has been performed on the normal conducting spherial tokamak QUEST with metal walls under a trapped particle configuration with O-mode EC waves including X-mode polarization with a frequency of 8.2 GHz and an injection power of 16 kW. The Ne-ECWC removes hydrogen from the wall with small neon retention. The Ne-ECWC decreases hydrogen recycling at the following tokamak discharges, contributing to an improvement of the following tokamak plasma start-up: the plasma current increases and the start-up timing of the plasma current shifts forward. However, defects such as voids and bubbles are formed on tungsten surface exposed to the Ne-ECWC plasma.

Original content from this work may be used under the terms of the Creative Commons Attribution 4.0 license. Any further distribution of this work must maintain attribution to the author(s) and the title of the work, journal citation and DOI.
1. Introduction
Electron cyclotron wall conditioning (ECWC) is one of the candidates for inter-shot wall conditioning tools for superconducting nuclear fusion experimental devices such as ITER. It is shown that ECWC with Helium gas (He-ECWC) is effective for recovery from plasma disruptions by removing retained fuels in devices with carbon wall [1–4]. On metal wall devices, however, He plasmas produce defects such as He bubbles in the metal plasma-facing components under some conditions [5], leading to increase in He and fuel retention and continuous release of He and fuel particles. In contrast, it is expected from Ne ion or Ne and D ion irradiation to tungsten (W) samples that Ne is unlikely to produce defects due to lower Ne retention compared with He [6]. Hence, ECWC with Ne gas (Ne-ECWC) is expected to have advantages of lower defect productivity and lower Ne gas retention compared with He-ECWC in metal devices. In addition, compared to glow discharge cleaning with Ne gas (Ne-GDC) [7], lower erosion rate in Ne-ECWC is expected due to lower injection energy into plasma facing components (PFCs). However, one of issues is high radiative cooling rate of Ne, which might hamper the tokamak plasma start-up after Ne-ECWC. Experimental assessment of the influence of the Ne radiative cooling on the tokamak plasma start-up in addition to investigation of hydrogen isotope removal capability is of significance before practical use of Ne-ECWC in ITER.
2. Experimental set-up
2.1. QUEST device
Figure 1(a) shows a poloidal cross-section of the QUEST vacuum vessel. Neon-ECWC experiments have been performed on the spherical tokamak QUEST with a major radius of R = 0.64 m and a minor radius of a = 0.4 m [8]. A vacuum vessel is made of stainless-steel type SS316L. A part of the PFC, a center-stack, a top divertor and hot walls are coated by atmospheric plasma splayed tungsten (APS-W) with a thickness of 0.1 mm on a stainless steel. The thickness of the APS-W exceeds the ion range, which is on the order of nanometers. A bottom divertor is made of SS316L. The vacuum vessel is pumped out by five pumps: one turbo molecular pump at a horizontal port, three cryopumps at three different lower oblique ports and one cryopump at an upper oblique port.

Figure 1. (a) Poloidal cross-section of the QUEST vacuum vessel with plasma facing components. (b) Toroidal cross-section on the midplane with an EC injection position, H2 and Ne gas injection positions and diagnostics. The EC injection antenna, the gas injection port and all diagnostics are installed on the midplane. The dashed-line circles indicate the positions of the fundamental and second harmonic resonance layers. The dashed and dotted-line ellipses indicate the position of the cryopumps installed on the oblique ports. The points shown by both open and closed circles represent measurement positions of the Thomson scattering system, and the different marker can be measured in different shots by adjusting the collection optics.
Download figure:
Standard image High-resolution imageThe hot wall temperature was decreased from 300 °C before this experiment, and the wall temperature of the vacuum vessel and all PFCs were set at 30 °C. The pumping speeds were evaluated before the experiment, and they were 4.4 m3 s−1 for H2 and 1.6 m3 s−1 for Ne gas. It is noted that because an increase in the hot wall temperature reduces H2 retention, H2 removal efficiency from the hot wall at elevated temperatures could be reduced.
2.2. Gas and electron cyclotron injection systems and diagnostics
Hydrogen and Ne gas injection ports, an EC injection antenna and all diagnostics used in this study are installed on the horizontal plane as shown in figure 1(b). Neon gas is injected from the low field side (LFS) and H2 gas is injected from the center-stack by calibrated mass flow controllers. Ordinary mode (O-mode) EC waves including extraordinary mode (X-mode) polarization with a frequency of 8.2 GHz with an energy of 16 kW are injected from the LFS with normal to the toroidal field. Partial pressures of H2 and Ne gases, PH2 (M/z = 2) and PNe (M/z = 20), respectively, are evaluated by a quadrupole mass spectrometer (QMS), which is calibrated before the experiment. Line-integrated electron density (nel) is measured by an interferometer with a tangential chord. Radial profiles of electron density (ne) and electron temperature (Te) are measured by a Thomson scattering system with six measurement points. The measured electron density is calibrated by the line-integrated electron density measured by the interferometer. An Hα intensity is monitored by a monochrometer with a tangential chord. Radial profiles of Hα and Ne I intensities are evaluated by a visible spectrometer with 19 ch holizontal chord, which wavelength and signal intensity are calibrated after the experiment. Tungsten samples are exposed to Ne-ECWC plasmas at R = 1.37 m by a sample introduction system FESTA [9] with floating potential without breaking the torus vacuum. Defect production of the exposed sample is investigated by a transmission electron microscope (TEM). It is noted that although the Ne-ECWC plasma and the H2 charge plasma could have toroidal symmetry due to the local injection of the working gas and the EC wave, this should not have a significant impact on the results of H2 removal and Ne retention by the Ne-ECWC.
2.3. Experimental sequence
Figure 2 shows experimental procedures in this study. The experimental procedures were composed of two parts for different purposes. One experimental procedure was arranged to investigate three subjects: (1) H2 removal efficiency from the wall, (2) Ne retention in the wall and (3) defect production in the W sample, shown above the dashed line in figure 2. The other was to investigate influences of Ne-ECWC on tokamak plasma start-up.

Figure 2. Experimental procedures in this study. The procedures are separated into two parts at the dashed line.
Download figure:
Standard image High-resolution imageOn the first experiment, first, H2 was preloaded over the wall by H2 plasmas with EC wave injection without a poloidal magnetic field by sweeping the resonance layer by a varied toroidal magnetic field. This was continued until wall saturation by H2 molecules, which was confirmed by saturation of Hα intensity measured by the monochromator. Then, 11 pulses of 10-s Ne-ECWC were performed to remove the preloaded H2 molecules. In these pulses the number of removed H2 molecules and that of retained Ne atoms were evaluated by particle balance analysis. Detection positions of ne and Te by the Thomson scattering were changed after the six Ne-ECWC pulses were completed. To investigate defect production by Ne-ECWC plasma exposure only, W samples were exposed to ten Ne-ECWC pulses. For the second experiment, H2 molecules were preloaded in the same manner as the first experiment. Then, tokamak discharges were performed before and after one Ne-ECWC pulse.
2.4. Ne-ECWC sequence and particle balance analysis
Figure 3 shows time traces of a Ne-ECWC discharge. As shown in figure 3(a), a toroidal field coil was energized to 50 kA (or toroidal field BT = 0.25 T) and a trapped particle configuration as shown in figure 4 was produced by energization of poloidal field coils (PF2 and 4) to 0.18 kA. At prefilled Ne gas pressure at 1.3 mPa (figure 3(b)), one pulse of an EC wave with a power at 16 kW was injected for 10 s and Ne-ECWC plasmas were produced as shown by nel (figure 3(c)). It is noted that a sharpe increase in PH2 after turning off of the EC injection should be attributed to the recycling of H2 gas at the wall and its confinement in the torus as H2 plasmas.

Figure 3. Time traces of a Ne-ECWC discharge: (a) toroidal and poloidal coil currents (ITFC and IPFC), (b) Ne gas injection rate (QNe), Ne gas pressure (PNe) and H2 gas pressure (PH2), (c) EC injection power (PEC) and line-integrated electron density (nel). The staircase-like time evolution of PH2 and PNe is due to low resolution of the ion current of the QMS.
Download figure:
Standard image High-resolution image
Figure 4. A poloidal magnetic configuration for a Ne-ECWC discharge.
Download figure:
Standard image High-resolution imageThe number of removed H2 molecules (NH2 rem), injected Ne (NNe inj) and evacuated Ne atoms (NNe evac) were evaluated by the following equations:
Here, C = 2.94 × 10²⁰ [particles/(Pa m3)] was the conversion factor, PH2 [Pa] and PNe [Pa] were partial pressures of H2 and Ne evaluated by the QMS, respectively, SH2 [m3/s] and SNe [m3/s] pumping speed of H2 and Ne, respectively, and QNe [atoms/s] Ne injection rate.
3. Results
3.1. Hydrogen removal and Ne retention by Ne-ECWC
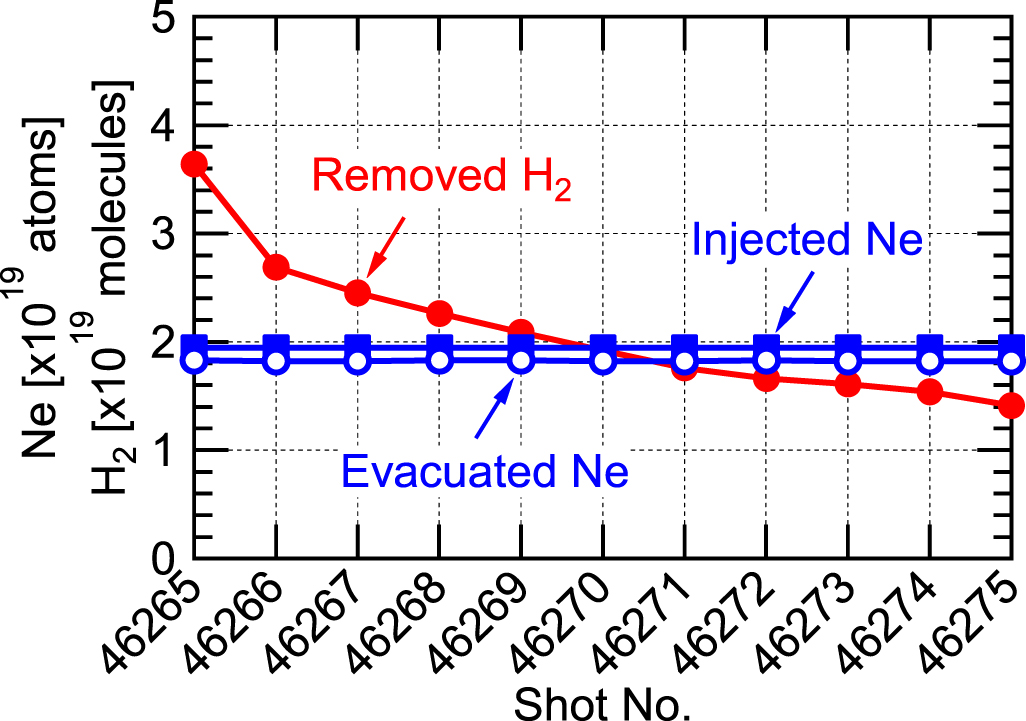
The number of removed H2 molecules, injected Ne atoms and evacuated Ne atoms were evaluated for the series of 11 Ne-ECWC pulses by particle balance analysis as shown in figure 5. The number of removed H2 molecules decreased monotonically with an increase in the shot number. The number of removed H2 molecules by the series of 11 Ne-ECWC pulses was 2.3 × 10²⁰. This was 10% of the retained H2 molecules preloaded by the EC heated H2 plasma (2.4 × 10²¹). The number of retained Ne atoms per one shot, evaluated by the difference between injected and evacuated Ne atoms, was less than detection limit of the particle balance analysis.

Figure 5. The number of removed H2 molecules, evacuated Ne atoms and injected Ne atoms by one pulse of Ne-ECWC as a function of shot number.
Download figure:
Standard image High-resolution image3.2. Influences of Ne-ECWC on tokamak plasma start-up
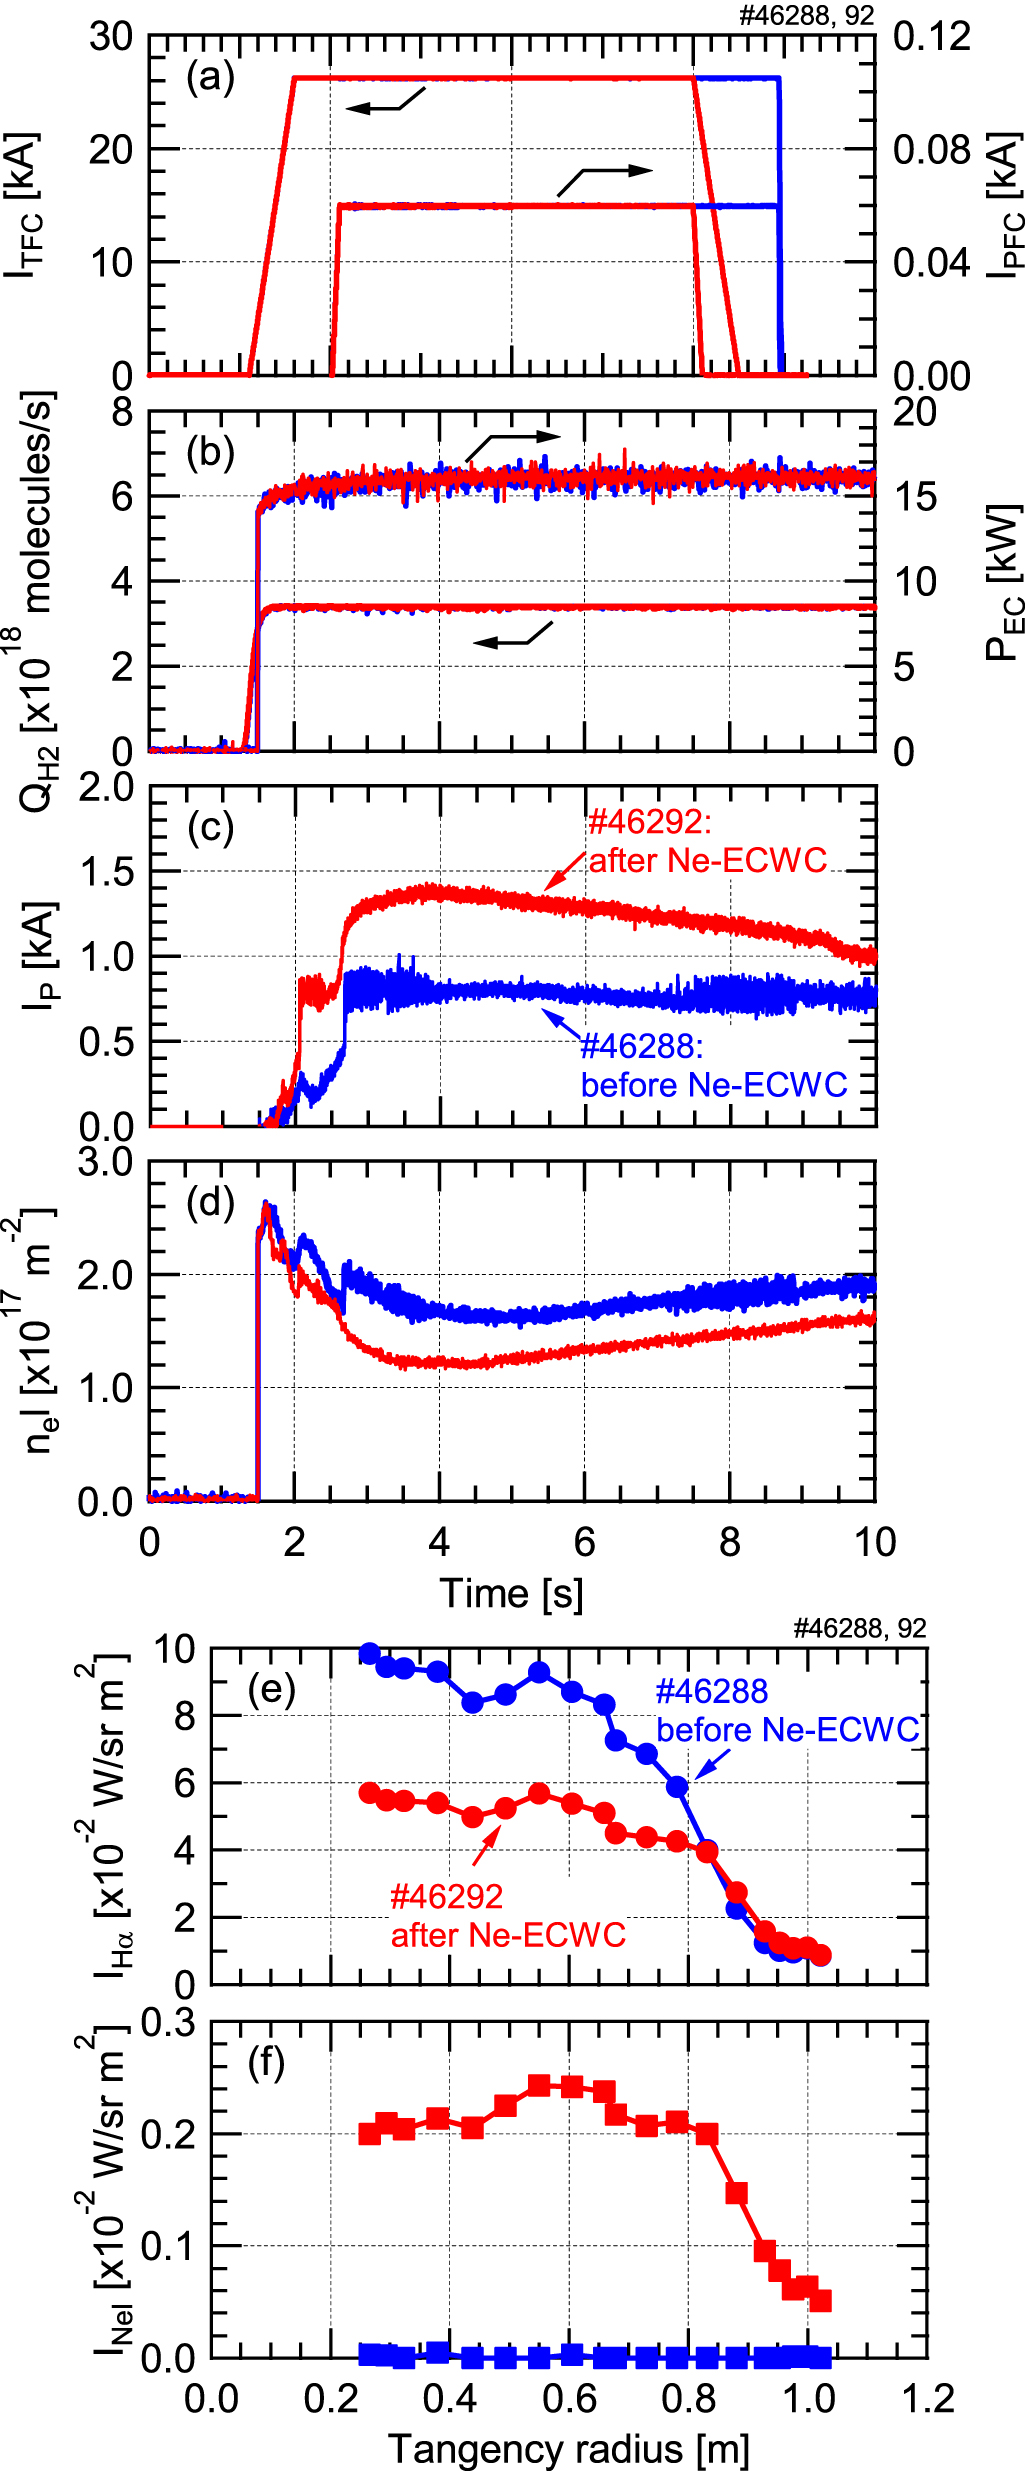
The plasma current, line-integrated electron density, Hα and Ne I intensities at a tokamak discharge with BT = 0.13 T (ITFC = 26 kA) and PEC = 16 kW after one Ne-ECWC pulse were compared to those before the Ne-ECWC under the same experimental condition, as shown in figures 6(a) and (b). The Ne-ECWC increased the plasma current, advanced the start-up timing of the plasma current (figure 6(c)) and decreased the line-integrated electron density (figure 6(d)). As shown in figure 6(e), the Ne-ECWC decreased the Hα intensity, indicating that the Ne-ECWC led to a decrease in H2 recycling. The reduction of the H2 recycling led to an increase in the plasma current and a decrease in the line-integrated electron density. This indicated that the Ne-ECWC also improved the controllability of ne by changing the H2 gas injection rate. As shown in figure 6(f), the Ne-ECWC increased the NeI intensity, indicating that Ne atoms below the detection limit of the present particle balance analysis were retained in the PFC. However, no clear influence such as plasma disruptions or reduction of the plasma current was observed on the tokamak plasma start-up.

Figure 6. Time traces of tokamak discharges before and after one pulse of the 10-s Ne-ECWC: (a) toroidal and poloidal coil currents (ITFC and IPFC), (b) H2 gas injection rate (QH2) and EC injection power (PEC), (c) plasma current and (d) line-integrated electron density (nel). Tangency radial distributions of (e) Hα and (f) Ne I intensities evaluated by the 19 ch visible spectrometer at the tokamak discharges at 3 s.
Download figure:
Standard image High-resolution image4. Discussion
4.1. Damage production into tungsten samples
Figure 7 shows TEM images of thin W samples (a) unexposed and (b) exposed to 10 pulses of 10-s Ne-ECWC plasmas. As shown in figure 7(a) no clear defect was observed on the unexposed W surface. However, as shown in figure 7(b) defects, like voids, bubbles and dislocation loops, were formed on the W surface exposed to the Ne-ECWC plasma.

Figure 7. Transmission electron microscope (TEM) images of thin W samples of (a) unexposed and (b) exposed to 10 pulses of 10-s Ne-ECWC plasmas.
Download figure:
Standard image High-resolution imageAlthough defects are expected to be produced by ions and/or high energy charge exchange (CX) neutrals, origin of the defects is not clear in this study. A negative floating potential is observed in plasmas produced by EC waves [10]. The defects in the W sample may be produced by energetic ions accelerated by the negative floating potential. Recently, void formation is observed on W irradiated by high energy (40 keV) Ne ions [11]. In the Ne-ECWC plasma, high energy CX neutrals could be produced, and these high energy neutrals may produce defects on the W surface.
In this study, it is not clarified whether the defect increases H2 retention and recycling on tokamak discharges. If the defect increases H2 retention and recycling, operational parameters such as Ne gas pressure in Ne-ECWC must be investigated to prevent the defect production. Further investigation into the origin of the defect and the operation parameter of Ne-ECWC will be conducted.
4.2. Influences of repetition of Ne-ECWC pulses on tokamak plasma start-up
As described in section 3.2, one pulse of 10 s Ne-ECWC improved the tokamak plasma start-up. Repetition of the Ne-ECWC pulse should improve the tokamak plasma start-up further. As shown in figure 5, because the ratio of the evacuated Ne to the injected Ne was constant for all the shot, the Ne retention in the wall should saturate on the first pulse of the Ne-ECWC. On the other hand, repetition of the Ne-ECWC increases the number of removed H2 molecules, resulting in a further decrease in the H2 recycling and the line-integrated electron density during the tokamak plasma start-up. These reductions should lead to a further increase in the plasma current and improvement in the controllability of the tokamak plasma.
4.3. Influences of Ne-ECWC on tokamak plasma start-up on larger devices
On larger devices, for example ITER, the electron temperature on the burn through phase is Te < 10–20 eV [12], which is similar to that of the edge of the tokamak plasma on QUEST produced in this study. Although the cooling rate of Ne is similar in both cases [13], the total radiation power on ITER is much larger than that on QUEST due to the larger plasma volume (2 m3 on QUEST vs. 290 m3 on ITER) and the higher ne (1017 m−3 vs. 2 × 10¹⁸ m−3) under the assumption that the number of retained Ne atoms in the torus is proportional to the surface area of the PFC (26 m2 vs. 900 m2). Because the increase rate of the total radiation power is larger than that of the heating power (0.016 MW vs. 7 MW), the radiation cooling by Ne on tokamak plasma start-up on ITER could be larger than that on QUEST.
4.4. EC absorption process on the Ne-ECWC
Figure 8 shows radial profiles of (a) electron density and (b) electron temperature evaluated from two consecutive pulses by the Thomson scattering system. Radial positions of the maximum electron density and temperature shifted 0.1–0.15 m toward the LFS compared with that of the fundamental resonance layer. The peak electron density reached the cut-off density of the 8.2 GHz O-mode EC wave (8.3 × 10¹⁷ m−3) within the measurement error of the Thomson scattering system. Hence, the EC wave injected from the LFS cannot reach the high field side region of R < 0.65 m. Electron density shown in figure 8(a) by the curved dashed line evaluated by an angular frequency expressed by

Figure 8. Radial profiles of (a) electron density and (b) electron temperature evaluated from two consecutive pulses by the Thomson scattering system. The horizontal broken line shows a cut-off density of the 8.2 GHz O-mode EC wave. The vertical dashed lines at R = 0.55 and 1.1 m indicate the position of the fundamental and second harmonic resonance layers, respectively, and that at R = 0.78 m indicates a position of an upper hybrid resonance layer. The curved dashed line shows an electron density evaluated from an angular frequency of an upper hybrid.
Download figure:
Standard image High-resolution imageindicates that the upper hybrid (UH) resonance layer is anticipated to be formed at the intersection point with the measured density, i.e. R = 0.78 m.
Based on these results, absorption processes of the 8.2 GHz O-mode EC wave are anticipated as shown in figure 9. The O-mode EC wave injected from the LFS propagates toward the high field side (HFS). Part of the EC wave reflected at the center-stack converts to an X-mode EC wave and propagates toward the LFS. The X-mode EC wave reflected at the UH resonance layer converts to an electron Bernstein wave (EBW), and it propagates toward the HFS and is absorbed at the region between the fundamental and the UH resonance layers. A similar absorption process is anticipated during tokamak plasma start-up with O-mode EC injection from the LFS in JT-60 U [14]. When the electron density reaches the cut-off density of the 8.2 GHz O-mode EC wave, the reflected EC wave at a location corresponding to the cut-off density converts to the X-mode EC wave and it propagates toward the LFS. The X-mode EC wave reflected at the UH resonance layer converts to the EBW, and it propagates toward the HFS and is absorbed at the region between the fundamental electron cyclotron and the UH resonance layers. This absorption process is utilized to heat plasmas with electron densities exceeding the cut-off density [15, 16]. To understand detailed mechanisms of the EC absorption, electron density and temperature of Ne-ECWC plasmas are evaluated at the midplane and top divertor, and ray tracing techniques are applied to the Ne-ECWC plasma with the measured plasma parameter.

Figure 9. Absorption process of the 8.2 GHz O-mode EC wave injected from the LFS. The vertical dashed lines at R = 0.55 and 1.1 m indicate the fundamental and second harmonic resonance layers, respectively, and the curved dashed line indicates the upper hybrid resonance layer.
Download figure:
Standard image High-resolution image4.5. Pulse length for efficient Ne-ECWC
Electron density and temperature of ECWC plasmas are expected to be higher than those of other wall conditioning plasmas such as GDC plasmas. Indeed, those of the Ne-ECWC plasma (ne ∼ 1017 m−3 and Te ∼ 10 eV as shown in figure 8) are higher than those of GDC plasmas (ne ∼ 1015 m−3 and Te < 1 eV) [17]. Due to the elevated electron density and temperature in ECWC plasmas, it is anticipated that H2 molecules desorbed from PFCs are ionized and subsequently re-implanted into the wall, resulting in a decrease in conditioning efficiency. To reduce re-implantation and improve wall conditioning efficiency, pulsed operation of ECWC is planned on ITER and JT-60SA. Pulse length of Ne-ECWC is discussed based on the electron density and temperature evaluated by the Thomson scattering system shown in figure 8.
Figure 10 shows rate coefficients for ionization of hydrogen atoms and molecules by electron impact as a function of electron temperature [18, 19]. The rate coefficients at the electron temperature with Te = 3–10 eV shown in figure 8(b) are (1–5) × 10−15 m3 s−1 for ionization of hydrogen atoms, (1–6) × 10−15 m3 s−1 for hydrogen molecules and <8 × 10⁻¹⁷ m3 s−1 for dissociative ionization of hydrogen molecules. It is noted that due to the lower rate coefficient for the dissociative ionization compared with the others, we focus on the rate coefficients for ionization of hydrogen atoms and molecules. The characteristic ionization time of hydrogen atoms and molecules is evaluated to be τi < 16 ms for the Ne-ECWC plasma with ne = (1–8) × 1017 m−3 and Te < 10 eV. This is much shorter than the characteristic pumping time of hydrogen τP = 3.2 s evaluated from the volume of the torus 14 m3 divided by the pumping speed of hydrogen 4.4 m3 s−1. In this case, therefore, the pulse length of the Ne-ECWC could be of the order of 10 ms to maximize the hydrogen removal efficiency. It is noted that characteristic time of hydrogen ejection and desorption from the wall is expected to be shorter than that of ionization. The characteristic time for the ejection of hydrogen atoms through sputtering should be on the same order of magnitude as the timescale of the growth of a collision cascade, which is typically of the order of 10 ps [20]. The characteristic time for the desorption of diffused hydrogen atoms should be comparable to the timescale of diffusion. This timescale is evaluated to be 0.2 ms, assuming that the retained hydrogen atoms within the range of Ne ions (5 nm with injection energy of 40 eV) diffuse with a diffusion coefficient in W evaluated by Frauenfelder [21].

Figure 10. Rate coefficients for ionization of hydrogen atoms and molecules by electron impact as a function of electron temperature.
Download figure:
Standard image High-resolution image
5. Conclusions
Ne-ECWC has been performed on QUEST with metal walls to investigate H2 removal, Ne retention, influences on tokamak plasma start-up and defect production. The Ne-ECWC removed retained hydrogen from the wall with small Ne retention below the detection limit of the present particle balance analysis. The Ne-ECWC decreased the Hα intensity or hydrogen recycling at the following tokamak discharge. This contributed to an increase in the plasma current and an advancement in the start-up timing of the plasma current. Although the Ne I intensity increased, no clear influence on the tokamak plasma start-up was observed. However, the Ne-ECWC produced defects including voids, bubbles, and dislocation loops in a tungsten sample. The electron density of the Ne-ECWC plasma had a peak at the region between the fundamental and the UH resonance layers. The peak density reached a cut-off density of the 8.2 GHz O-mode EC wave within the measurement error of the Thomson scattering system, anticipating the following EC absorption mechanisms. The O-mode EC wave injected from the LFS propagated toward the HFS, and it converted to the X-mode at the center-stack and/or at a location corresponding to the cut-off density. Subsequently, the X-mode EC wave propagated toward the LFS converted to the EBW at the UH resonance layer, and it propagated toward the HFS. The EBWwas absorbed at the region between the fundamental and UH resonance layers. A pulse length of the order of 10 ms was effective to remove retained hydrogen by Ne-ECWC due to the higher electron density and temperature compared with other wall conditioning plasmas such GDC plasmas. To apply the Ne-ECWC to future fusion devices with metal walls, we must investigate whether defects increase hydrogen retention/recycling at the following tokamak discharge. If defects increase in hydrogen retention/recycling, operational windows of Ne-ECWC must be clarified to avoid defects. On larger devices, for example ITER, influences of the radiation cooling by Ne could be larger than that on the compact device. This must be investigated on larger devices such as JT-60SA.
Acknowledgments
This work was supported in part by the NIFS Collaboration Research Program (NIFS19KUTR136).