


Abstract
In the pedestal region of the Experimental Advanced Superconducting Tokamak (EAST) during high confinement mode plasma operations with radio-frequency heating, two distinct fluctuations are observed: high-frequency fluctuations (HFFs) and edge harmonic oscillation-like (EHO-like) modes. The HFFs are characterized by intermittent fluctuations with a broadband frequency range of  and a poloidal wave number (
 ) greater than
  . On the other hand, the EHO-like mode exhibits characteristics similar to magnetohydrodynamics (MHD)-like modes with n = 1−5 and lower poloidal wave numbers (
 ). During the pedestal establishing phase following the L–H transition, a significant concurrent presence of HFF and EHO-like modes in high-density pedestal regions has been noted. In this phase, the EHO-like mode not only modulates the amplitude of the HFF but also engages in nonlinear interactions. The occurrence of EHO-like mode and HFF is associated with particle transport toward the divertor, though it is notably less than that caused by edge coherent modes. During the inter-edge localized mode (ELM) period, a significant decrease in the
  baseline is observed whenever the low frequency fluctuation (LFF) weakens and the HFF grows, prior to each large ELM. One possible explanation is that the rapid increase of
  shear stabilizes the LFF and destabilizes the HFF, which lowers the pedestal transport and enables the further growth of the pedestal until the onset of the ELM.
Export citation and abstract BibTeX RIS

Original content from this work may be used under the terms of the Creative Commons Attribution 4.0 license. Any further distribution of this work must maintain attribution to the author(s) and the title of the work, journal citation and DOI.
1. Introduction
In the high confinement mode (H-mode) of ITER, the fusion power is predicted to scale with the square of the pedestal pressure [1, 2]. As the pedestal pressure reaches a critical threshold, the periodic relaxation behaviors known as edge localized modes (ELMs) will be triggered. The EPED model has been developed to predicted the pedestal height and width based on the two constraints: the non-local peeling ballooning mode (PBM) and the local kinetic ballooning mode (KBM) [3]. The EPED have been successfully verified across multiple devices. However, besides KBM [4], instabilities such as micro-tearing mode (MTM), electron temperature gradient mode (ETG) and ion temperature gradient (ITG) scale turbulence have been found existing in the pedestal as predicted by gyro-kinetic simulations [5–7].
Over the past decade, different types of instabilities with frequencies from tens to hundreds of kHz have been observed in experiments, which are found important to the pedestal transport [8–18]. Recently, HFFs around several MHz have raised much attention [19–23]. In Globus-M, fluctuations around  were identified as filament structures within the separatrix during both ELMs and inter-ELM intervals [19]. The DIII-D experiment demonstrates that reducing shear can stabilize edge harmonic oscillation (EHO) while destabilizing low-frequency (below
  ) broadband MHD. During this process, a density fluctuation around
  is observed in the pedestal, accompanied by the broadband MHD. This improves the stability of PBM and allows for a wider and higher pedestal in the ELM-free quiescent H-mode (QH-mode) [20, 21]. Further in the ELMy H-mode, a transition from a low-frequency (
 ) quasi-coherent mode (LFQC) and a high-frequency (
 ) broadband (HFB) fluctuations is observed [22]. A sharp decrease in the
  baseline is found in the transition whenever the LFQC weakens and the HFB grows, which suggests a decreased transport by the HFB in the inter-ELM period. Recent observations of pedestal-localized turbulence during the inter-ELM period in DIII-D indicate that density fluctuations on the ITG scale increase immediately following each ELM crash, while
  fluctuations on the trapped electron mode (TEM) scale begin to increase once the pedestal saturates [23]. Therefore, the occurrence of MHz fluctuations may be intricately linked to the pedestal transport and evolution. The nature and role of these high-frequency fluctuations (HFFs) are not yet clear and require further investigation.
In this paper, the observations of EHO-like mode and HFF in Experimental Advanced Superconducting Tokamak (EAST) are presented for the first time. Different with previous study, the HFFs are found coexisting with low frequency EHO-like mode in the pedestal of ELMy H-mode plasma with pure radio-frequency (RF) heating. Both the characteristics of these modes and their interactions are introduced. The layout of the paper is as follows: section 2 shows the experimental setup, including the distribution of key diagnostics and the typical discharge. Section 3 shows the characteristics of the EHO-like mode. Section 4 illustrates the coexistence of the EHO-like mode and the HFFs. Section 5 discusses and summarizes the study.
2. Experimental setup
The EAST is a medium-sized tokamak with a major radius  and a minor radius
  [24]. For the purposes of this work, experiments are conducted in the upper single null configuration. Figure 1(a) presents the key diagnostics in the poloidal view. The density profile reflectometry (DPR) is employed to measure electron density profile with a sweeping frequency range of
  over
over  [25–27]. The density fluctuations are measured by multi-channel density fluctuation reflectometry system, which is positioned perpendicular to the surface on the low-field side. This system comprises two sub-systems: the O-mode DFR at K-port (DFR-K) [28] and the X-mode one at J-port (DFR-J). In order to measure the HFFs, the sampling rates of DFR-J and DFR-K are set as
  and
and  , respectively. The arrangement of DFR-K is shown in figure 1(b), the detecting frequencies are
 ![$\left[ {20.4\ 24.8\ 33\ 40} \right]{\text{ GHz}}$](https://content.cld.iop.org/journals/0029-5515/64/5/056017/revision2/nfad365dieqn20.gif) . The antennae set have a tilt angle of
. The antennae set have a tilt angle of  with respect to the horizontal line to ensure that the microwave beams are nearly perpendicular to the magnetic surfaces. Two poloidal separated receiving antennae enable two poloidal measurements and thus poloidal correlation analysis can be applied. For present antenna setting and EAST experimental geometry, the diagnostics can respond to fluctuations with
  in the plasma edge due to the larger plasma poloidal curvature. The divertor Langmuir probe arrays are installed at the lower and upper divertor and used for measurement of particle flux onto divertor (
 ) as figure 1(a) shown [29]. In this paper, the original density fluctuation signal from DFR is constructed by
  ,
,  and
and  are the in-phase and quadrature signals. The fluctuation amplitude at a specific frequency range (such as 1–3 MHz) can be extracted as follows. Initially, a band-pass filter within the
  frequency range is applied to the
  and
and  signals, yielding two new signals
 ![${{{I}}_{\left[ {1 - 3} \right]{\text{ MHz}}}}$](https://content.cld.iop.org/journals/0029-5515/64/5/056017/revision2/nfad365dieqn30.gif) and
and ![${{{Q}}_{\left[ {1 - 3} \right]{\text{ MHz}}}}$](https://content.cld.iop.org/journals/0029-5515/64/5/056017/revision2/nfad365dieqn31.gif) . Subsequently, the amplitude of the
. Subsequently, the amplitude of the  fluctuation is computed by
 ![${{{A}}_{\left[ {1 - 3} \right]{\text{ MHz}}}} = \sqrt {{{I}}_{\left[ {1 - 3} \right]{\text{ MHz}}}^2 + {{Q}}_{\left[ {1 - 3} \right]{\text{ MHz}}}^2} $](https://content.cld.iop.org/journals/0029-5515/64/5/056017/revision2/nfad365dieqn33.gif) . The correlation between two signals
. The correlation between two signals  and
and  is assessed via spectral coherence:
  , where
  ,
,  and
and  denote the Fourier auto-power and cross-power spectra densities, respectively.
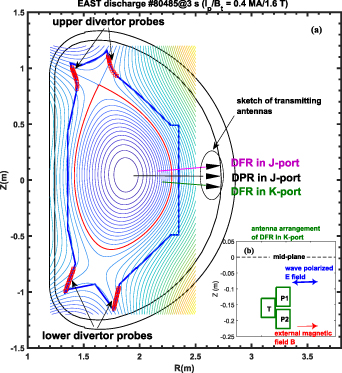
Figure 1. (a) The poloidal section of the EAST tokamak displays the positioning of key diagnostics, including the density profile reflectometry (DPR) in J-port, density fluctuation reflectometry situated in both J-port (DFR-J) and K-port (DFR-K), as well as the upper and lower divertor probes. (b) Antenna arrangement of DFR-K, which features a transmitting antenna (marked as 'T') and two poloidally separated receiving antennae (marked as 'P1' and 'P2'), enabling the measurement of turbulence's poloidal wave-number.
Download figure:
Standard image High-resolution imageFigure 2 illustrates a typical ELM-free discharge ( ) characterized by
  ,
,  , and
, and  , with
  lower hybrid wave (LHW) and neutral beam injection (NBI) heating. As delineated in figure 2, the L–H transition occurs around
  (indicated by the purple dashed line), ushering the plasma into the ELM-free H-mode under pure LHW heating. This transition is accompanied by the formation of a pedestal density, an increase in stored energy, and a reduction in
  emission. Over a span of approximately
  , the plasma density gradually increases and then keeps a constant about
  . At about
  , which is indicated in dashed lines, the plasma density suddenly increases accompanied with further dropping of
  emission. At about
  after the input of
  NBI, a notable drop in pedestal density occurs, which then diminishes to
  , while the
  emission reverts to the level at
  . The above process could closely relate to the pedestal transport, it is interesting to find what happens especially in the further density ramp-up phase during
  .
.
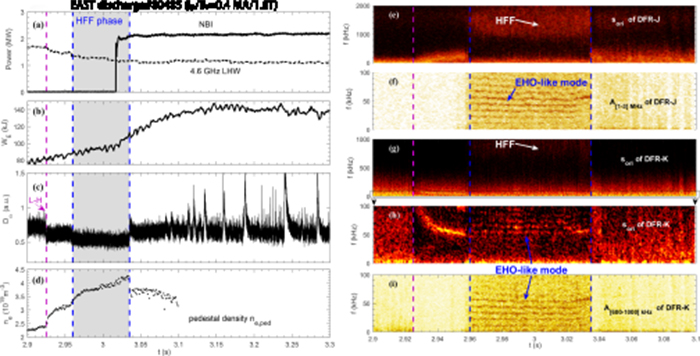
Figure 2. (a) Heating power, (b) stored energy, and (c)  emission, (d) pedestal density
  measured by DPR. (e) Original density fluctuation
  and (f) amplitude signal
 ![${{{A}}_{\left[ {1 - 3} \right]{\text{ MHz}}}}$](https://content.cld.iop.org/journals/0029-5515/64/5/056017/revision2/nfad365dieqn60.gif) spectrogram measured by DFR-J, (g)
spectrogram measured by DFR-J, (g)  and (i)
 ![${{{A}}_{\left[ {0.6 - 1.0} \right]{\text{ MHz}}}}$](https://content.cld.iop.org/journals/0029-5515/64/5/056017/revision2/nfad365dieqn62.gif) spectrogram measured by DFR-K. (h) Detail of the
spectrogram measured by DFR-K. (h) Detail of the ![$\left[ {0 - 100} \right]{\text{ kHz}}$](https://content.cld.iop.org/journals/0029-5515/64/5/056017/revision2/nfad365dieqn63.gif) range for (g).
range for (g).
Download figure:
Standard image High-resolution imageFigures 2(e) and (f) depict the spectrogram of complex signal and amplitude ![${{{A}}_{\left[ {1 - 3} \right]{\text{ MHz}}}}$](https://content.cld.iop.org/journals/0029-5515/64/5/056017/revision2/nfad365dieqn64.gif) measured by DFR-J, and similarly, figures 2(g) and (i) exhibit the spectrogram of complex signal and amplitude
measured by DFR-J, and similarly, figures 2(g) and (i) exhibit the spectrogram of complex signal and amplitude ![${{{A}}_{\left[ {0.6{-}1.0} \right]{\text{ MHz}}}}$](https://content.cld.iop.org/journals/0029-5515/64/5/056017/revision2/nfad365dieqn65.gif) measured by DFR-K. It is observed that between
measured by DFR-K. It is observed that between  , a type of HFFs emerges in the density fluctuation spectrograms, as depicted in figures 2(e) and (g). The frequency range of HFF is approximately
  for DFR-J and
  for DFR-K. As aforementioned, the sampling rate is
  for DFR-J and
  for DFR-K. Therefore, the lower frequency measured by DFR-K might be attributable to the under-sampling of the
  mode. The power spectral density (PSD) measured by them are plotted in figures 3(a) and (b). A symmetry is observed in the PSDs of the two systems, indicating that the microwave antenna and the magnetic surface are oriented perpendicularly to each other. This orientation effectively mitigates the influence of the Doppler shift effect on the analysis presented in this paper. Simultaneously, as observed in figures 2(f) and (i), a sequence of EHO-like modes with frequencies below
  are discernible in the spectrogram of the HFF's amplitude signal. These EHO-like modes are also found in figure 2(h), which is the enlarged spectrogram of figure 2(g) with frequency range below
  . This suggests that the amplitude of HFF may be modulated by the EHO-like mode at the frequencies corresponding to such harmonic modes. In the rest part we will name the amplitude of
  measured by DFR-K as
  and amplitude of
  measured by DFR-J as
  . Figure 3(b) illustrates the electron density profile at
  . The red diamonds and blue circles represent the cutoff layers for different channels in DFR-J and DFR-K, respectively, while the green rectangle highlights the channels within the gradient region where the HFF and EHO-like mode can be detected.
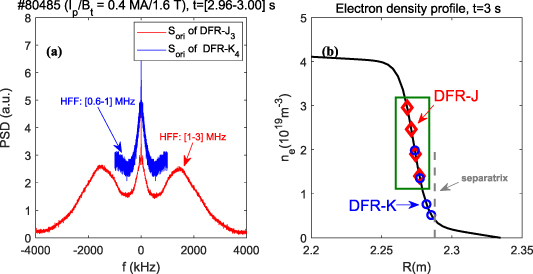
Figure 3. (a) Power spectral density (PSD) of density fluctuation measured by channel 3 of DFR-J and channel 4 of DFR-K, (b) electron density profile measured by DPR and the cutoff layers of different channels measured by DFR-J (red diamond) DFR-K (blue circle). The green rectangle denotes that the HFF could be detected in this region.
Download figure:
Standard image High-resolution imageIn figures 2(e), (g) and (h), it is observed that an edge coherent mode (ECM) [15, 16] emerges in the early phase of the L–H transition, and vanishes at  . During this phase, the pedestal density initially rises and stabilizes around
  . As the plasma transitions into the HFF phase, the pedestal density incrementally ascends to
  , accompanied by a further reduction in
  emission. The diminished
  baseline might be indicative of transport phenomenon [22], suggesting a lower pedestal transport in the HFF phase. The evolution of pedestal density is depicted in figure 2(d), the pedestal density keeps increasing during the entire HFF phase, and then drops after
  , which suggests a better pedestal particle confinement in the HFF phase than the ECM.
3. Characteristics of EHO-like mode in pedestal
3.1. Poloidal structure of EHO-like mode
Figure 4 shows the 2D local conditional wave number and frequency spectrum of the amplitude signal ( ), as measured by DFR-K at two poloidally separated positions on a single surface. It is evident from the figure that the EHO-like mode exhibits a distinct mode structure within the frequency range of
  , with a poloidal wave number of approximately
  . Consequently, the poloidal rotation velocity of the EHO-like mode is estimated as
  in the direction of electron diamagnetic drift (EDD) in the lab frame. These characteristics align with EHO observed in DIII-D tokamak [30], both experimental and simulation results reveal that the EHO has a lower poloidal number (
 for
for  ), with the EHO identified as a low-n (
 ) kink/peeling mode destabilized by edge
  rotational shear. Due to the absence of the magnetic measurement in this shot, the toroidal number of the EHO-like mode's magnetic fluctuation in a different discharge will be presented.

Figure 4. Local conditional wavenumber-frequency spectrum calculated by  measured during HFF phase in #80485, which shows a poloidal structure of EHO-like mode. The dashed lines are guides to the eye. Time window for fast Fourier transform (FFT) is
  .
.
Download figure:
Standard image High-resolution image3.2. Toroidal structure of EHO-like mode
Figure 5 illustrates the evolution of modes and pedestal parameters during two large ELM spikes. The typical plasma  (
( ,
,  ,
,  ) is heated via LHW and electron cyclotron resonance heating. As observed in figures 5(d) and (e), the pedestal density and temperature gradient begin to rise around 3.811 s following the burst of the preceding large ELM. At
  , when the pedestal reaches a threshold, the HFFs are triggered as depicted in the density fluctuation spectrogram in figure 5(b). It is clearly seen a periodic alternation of HFF and a low frequency fluctuation (LFF) with
  in figure 5(b), the pedestal density and temperature increase in the HFF phase and drop when the LFFs are excited, such phenomenon has been introduced in previous report [31]. In alignment with the ELM-free period, the amplitude of HFF (
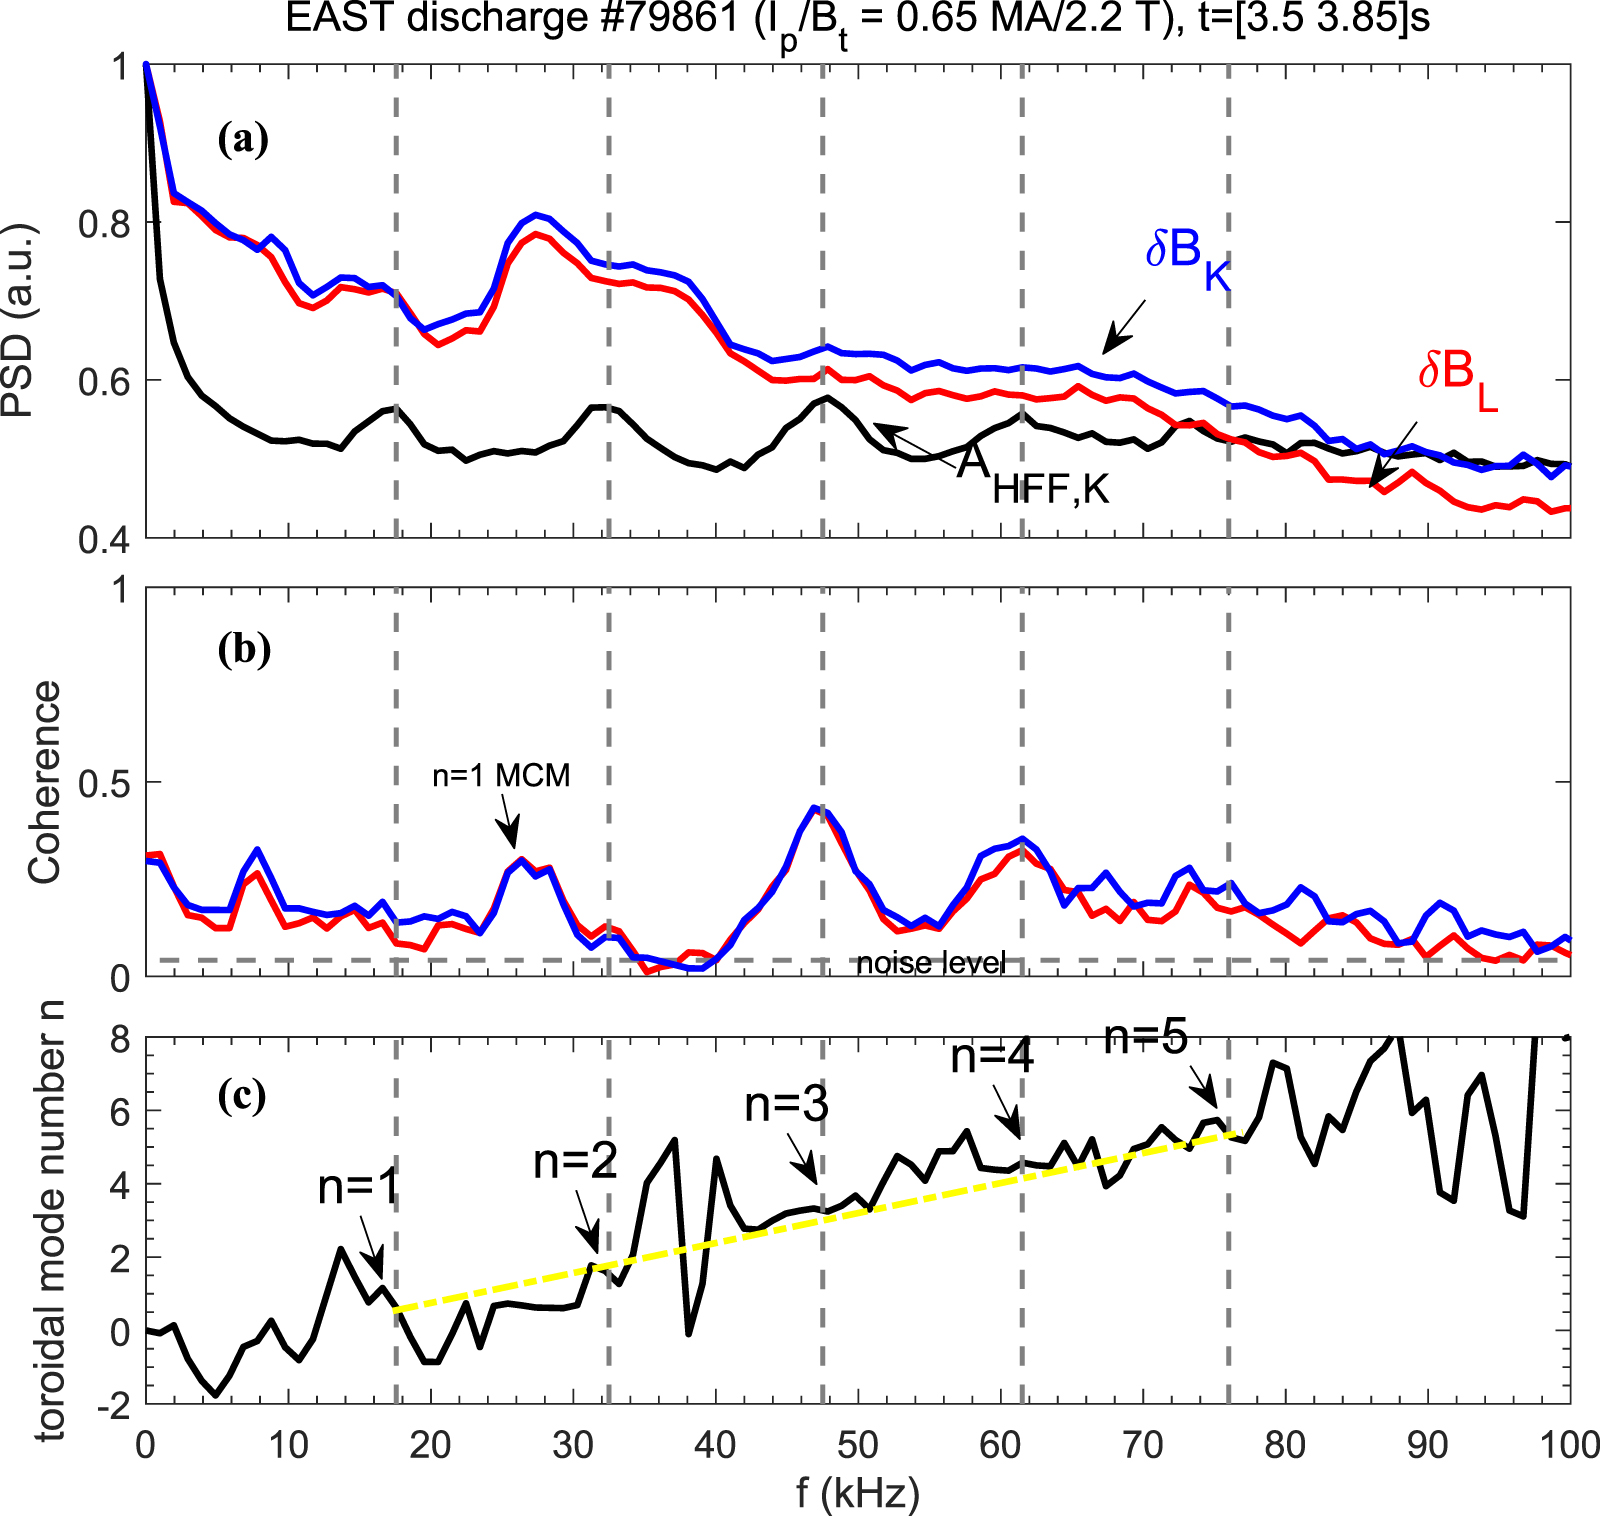
 ) is modulated by the EHO-like mode between two LFF bursts as displayed in figure 5(c). Magnetic measurement is available in this shot, and the toroidal mode number of EHO-like mode is deduced from magnetic fluctuations
  and
and  measured by magnetic coils at mid-plane in K-port and L-port with a toroidal separation of
  . It can be found in figures 6(a) and (b), the coherence between density and magnetic fluctuations at EHO-like frequency is much higher than the noise level, signifying a magnetic component of EHO-like mode. The toroidal number is computed from the of cross-phase difference between
  and
and  , as shown in figure 6(c), where the toroidal number of EHO-like mode within the frequency range
  is
is  , with the positive value indicates the EDD direction. The
  mode in figure 6(b) is possibly the
  magnetic coherent mode [32].
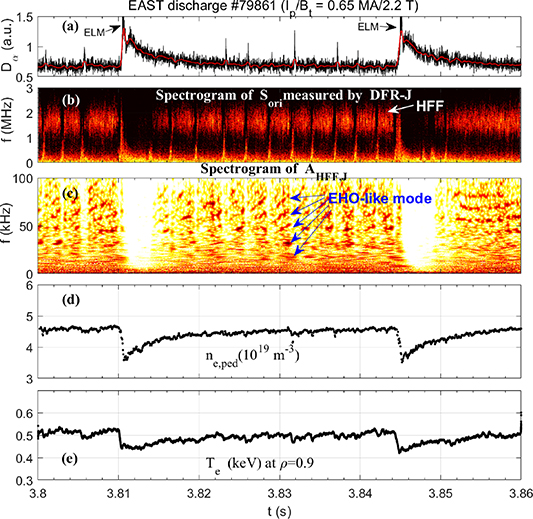
Figure 5. (a)  emission, (b) density fluctuation and (c)
  spectrograms measured by DFR-J. (d) pedestal density
  , (e) electron temperature
  at
at  .
.
Download figure:
Standard image High-resolution image
Figure 6. (a) PSD of magnetic fluctuations  and
and  measured by Mirnov probe (MP) at mid-plane in port-K and port-L respectively, as well as amplitude signal
  . (b) Coherence between
  and
and  (blue),
  (red). (c) Toroidal mode number calculated by the cross phase between
  and
and  . The gray dashed lines are the guidelines indicating the EHO-like frequencies, while the yellow one indicates the change of mode number. Time window for FFT is
  .
.
Download figure:
Standard image High-resolution image3.3. Effect of EHO-like mode on particle transport
Figure 7(a) depicts the PSD of the density fluctuation  and the amplitude
  measured by DFR-K during the HFF phase, while figure 7(b) displays their coherence. The EHO-like mode is also discernible in the spectrum of the original density fluctuation signal. The notable coherence at multiple frequencies of the EHO-like mode suggests that the amplitude of HFF in the
  range is modulated by the low-frequency EHO-like mode spanning
  .
.
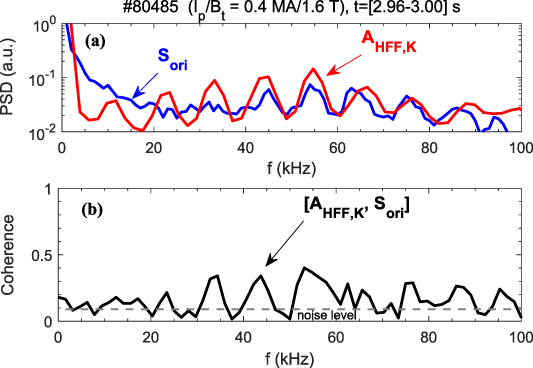
Figure 7. (a) PSD of density fluctuation  and amplitude signal
  , (b) coherence between them. Time window for FFT is
  .
.
Download figure:
Standard image High-resolution imageA salient characteristic of the EHO is its capability to facilitate benign and continuous edge particle transport, serving as a preferable alternative to ELMs. To verify the impact of the EHO-like mode on divertor transport, we select the amplitude of the EHO-like mode ![${A_{\left[ {10{-}100} \right]{\text{kHz}}}}$](https://content.cld.iop.org/journals/0029-5515/64/5/056017/revision2/nfad365dieqn132.gif) from the
from the  density fluctuation measured by DFR-K to do coherence analysis with divertor particle flux in shot #89649. Figures 8(a)–(c) shows coherence of EHO-like mode's amplitude
 ![${A_{\left[ {10 - 100} \right]{\text{kHz}}}}$](https://content.cld.iop.org/journals/0029-5515/64/5/056017/revision2/nfad365dieqn134.gif) and divertor particle flux
and divertor particle flux  with sampling rate of
  . The cross power and coherence, depicted in figures 8(a) and (b) by green solid line, show an obvious peak within
  , which indicates that the EHO-like mode is modulated by the
  mode. A negative phase delay is discernible in figure 8(c), from which the time delay is deduced as
  , as indicated by the red dashed line. The cross-correlation, illustrated in figure 9(a), is computed using the amplitude of the EHO-like mode and the particle flux, both subjected to a low-pass filter of
  , from
  to
to  . It is evident that the peak cross-correlation coefficient aligns with a time delay of
  , suggesting that the amplitude of the EHO-like mode precedes the particle flux onto the divertor by approximately
  . This time delay harmonizes with the result inferred from the slope of the cross phase, a rationale supported by the transit of particles from the outer mid-plane to the divertor along the scrape-off layer (SOL) magnetic field line on an ion transit time scale. Here the transit time
  is estimated by
  , with connection length
  and ion sound speed
  . For the HFF phase of
  ,
,  ,
,  , and thus
  ,
,  , consequently the transit time is
  . Therefore, the observed time delay (
 ) between the amplitude of EHO-like mode and the divertor particle flux is actually close to the time scale for a particle to move from the outer mid-plane to the divertor targets along the SOL field line.
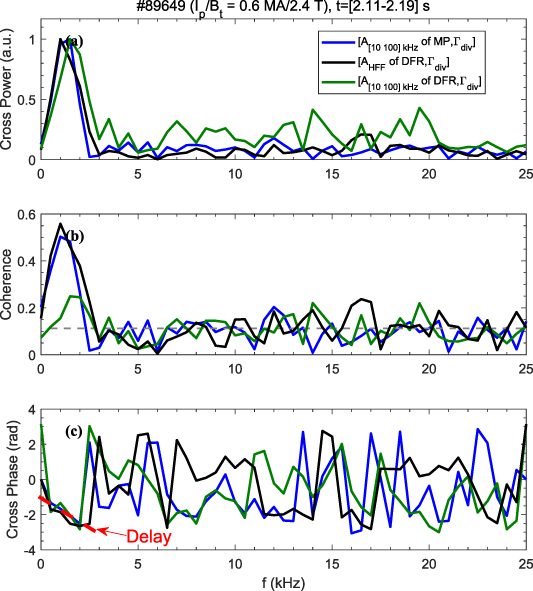
Figure 8. (a) Cross power, (b) coherence, (c) cross phase between three different signals: ![${A_{\left[ {10 - 100} \right]{\text{kHz}}}}$](https://content.cld.iop.org/journals/0029-5515/64/5/056017/revision2/nfad365dieqn156.gif) of Mirnov probe,
of Mirnov probe,  of DFR,
 ![${A_{\left[ {10 - 100} \right]{\text{kHz}}}}$](https://content.cld.iop.org/journals/0029-5515/64/5/056017/revision2/nfad365dieqn158.gif) of DFR and the divertor particle flux
of DFR and the divertor particle flux  . The red dashed line denotes a time delay between these signals. Time window for FFT is
  .
.
Download figure:
Standard image High-resolution image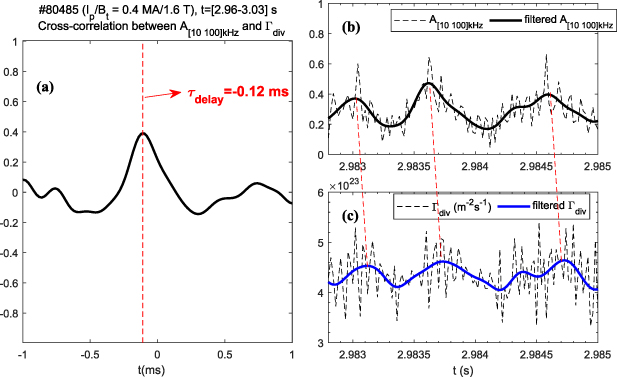
Figure 9. (a) The cross-correlation function between the EHO-like mode's amplitude ![${{\text{A}}_{\left[ {10{-}100} \right]{\text{ kHz}}}}$](https://content.cld.iop.org/journals/0029-5515/64/5/056017/revision2/nfad365dieqn161.gif) and divertor particle flux. Time evolution of (b) amplitude signal
and divertor particle flux. Time evolution of (b) amplitude signal ![${{\text{A}}_{\left[ {10{-}100} \right]{\text{ kHz}}}}$](https://content.cld.iop.org/journals/0029-5515/64/5/056017/revision2/nfad365dieqn162.gif) and (c) particle flux
and (c) particle flux  as well as their filtered curve. The red dashed lines show the delay between the bursts of EHO-like mode and divertor particle flux bursts. Time window for FFT is
  .
.
Download figure:
Standard image High-resolution imageFurthermore, figures 9(b) and (c) depict the temporal evolution of the particle flux signal, as measured by the divertor probe near the striking point, and the amplitude of the EHO-like mode ![${A_{\left[ {10 - 100} \right]{\text{kHz}}}}$](https://content.cld.iop.org/journals/0029-5515/64/5/056017/revision2/nfad365dieqn165.gif) . Their smoothed curves are obtained via a low-pass filter of
. Their smoothed curves are obtained via a low-pass filter of  . It is apparent that the particle flux increases after the burst of EHO-like mode. In particular, both the amplitude of EHO-like mode and the particle flux exhibit a 'bursty' behavior, with the former preceding the latter by approximately
  in time evolution as denoted by the red dashed lines. These findings suggest the burst of the EHO-like mode could drive particle transport toward divertor plates.
The reflectometry fluctuation amplitude measurements rely heavily on the reflection layer location. As the pedestal structure changes due to the transport, it is very likely that the reflection layer location changes with it, hence producing the illusion that the EHO-like mode amplitude changes with the pedestal profile or the divertor particle flux. The measurement of Mirnov probe (MP) does not have this issue, so the coherence between the amplitude of MP and the divertor particle flux is shown in figure 8. The strong coherence is also found below 3 kHz, which indicates that the low frequency modulation of EHO-like is not due to the movement of cut-off layer. The coherence between the amplitude of HFF and divertor flux is also shown in figure 8 by black solid line. Strong coherence can be also found below  , which indicates that the HFF could also contribute outward particle flux toward divertor. Note that weak coherence can be found at about
  , which is the lowest frequency of EHO-like mode in this shot. This result suggests that the EHO-like mode could modulate the amplitude of HFF and also the particle flux at the frequency of EHO-like mode. Back to the figure 2, the transition into the high pedestal HFF phase is also accompanied by a sudden cessation of the ECM. At the time when the ECM ceases there is a large drop in the
  signal (figure 2(c)), which is probably due to the lack of the ECM induced transport and the weaker transport from the EHO-like mode. As the EHO-like mode disappears, the
  signal increases to the previous level. Therefore, the relatively weaker transport level caused by EHO-like mode could partly contribute to the continuous growth of the pedestal density.
4. Co-existence of EHO-like mode and HFF and their interaction
4.1. Poloidal structure of HFF
It has been observed that both the DFR-K and DFR-J capture the respective fluctuations of HFF, the frequency range being 0.6–1.0 MHz for DFR-K and  for DFR-J. A primary conceivable reason for this discrepancy is the variation in the sampling rate. To elucidate this, we resampled the data acquired by DFR-J from
  to
to  . Figure 10 shows the PSD and coherence as gauged by the two systems. In figure (10
a), a pronounced broadband turbulence within the
. Figure 10 shows the PSD and coherence as gauged by the two systems. In figure (10
a), a pronounced broadband turbulence within the  range is discernible in both signals captured by DFR-K and DFR-J. Figure 10(b) depicts that the coherence within the corresponding frequency range significantly surpasses the noise level. This substantiates that the corresponding fluctuations in the
  range as measured by DFR-K also represent the HFF, the discrepancy in the frequency range is attributable to the lower sampling rate of DFR-K in comparison to DFR-J. Figures 10(c)–(e) unveil the cross power, coherence and poloidal wave number of the HFF as measured by the DFR-K at two poloidally separated positions P1 and P2 during the HFF phase. As illustrated in figures 10(c) and (d), both the cross power and coherence within the HFF range, i.e.
  , are notably robust. Figure 10(e) reveals that the poloidal wave number of HFF lies between
  , corresponding to
  , with the positive value signifying a rotating direction of the EDD in the lab frame.
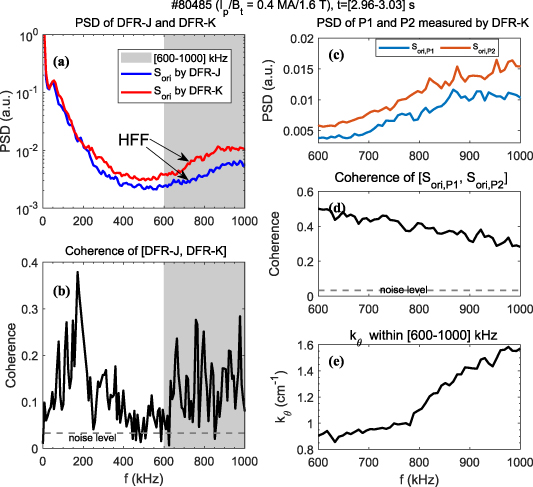
Figure 10. (a) PSD of density fluctuation Sori measured by DFR-J and DFR-K and (b) coherence between them. (c) PSD of density fluctuation measured by DFR-K at different poloidal position P1 and P2, (d) their coherence and (e) poloidal wave number within  . Time window for FFT is
  .
.
Download figure:
Standard image High-resolution image4.2. Stimulation of HFF
As depicted in figure 5, the HFF is triggered once the pedestal reaches a certain threshold. To elucidate this, figures 11(a)–(c) present statistical data captured during the ELM cycle from 3.810 to 3.845 s, encompassing the gradient of pedestal density, temperature, pressure as well as the amplitude of the HFF. It is observed that the initiation of HFF fluctuation is contingent upon reaching a threshold in gradient of pedestal pressure. In this particular instance, the threshold is identified to be around 3.2 kPa, and beyond this threshold, the amplitude of fluctuation exhibits an increasing trend with pedestal pressure. Figures 11(d) and (e) elucidate the evolution of high-frequency mode density fluctuations and amplitude signals over a brief time span, revealing an intermittent bursting characteristic of the high-frequency mode. This characteristic also leads to the occurrence of points with lower amplitude during phases of elevated pressure, aligning with the phenomena depicted in figures 11(a)–(c).

Figure 11. Statistical results of (a) pedestal density, (b) pedestal temperature and (c) pedestal pressure versus amplitude of HFF during the ELM cycle shown in figure 5. (d) Density fluctuation signal and (e) amplitude of HFF in short time interval. The pedestal temperature is approximately indicated by the temperature around  .
.
Download figure:
Standard image High-resolution imageFigure 12 presents the evolution of the HFF and pedestal parameters in the inter-ELM period. Figure 12(a) shows several ELM periods including large ELM and  spikes. Figure 10(b) is the spectrogram of density fluctuation measured by Doppler backscattering system (DBS) in the gradient region around
  , and figure 10(c) shows the integrate power of 1–2 MHz from the spectrogram. In the early phase just after the ELM crash, LFF with
  emerges, and in the later phase, the LFF disappears as the HFF becomes stronger. It is seen that the HFF soon weakens just before the onset of next ELM crash, and the LFF grows up again after the ELM crash. It is noticed that the
  signal decreases with the disappearance of LFF and also the presence of HFF, suggesting a lower transport in the phase of HFF when compared with LFF phase. To verify the hypothesis, the evolution of
  velocity and its shear is provided by measurement of DBS. The perpendicular velocities
  near
near  and
and  are plotted together in figure 12(d), the
  shear in this region is shown in figure 12(e). As the perpendicular velocity
  , here the
  and
and  are the
  and phase velocity, respectively. Basing on a reasonable assumption that
  , the
, the  could be qualitatively represented by perpendicular velocity
  [33]. The evolution of edge density and temperature is shown in figures 12(f) and (g). As indicated by the purple dashed line, the
  velocity increases with the weaken of LFF in the HFF phase, and follows the slight rise of edge density and temperature. The rise of the density profile and density gradient can be found in figure 13. According to the radial force balance equation:
  . Here the
  is the radial electric field,
  ,
,  and
and  is the charge, density and pressure of ion.
  and
and  are the ion velocity and magnetic field in the poloidal (
 ) and toroidal (
 ) directions. Here we assume that the rise of
  and
and  are coincident with each other. Therefore, the rise of
  means the rise of
  , which is firmly linked to the term of pedestal gradient of pressure. It is noticed that an obvious increase in the
  shear as shown in figure 12(e). As shown in figures 12(c)–(e), the
  shear starts to increase before the rise of the
  velocity and the stimulation of HFF, implying a potential effect of
  shear on the HFF. The increased
  shear suppresses the LFF and destabilizes the HFF, resulting in a lower transport level. This allows for an increase of pedestal gradient and the rotational velocity until the onset of ELM.

Figure 12. (a)  emission, (b) spectrogram of density fluctuation and (c) integrate power of
 ![$\left[ {1{-}2} \right]{\text{ MHz}}$](https://content.cld.iop.org/journals/0029-5515/64/5/056017/revision2/nfad365dieqn219.gif) measured by DBS. (d) Perpendicular velocity at
measured by DBS. (d) Perpendicular velocity at  and
and  . (e)
. (e)  shearing rate, (f) contour plot of pedestal density
  , (g) electron temperature
  at
at  and
and  .
.
Download figure:
Standard image High-resolution image
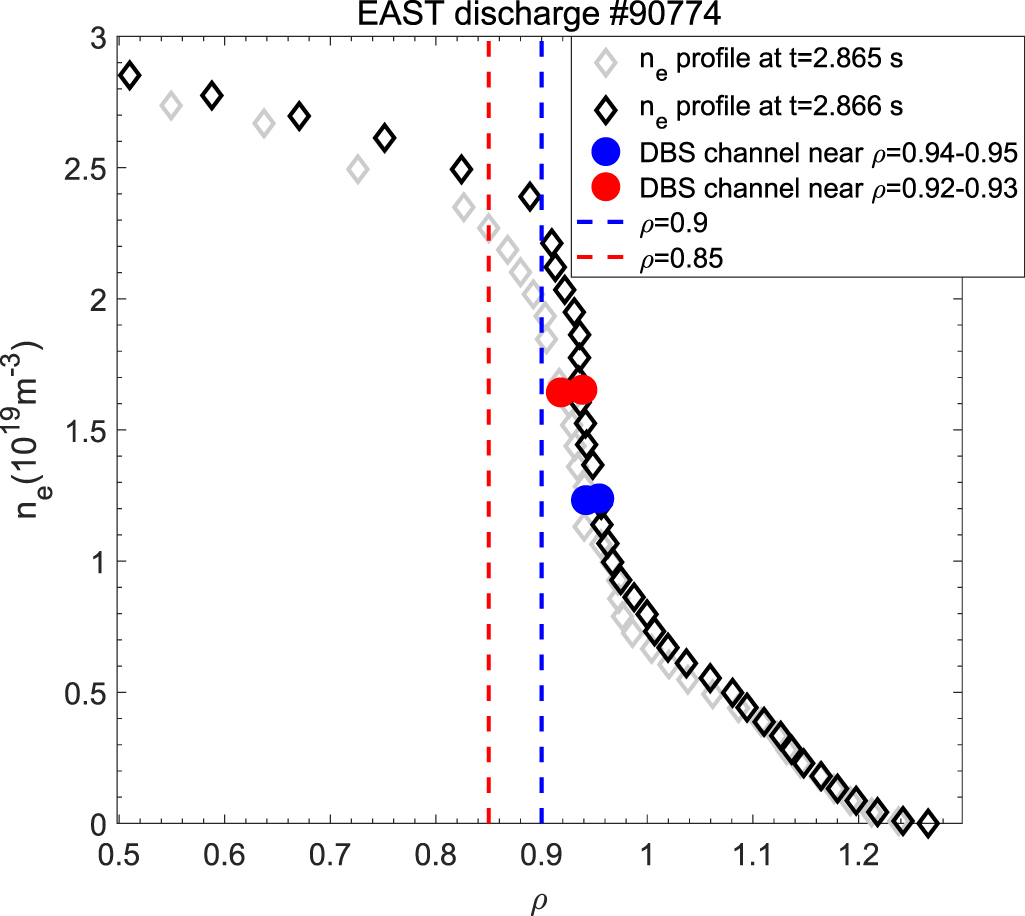
Figure 13. Profiles of electron density profile measured by DPR and the cutoff layers of DBS (red and blue circles). The red and blue dashed line denotes the radial position of  and
and  , which is the measured positions of
  in figure 12(g).
Download figure:
Standard image High-resolution image4.3. Interaction between the HFF and EHO-like mode
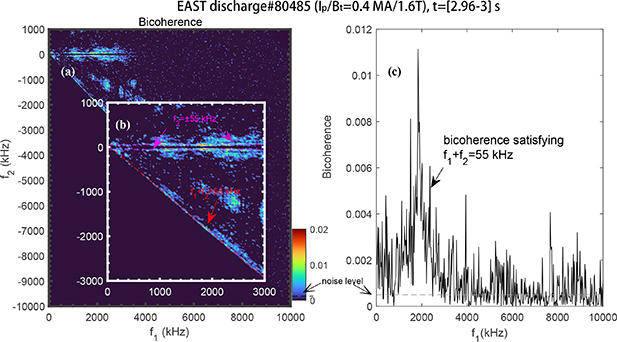
In figure 2, the simultaneous presence of HFF and EHO-like mode in the pedestal is demonstrated, sparking curiosity regarding the interaction between these distinct modes. The notable modulation of HFF amplitude with the frequency of the EHO-like mode is observed, emphasizing the significance of nonlinear coupling in this cross-scale interaction. We delve into the potential nonlinear interaction between broadband turbulence and the EHO-like mode employing an auto-bicoherence function:  . Here
  ,
,  , and
, and  denote the Fourier coefficients of the harmonics with frequencies
  ,
,  , and
, and  respectively. The bispectral coefficient
  reflects the phase correlation between these three waves satisfying
  . Figure 14(a) shows the auto bicoherence of the density fluctuation as measured by DFR-J during HFF phase of shot
  . A pronounced coherence is discerned in the frequency domain of
  ,
,  , with a diminished coherence in other frequency ranges. As elucidated in figure 14(b), the correlation coefficients along the lines
  and
and  within
  are significantly higher than the noise level. It is noteworthy that the
  corresponds to the frequency of the EHO-like mode exhibiting the highest power (see figure 7(a)). Figure 14(c), portraying the bicoherence satisfying
  , unveils a significant interaction with broadband turbulence (
 ) which aligns with the frequency range of HFF. These findings underscore a significant nonlinear interaction between the EHO-like mode and HFF.
Figure 14. (a) Auto-bicoherence spectrogram and it is (b) detailed figure for the density fluctuation signal measured by CR during  in the HFF phase of shot #80485. (c) Bicoherence satisfying
  . The purple dashed lines represent
  , while the red dashed line represents
  . Time window for FFT is
  .
.
Download figure:
Standard image High-resolution image
5. Discussion and conclusion
5.1. Discussion
The above analyses present the coexistence of HFF and EHO-like mode within the H-mode pedestal region of the EAST tokamak. The EHO-like mode is characterized as an MHD-like mode with a toroidal mode  ,
,  and
and  , exhibiting rotation in the EDD direction in the lab frame. Drawing a comparative analysis with the EHO observed in DIII-D plasma, which is identified as a low-n mode (
 ) destabilized by rotational shear, both the diagnostic data from microwave imaging reflectometer and M3D-C1 modeling exhibit a poloidal number of
  for n ⩽ 5, rotating in the EDD direction in lab frame with frequency below
  . These characteristics closely resemble the EHO-like mode identified in our investigation. The EHO-like mode is found at different
  and a relatively high
  , suggesting a closely relation between EHO-like mode and the
  . Result shows that the
  is about 3.5–5.5, the value is similar with EHO-discharge in JET, AUG and the DIII-D [34, 35]. Furthermore, akin to the EHO, the EHO-like mode is demonstrated to drive particle transport toward the divertor. Nonetheless, the transport level caused by EHO-like mode is much weaker than that induced by the ECM. Previous study [16] demonstrated that ECM could cause about
  perturbation (
 ) in the particle flux toward the divertor, while this value is about 8% for EHO-like mode as shown in figure 9(c). Consequently, a continuous increase of pedestal density is observed throughout the EHO-like mode's duration. Yet it remains unknown what trigger the transition from ECM to EHO-like mode/HFF without the change of external power and particle source. Recent result in DIII-D presented a transition from EHO to the broad-band MHD is found when the input toque ramps down to zero, which shows a strong correlation to the E × B shear [20]. However, in our study there is no active change in NBI torque during the transition from ECM to EHO-like mode as shown in figure 2. The change of local E × B shear should be taken into account in future work.
The HFF is discerned by DFRs operating at varying sampling rates: DFR-J, with a sampling rate of  , delineates a frequency range of
  for HFF, while DFR-K, operating at
  , identifies a frequency range of
  . As illustrated in figure 10, pronounced coherence within the
  range underscores the identity of these fluctuations as HFF, the discrepancy in frequency being attributable to the differing sampling rates. The poloidal scale of HFF, as inferred from the poloidal mode number of the
  mode measured by DFR-K, spans
  (or
(or  ), which is close to an ITG scale. However, due to under-sampling, the actual poloidal scale of HFF could be substantially larger. Moreover, the HFF cannot be ETG as the DFR is measuring density fluctuations with
  in the pedestal [36], while the ETG has a small-scale (
 ). In the DIII-D tokamak, it is observed the ITG-scale mode (
 ,
,  ,
,  ) increases immediately after each ELM crash and is quickly suppressed by increased local E × B shear, instead a TEM-scale mode (
 ,
,  ,
,  ) become dominant in the gradient region [23]. In our experiment, the HFF could also detected by the DBS reflectometry as shown in figure 12, while the detected wave number is about
  . The destabilization of HFF is accompanied by a rapid increase of the
  shear, which is consistent with the phenomenon of the high frequency TEM turbulence. The TRANSP simulation suggests the MTM or the TEM could be the potential candidate for the observed high frequency modes [22].
The nonlinear cross-scale interaction observed between the EHO-like mode and the HFF unveils a notable interplay, as delineated in figure 12(b). Herein, the EHO-like mode predominantly interacts with the background turbulence within the frequency range of  , coinciding with the frequency domain of the HFF. Such interaction could have indirect effect on the evolution of pedestal and the onset of ELM. For instance, in the JET tokamak, a distinct interaction between the type-I ELM precursor and the washboard mode (WBM) has been delineated. The onset of type-I ELM precursors is correlated with a weakening, or even an inhibition of the WBM as cited in [8]. Moreover, in the DIII-D tokamak, the nonlinear coupling of pedestal modes, associated with radial distortions propelling out of the pedestal, is posited as a primary trigger for the low-frequency ELMs. This nonlinear interaction emerges as a plausible candidate for the triggering of ELMs, as outlined in [37]. However, the impact of the interaction between HFF and EHO-like modes on the pedestal evolution remains an uncharted territory. The nonlinear energy transfer between these modes could potentially modulate the transport level, affect pedestal saturation, and influence the onset of ELMs, meriting further analysis.
5.2. Conclusion
In conclusion, the coexistence of HFF with frequency about  and EHO-like mode
  are observed in pure RF heating for the first time on EAST tokamak. In the study, the HFF is an ITG/TEM scale mode fluctuation rotating in the direction of EDD in the lab frame, and it is found modulated by the EHO-like mode. Measurements show the EHO-like mode has a mode structure similar to EHO, e.g.
  and
and  rotating in the EDD direction in the lab frame with
  . Analysis shows that both EHO-like mode and HFF could drive outward particle flux toward divertor. Statistical data analysis demonstrates that a threshold of pedestal gradient of pressure exists for the triggering of the HFF, and the fluctuation amplitude shows a fast increase with the pedestal pressure beyond the threshold. During the inter-ELM period, a significant decrease in the
  baseline is observed whenever the LFF weakens and the HFF grows, prior to each large ELM. One possible explanation is that the rapid increase of
  shear stabilizes the LFF and destabilizes the HFF, which lowers the pedestal transport and enables the further growth of the pedestal until the onset of the ELM. Moreover, further analysis indicates a strong nonlinear interaction between the EHO-like mode and HFF. So far, both the ELM and EHO are efficient vehicles to drive particle transport for impurity removal in ELMy H-mode and QH mode, respectively. The observation in this paper actually expands the operation space of the EHO plasma in ELMy H-mode without NBI input, and it could be a possible candidate for the low external momentum input condition of ITER. In the next step of the work, the nature of HFF should be identified by the 'fingerprint' method [7]. The velocity and its shear should be considered to study the transition from ECM to EHO-like mode. And the role of these fluctuations in the triggering of ELM would be studied. We believe the present results will be beneficial for further understanding of a turbulence transport in the H-mode.
Acknowledgments
This work has been supported by the National Key R&D Program of China (Nos. 2022YFE03050003, 2019YFE03040002, 2022YFE03020004, 2019YFE03080200 and 2022YFE03070004) and National Natural Science Foundation of China (Nos. 12275315, 11875289, 12175277, 12005144 and 11975271). This work is partly supported by the Youth Science and Technology Talents Support Program (2020) by Anhui Association for Science and Technology (No. RCTJ202009), and the Open Fund of Magnetic Confinement Laboratory of Anhui Province (No. 2023AMF03005).