


Abstract
The physics behind the difference in heating power threshold for the low to high confinement (L–H) transition between favorable ion  drift (toward active X-point) and unfavorable ion
  drift (away from active X-point) magnetic configurations is a longstanding open question. In this work we show differences in edge (
 –1.0) turbulence in matched heating power favorable and unfavorable magnetic configuration discharges using a correlation electron cyclotron emission diagnostic to measure radiated temperature (
 ) fluctuations. During power matched L-mode phases, the edge
  fluctuations have higher amplitude in the unfavorable configuration plasma as compared to the favorable configuration plasma. The lower fluctuation amplitude in favorable configuration is observed concomitant with increased E × B shear, as compared to the unfavorable case. Although this turbulence is different in amplitude, it is similar in radial and frequency structure between favorable and unfavorable configurations and grows to the weakly coherent mode during the I-mode phase of the unfavorable configuration discharge. A broadband pedestal fluctuation is seen during an inter-ELM H-mode period of the favorable configuration discharge.
Export citation and abstract BibTeX RIS

Original content from this work may be used under the terms of the Creative Commons Attribution 4.0 license. Any further distribution of this work must maintain attribution to the author(s) and the title of the work, journal citation and DOI.
1. Introduction
The high confinement operating regime (H-mode) [1] was a critical discovery toward reaching high performance in tokamak reactors. H-mode is classified by its improved energy and particle confinement compared to the low confinement operating regime (L-mode), enabled by the formation of an edge transport barrier. A complete picture of the L to H mode transition is still under investigation and open questions remain about the triggering of the transition and its parameter dependencies. The development of a radial electric field ( ) well is critical for the transition to H-mode, as the steep gradients in
  lead to a sheared E × B velocity, which suppresses the underlying edge turbulence [2–4]. Both the inner and outer shear layers associated with the
  well are thought to be important for the L to H transition [5]. Studies across machines investigate the L to H transition experimentally. Alcator C-Mod studies are reviewed in [6] and ASDEX Upgrade (AUG) studies are reviewed in [7].
One of the unanswered questions about the L to H-mode transition is reason for differences observed in the power threshold for different magnetic configurations. The favorable magnetic configuration features the ion  drift pointing toward the active X-point in a single null plasma, while the unfavorable magnetic configuration has ion
  drift pointing away from the active X-point. Empirical scaling laws have been derived for favorable configuration plasmas above a density minimum, which largely capture the applied heating power threshold for the L to H transition [8]. In unfavorable magnetic configuration, the power threshold for transition is roughly twice the favorable configuration threshold for a matched plasma [9–11]. Differences in
  between favorable and unfavorable configuration plasmas have been observed in both the confined region of the plasma [11–15] and the scrape-off layer (SOL) [16, 17]. These differences in
  could lead to differences in turbulence suppression by E × B flow shear between the two configurations. At Alcator C-Mod, the direction of the SOL turbulence-driven flows changed when the configuration was switched from favorable to unfavorable by switching from lower single null to upper single null (USN) topology [18]. These SOL flows were suggested to impose a boundary condition on confined plasma toroidal rotation, which effects
  . At AUG, the direction of SOL flow does not change with magnetic configuration and so cannot explain a difference in power threshold between favorable and unfavorable configuration [11]. Differences in ion orbit losses and neutral penetration into the plasma are also candidates for explaining differences in
  and the difference in power threshold between the two configurations [19, 20]. In addition, in the confined region of the plasma, the magnetic configuration is theorized to effect the turbulent eddy tilt and Reynolds stress, which may also effect
  [21, 22].
The I-mode confinement regime is an improved confinement operating regime that occurs most readily in the unfavorable magnetic configuration due to the larger power window before the H-mode threshold compared to the favorable configuration [23–25]. I-mode is characterized by an energy transport barrier without a particle transport barrier and the mechanism of this particular type of transport barrier formation is an open question. The confinement quality of I-mode and the depth of the  well in I-mode fall in between L-mode and H-mode values, with high quality I-modes able to operate with confinement time similar to H-modes [25].
I-mode is usually accompanied by a characteristic pedestal broadband fluctuation known as the weakly coherent mode (WCM). The WCM has also been observed in L-modes preceding or following I-modes [26, 27]. At AUG, the WCM typically occupies the frequency range 50–150 kHz and has wavenumbers in the range 0.5–1.0  in the electron diamagnetic direction [27, 28]. A low frequency edge oscillation (LFEO) has also been found to occupy the I-mode pedestal. The LFEO is suggested to be a modified geodesic acoustic mode (GAM) [29]. The WCM and GAM or LFEO are known to couple and exchange energy, with the GAM receiving energy from the WCM and possibly responsible for the frequency broadening of the WCM [30, 31]. The transfer of energy between turbulence and GAMs and zonal flows (ZFs) is thought to be important to confinement regime transitions. An overview of GAM behavior in tokamaks is given in [32] and an overview of ZFs is given in [33]. One physical explanation for the L (and I) to H transition is that the transfer of energy from turbulence to ZFs reaches a threshold corresponding with turbulence drive [34, 35]. A competition between the transfer of energy from turbulence to ZFs and to GAMs may be possible during I-mode in the unfavorable configuration, but contrasting views exist about the existence of a ZF/GAM competition in the direct L to H transition in favorable magnetic configuration [34, 35].
In order to gain insight into edge turbulence in favorable and unfavorable magnetic configurations across different confinement regimes, we performed matched discharges in the two magnetic configurations. High radial resolution measurements of edge ( –1.0) radiated temperature (
 ) fluctuations provide important information about differences in turbulence in the confined plasma across the narrow radial region where transport barrier formation takes place during confinement regime transitions. This paper presents edge turbulence and
  measurements from matched favorable and unfavorable L-mode plasmas, as well as I-mode and H-mode plasmas after confinement regime transitions.
2. Matched favorable and unfavorable experiments
Experiments were performed on AUG to investigate the nature of turbulence across confinement regime transitions in the favorable and unfavorable magnetic field configurations. To access confinement regime transitions, electron cyclotron resonance heating (ECRH) was applied in power steps. The comparison between the two plasmas was performed by holding all programmed quantities of the plasma fixed between discharges, but changing the direction of the magnetic field between discharges from −2.5 T to +2.5 T. Both discharges were performed in USN with the X-point at the top of the plasma, making the +2.5 T plasma the case with favorable  drift and the −2.5 T plasma the case with unfavorable
  drift.
The time evolution of these discharges is shown in figure 1. Both the favorable and unfavorable configuration discharges are in L-mode during the first two power steps and have matched ECRH power, stored energy, core electron temperature as determined by electron cyclotron emission (ECE), and edge density as determined by interferometry. In the following sections of this paper, the first power phase at 0.2 MW ECRH is called the 'low power L-mode' and the second power phase as 0.6 MW ECRH is called the 'high power L-mode'. At the end of the second ECRH power step, the favorable discharge undergoes a confinement regime transition to an ELMy H-mode with type I ELMs. This L to H transition coincides with the timing of a diagnostic neutral beam injection (NBI) blip for  measurements. During the transition to H-mode, the density and stored energy increase. This H-mode is interrupted by a brief back-transition to L-mode accompanied by a spike in radiation, but then the plasma returns to H-mode. The unfavorable configuration discharge remains in L-mode during the 1.2 MW power step, but enters I-mode with the fourth power step at 1.8 MW, during which the density is constant, but the electron temperature and stored energy increase moderately. At 3.55 s during the fourth power step, the unfavorable configuration discharge transitions from I-mode to ELMy H-mode.
  also increases across confinement regime transitions from L to I and H mode, but the time resolution of these measurements are limited to the frequency of NBI blips. The core and edge
  drop at the end of the 5th power step as radiation increases.

Figure 1. Time histories of favorable discharge 41286 (red) and unfavorable discharge 41285 (blue). (a) Shows the ECRH and NBI power which is matched between discharges, (b) shows stored energy ( ), (c) shows the radiated power, (d) shows the core
  from ECE, and (d) shows the edge
  from interferometry. The H-mode transition is observed for the favorable discharge at 2.65 s at the end of the 2nd ECRH power step, while the unfavorable discharge undergoes an H-mode transition in the 4th ECRH power step.
Download figure:
Standard image High-resolution imageThe low and high power L-mode phases were intended to match between the favorable and unfavorable configuration experiments so that direct comparisons of turbulence could be made. Figure 2 shows the electron density  , electron temperature
  , and ion temperature
  profiles from Thomson scattering [36] and charge exchange recombination spectroscopy [37, 38]. The profiles match within the scatter of the data and their error bars. The equilibria are very closely matched, with the exception of the direction of the toroidal magnetic field. Because this study focuses on edge (
 –1.0) turbulence, the edge kinetic profiles are shown in more detail in figure 3 with profile fits made to the data. The fits are modified hyperbolic tangents, made with a Monte Carlo approach varying measurement data within their vertical error bars. In this edge region, the difference in the fits to the profiles is as high as 25% in the steepest gradient region of the edge (
 ), with the favorable discharge having slightly higher values of
  ,
,  , and
, and  than the unfavorable discharge. The difference in the mean of the data between the favorable and unfavorable configurations is similar to the standard deviation of the data at a particular radial location for
  ,
,  , and
, and  .
.

Figure 2. Kinetic profiles of the favorable (red) and unfavorable (blue) configuration discharges during the low power (a)–(c) and high power (d)–(f) L-mode phases from the outer core to separatrix.  (a), (d) and
  (b), (e) measurements are from Thomson scattering and
  measurements are from CXRS. Equilibria of the favorable and unfavorable discharges are shown to overlap closely in (g).
Download figure:
Standard image High-resolution image
Figure 3. Edge kinetic profiles of the favorable (red) and unfavorable (blue) configuration discharges during the low power (a)–(c) and high power (d)–(f) L-mode phases with fits generated with modified hyperbolic tangent functions.
Download figure:
Standard image High-resolution image3. Pedestal fluctuation and  measurements

Pedestal ( –1.0) radiated temperature (
 ) fluctuations were measured with the correlation ECE (CECE) diagnostic [39, 40]. The CECE diagnostic at AUG is a 32 channel radial comb with high radial resolution (2–4 mm) and is sensitive to long-wavelength fluctuations (
 ). Several properties of edge
  fluctuations may be determined from CECE measurements, including the frequency coherence spectra
  , the normalized fluctuation amplitude
  , and the radial correlation length of turbulence. A description of these diagnostic techniques is found in [40]. We report here only on radiated temperature
  fluctuations rather than electron temperature
  fluctuations because of the optically thin nature of edge plasmas. In optically thin cases,
  fluctuations are expected to contribute to the measured
  fluctuations. Because the optical depth is matched between the favorable and unfavorable configuration experiments,
  fluctuations are expected to contribute equally, and side by side comparisons of
  fluctuations may be performed. However, the portion of the
  from
from  fluctuations alone cannot be determined. The radial electric field
  was measured in these experiments using the He II spectroscopy system which uses active spectroscopy of singly ionized helium (He) to measure
  from the pedestal region to the SOL [41].
The development of the WCM can be seen during the L-mode phase of the unfavorable configuration discharge and is studied here for the first time during L-mode phases at low heating power, far from the L to I transition. Figure 4 shows the evolution of the unfavorable configuration CECE coherence spectra near the separatrix and  during a low power L-mode phase (1.65–2.15 s, 0.2 MW ECRH), high power L-mode phase (2.23–2.63 s, 0.6 MW ECRH), and an I-mode phase (3.30–3.55 s, 1.8 MW ECRH). The development of the WCM is seen in the coherence spectra over the course of the discharge, starting as a feature centered at 35 kHz in the L-mode phases and growing in power until the I-mode phase at which point the WCM center frequency increases to 85 kHz. During the I-mode phase, the LFEO can also be seen in the coherence spectra as a narrow-band mode at 7.8 kHz. The LFEO appears only in the I-mode phase of this discharge.

Figure 4. Development of  CECE coherence
  spectra (a)–(c) in the edge (channel 16,
  ) and pedestal
  (d)–(f) over the unfavorable configuration discharge, 41285. The WCM is centered at 35 kHz is present in the
  spectra of both the low and high power L-mode phases, and at 85 kHz during the I-mode phase.
  develops from a weak
  well in the L-mode phases to a moderate well in I-mode. Also shown are the calculated E × B shearing rate at
  , as well as the expected Doppler shift due to the E × B velocity (also measured by HES) at
  for a large-scale mode with wavenumber
  . The black dashed line in (a)–(c) is the CECE statistical limit.
Download figure:
Standard image High-resolution imageThe  profiles are flat in both L-mode phases and a moderate well forms during the I-mode phase, reaching a depth of −14 kV m−1. From the
  profile and the magnetic field, the E × B velocity shearing rate (
 ) is calculated at
  , a location in the outer shear layer. The shearing rate at this position increases between the L-mode and I-mode phases. We also estimate the expected Doppler shifts of turbulent features at
  . The frequency of turbulence captured by CECE is given by
  where
where  is the frequency of the turbulence in the
  frame and
  is the Doppler shift due to the plasma velocity in the poloidal and toroidal directions (vθ
and vφ
) for a turbulent mode with a given poloidal and toroidal wavenumber (kθ
and kφ
). The radial velocity is assumed to be negligible. The
is the Doppler shift due to the plasma velocity in the poloidal and toroidal directions (vθ
and vφ
) for a turbulent mode with a given poloidal and toroidal wavenumber (kθ
and kφ
). The radial velocity is assumed to be negligible. The  term is also neglected here due to the very small toroidal wavenumber expected for turbulent modes. The
  term can be calculated assuming that
  and assuming a turbulent feature with wavenumber
  . This wavenumber is consistent with previously measured values for the WCM at AUG [27, 28]. The shift in center frequency between L-mode and I-mode WCM is consistent with this estimated Doppler shift due to increased
  , although other candidates may exist to explain the difference in frequency of the WCM between L-mode and I-mode such as a change in the drive or nature of the mode, or the coupling between the WCM and the LFEO.
Figure 5 shows the development of the favorable configuration CECE coherence spectra at the pedestal bottom ( ) and
) and  during a low power L-mode phase (1.65–2.15 s, 0.2 MW ECRH), high power L-mode phase (2.23–2.63 s, 0.6 MW ECRH), and the inter-ELM period of an H-mode phase (3.96–4.0 s, 2.2 MW ECRH). The L-mode phases in this favorable configuration discharge are power-matched with the L-mode phases of the unfavorable configuration discharge previously described. The edge kinetic profiles of this favorable configuration discharge match within the scatter of the data as described in section 3. The H-mode of this favorable configuration discharge is not comparable to the I-mode phase of the unfavorable configuration discharge because during H-mode the particle transport barrier is formed and the density increases as compared to L-mode and I-mode. There is no steady-state H-mode phase during the unfavorable discharge for direct comparison with the favorable discharge H-mode.

Figure 5. Development of  CECE coherence
  spectra (a)–(c) in the edge (channel 16,
  ) and pedestal
  (d)–(f) over the favorable configuration discharge, 41286. A structure centered at 35 kHz is present in the
  spectra of both the low and high power L-mode phases as well as the H-mode phase.
  develops from a shallow well structure in the L-mode phases to a deep well in H-mode. Also shown are the calculated E × B shearing rate at
  , as well as the expected Doppler shift due to the E × B velocity (also measured by HES) at
  for a large-scale mode with wavenumber
  . The black dashed line in (a)–(c) is the CECE statistical limit.
Download figure:
Standard image High-resolution imageSpectral features are seen in the coherence spectra centered at 35 kHz in the L-mode phases. We will call these features 'WCM-like' due to the similarity in their frequency range and radial localization in comparison to the unfavorable discharge WCM. A broadband fluctuation also centered at 35 kHz is present during the H-mode phase, reaching a value of coherence of  , nearly as high as the I-mode WCM. The
  profiles display shallow wells during the L-mode phases and a deep well during the H-mode phase of the discharge, reaching −47 kV m−1. The shearing rate
  calculated at
  increases by more than five times between L-mode and H-mode at this radial location. The estimated Doppler shifts of turbulent features at
  due to the calculated E × B velocity for a feature with wavenumber
  increase between L-mode and H-mode as the
  well develops. Despite an increased expected Doppler shift of ∼190 kHz between L-mode and H-mode, the feature does not change in frequency between the two phases. The reason for the difference in the response of this H-mode turbulent feature versus the I-mode WCM to changes in E × B velocity has not yet been determined.
The development of the radial extent of the WCM in the unfavorable configuration discharge and WCM-like feature in the favorable configuration discharge is shown in table 1. The radial extent of the WCM or WCM-like feature,  is calculated by correlating sequential CECE channels spanning increasing radial distance. The radial extent
  is defined as the maximum radial distance between CECE channels for which the WCM or WCM-like feature is apparent in the cross correlation between channels. The WCM peak location is the location at which the WCM or WCM-like feature has the maximum value of
  between neighboring CECE channels. The WCM and WCM-like feature in the unfavorable and favorable configurations respectively share the same radial extent (0.4 cm) and same peak location (
 ) during the low power L-mode phase early in the discharge. During the second L-mode phase at higher power, the WCM and WCM-like feature share a similar peak location in favorable (
 ) and unfavorable (
 ) configurations, but the mode grows to a wider radial extent in the unfavorable configuration (1.8 cm) than the favorable configuration (1.0 cm). During the I-mode phase of the unfavorable configuration discharge, the peak amplitude of the WCM remains at a similar peak location (
 ) as during the L-mode phases and grows to a yet larger radial extent (2.1 cm). The favorable configuration discharge does not have an I-mode phase. During the H-mode phase of the favorable configuration discharge the WCM-like feature's peak location and radial extent could not be clearly determined due to ECE cutoff occurring near the pedestal top. This investigation shows that the WCM and WCM-like feature grows in radial extent during the L-mode phases of both favorable and unfavorable configuration plasmas. The location of the peak of this feature is similar in the favorable and unfavorable configuration L-modes, and remains similar during the unfavorable configuration I-mode phase. This analysis suggests that the WCM-like feature in favorable configuration L-mode is the same L-mode WCM as appears in unfavorable configuration L-modes. The WCM is not limited to the unfavorable configuration and may be observed in the edge plasma even at power levels far below the L to I-mode transition.
Table 1. Properties of the WCM and WCM-like features in the pedestal of the different phases of the favorable and unfavorable configuration plasmas. The feature grows in radial extent over the course of the discharges with larger radial growth occurring in the unfavorable configuration discharge. The location of the peak of the WCM and WCM-like features is the same in both discharges and the L and I confinement regimes. The radial extent and peak location in H-mode cannot be determined due to ECE cutoff near the pedestal top.
| Favorable | Unfavorable | ||||
|---|---|---|---|---|---|

| Peak location |

| Peak location | ||
| Regime | Time (s) | (cm) |
 ) ) | (cm) | ( ) ) |
| L-mode | 1.65–2.15 | 0.4 | 0.984 | 0.4 | 0.984 |
| L-mode | 2.23–2.63 | 1.0 | 0.991 | 1.8 | 0.993 |
| I-mode | 3.30–3.55 | — | — | 2.1 | 0.991 |
A comparison of the matched high power (0.6 MW ECRH) L-mode phases of the favorable and unfavorable configuration discharges reveals important differences in edge plasma properties close to confinement regime transitions. A comparison of the  fluctuation properties and
  across the pedestal in favorable and unfavorable configurations is shown in figure 6. At
  , neither the favorable nor unfavorable configuration discharges display significant turbulent features above the CECE statistical limit,
  . By integrating the coherence spectra, as in [40], the normalized fluctuation amplitude
  may be determined. At this location
  is 0.3% in the favorable configuration and 0.4% in the unfavorable configuration, but both measurements are within error bars of the CECE
  statistical limit of 0.2%. In the steeper gradient region of
  , broadband turbulence can be seen in the CECE coherence spectra, with a higher coherence in the unfavorable case than the favorable case. At this location, the favorable configuration discharge
  while the unfavorable configuration discharge
  . Near the last closed flux surface at
  , the favorable and unfavorable configuration spectra are dominated by the L-mode WCM. Here the favorable configuration discharge
  while the unfavorable configuration discharge
  . In both the favorable and unfavorable configuration plasmas,
  increases from the outer core towards the pedestal bottom, but the increase is larger in the unfavorable configuration than the favorable configuration.

Figure 6. Comparison of the high power L-mode phase prior to confinement regime transitions.  CECE coherence
  spectra in power matched favorable (red) and unfavorable (blue) configuration discharges at three radial positions (a)
  , (b)
, (b)  , and (c)
  show higher coherence in the unfavorable configuration than favorable configuration. A comparison of
  in (d) shows a stronger well formation in the favorable configuration. The fluctuation amplitude
  over radius (e) shows that
  is within error bars of the sensitivity limit at
  , but grows as radius increases and is higher in the unfavorable configuration than the favorable configuration at
  and 0.99.
Download figure:
Standard image High-resolution imageThe differences in  between the favorable and unfavorable cases during the high power L-mode phase is also shown in figure 6. The favorable configuration discharge forms a more significant
  well and region of shear during this L-mode than the unfavorable configuration discharge. This is consistent with previous observations of deeper wells in favorable compared to unfavorable configuration plasmas at AUG and other tokamaks [11–15]. The difference in fluctuation amplitude follows with the difference in
  and E × B shear in these L-mode phases, with the
  well formation in the favorable configuration coinciding with lower pedestal turbulence in L-mode. These measurements show that in power-matched L-modes, turbulent fluctuations are lower when E × B shear is higher in the favorable configuration case compared to the unfavorable case. These differences in turbulence are most apparent near the separatrix where E × B shear is highest, whereas the turbulence amplitude is similar between favorable and unfavorable configurations in regions deeper in the core where shear is expected to be small.
The WCM feature near the separatrix appears to develop in both favorable and unfavorable configuration L-modes. A broadband turbulent feature with spectral properties like the WCM also appears in the inter-ELM period of H-mode. The LFEO only occurs during the unfavorable configuration I-mode. To study the coupling properties of edge  fluctuations, the cross-bicoherence was calculated between neighboring CECE channels near the separatrix (
 ) where the WCM (L-mode and I-mode) or broadband fluctuation (H-mode) is present. For this analysis, the cross-bicoherence
  of two signals X(t) and Y(t) from neighboring CECE channels is given by:
where X(f) and Y(f) are the Fourier transforms of X(t) and Y(t) and frequency coupling is investigated between f1, f2, and  . The CECE cross-bicoherence from L-mode, I-mode, and H-mode phases is shown in figure 7. The L-mode phases of both the favorable and unfavorable discharges do not show any obvious coupling, although only the unfavorable configuration case is shown in figure 7. When the LFEO appears during the unfavorable configuration I-mode, it couples to the WCM, as seen by the coupling between the WCM band of frequencies (70–100 kHz in I-mode) and the LFEO frequency (7.8 kHz). This coupling has previously been studied and the LFEO has been shown to receive energy from the WCM and cause the WCM's frequency broadening [30, 31]. During the H-mode phase of the favorable configuration discharge, the cross-bicoherence shows coupling between the broadband fluctuation range of frequencies (25–60 kHz) and a range of frequencies below 10 kHz. This frequency coupling is more diffuse than the clear WCM–LFEO coupling of I-mode, indicating that the H-mode broadband feature experiences different mode coupling than the I-mode WCM. Bicoherence analysis shows only frequency coupling and does not provide information about energy transfer, but this coupling is a prerequisite for energy transfer.
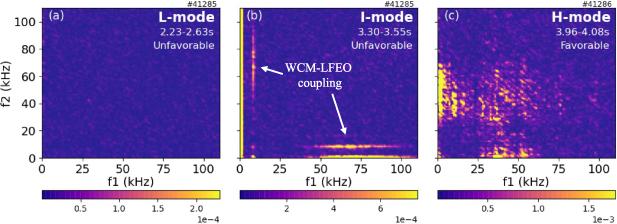
Figure 7. Cross-bicoherence of neighboring CECE channels at  during (a) unfavorable configuration L-mode, (b) unfavorable configuration I-mode, and (c) favorable configuration H-mode phases. The L-mode phase shows no coupling. The I-mode phase shows coupling between the WCM range of frequencies (50–100 kHz) and the LFEO frequency (7.8 kHz). The H-mode case shows diffuse coupling between the WCM-like feature range of frequencies (25–60 kHz) and low frequencies (
 10 kHz). In all cases FFT bins of 4096 were used and 781, 488, and 238 overlapping ensemble averages used in L, I, and H mode respectively.
Download figure:
Standard image High-resolution imageThe localization of the LFEO, WCM, and the coupling between these two modes can be determined through CECE  spectra and bicoherence analysis. Figure 8 shows the maximum value of the CECE coherence in the LFEO and WCM range of frequencies over the radial ranges where these features exist. The LFEO and WCM have a peak amplitude at the same radial location near
  . The WCM amplitude is nearly as high slightly farther inside near
  , but it is significantly lower inside
  . The LFEO is visible over a slightly larger radial region than the WCM, extending to
  . The degree of coupling is shown in figure 8(c) and is determined by calculating the maximum of the cross-bicoherence between neighboring CECE channels in the region of frequency coupling between the WCM and LFEO. The coupling is maximum at the location where the WCM and the LFEO have the maximum amplitude, but falls off with radius more sharply than the WCM or LFEO coherence values fall off. This peak in coupling occurs in the outer E × B shear layer. This analysis suggests that the LFEO–WCM coupling is a highly localized process and that the WCM drive, LFEO drive, and the coupling between these modes is sensitive to properties near the separatrix. However, it is important to note that the minimum of the
  well is subject to an uncertainty in location of
  during this plasma phase, and the mapping between the peak in coupling and
  deserves further study.

Figure 8. LFEO and WCM localization and coupling during the I-mode phase of the unfavorable configuration discharge. (a) Shows the maximum value of coherence of the LFEO over radius and (b) shows the maximum value of the coherence of the WCM feature over radius. (c) Shows the the maximum value of the coupling calculated from the cross-bicoherence between neighboring CECE channels in the LFEO–WCM coupling range of frequencies.
Download figure:
Standard image High-resolution image4. Discussion
In this paper we investigated edge turbulence in favorable and unfavorable magnetic configurations in power-matched L-modes and after confinement regime transitions to I-mode and H-mode. We find that the WCM develops in both the favorable and unfavorable configuration L-modes, but has a higher coherence  and a larger radial extent in the unfavorable configuration than the favorable configuration in the higher power L-mode phase close to confinement regime transitions. The unfavorable configuration discharge undergoes a confinement regime transition to I-mode, during which the WCM shifts to higher frequency, grows in coherence and radial extent, and couples with the LFEO. The favorable configuration discharge undergoes a confinement regime transition to H-mode. During an inter-ELM period of the H-mode phase, a broadband fluctuation feature appears at the same location as the L-mode WCM.
These measurements hint that a difference in the balance of turbulence drive and damping in the pedestal plays into the difference in the L to H transition between the favorable and unfavorable magnetic configurations. During the matched high power L-mode phases, which are close to confinement regime transitions, differences are observed in  and the associated E × B flow shear. The higher shear in the favorable configuration indicates stronger turbulence damping. Differences in
  turbulence correlate with this difference in damping, with CECE measurements showing higher coherence turbulent structures in frequency spectra and higher pedestal fluctuation amplitude in the unfavorable configuration discharge as compared to the favorable configuration discharge. These differences in
  turbulence occur in the regions of differences of E × B flow shear, while at the pedestal top there is little difference between the favorable and unfavorable configuration
  turbulence.
In addition to matched L-modes in favorable and unfavorable configurations, the measurements in this paper indicate the possibility of different balances of turbulence drive and damping just inside the separatrix across L, I, and H-modes. Properties of the plasma near the separatrix at  , are shown in figure 9. This is the region where the outer E × B velocity shear layer forms during I-mode and H-mode. The normalized inverse
  gradient scale length
  (panel (a)) matches closely between the favorable and unfavorable L-mode, and increases across the L to I and L to H transitions. The E × B velocity shear (panel (b)) correlates closely with
  . This is expected because both
  and
and  are related the temperature gradient. During the matched L-mode phase, the shear in the favorable configuration is higher than the shear in the unfavorable configuration. The
  fluctuation amplitude (panel (c)) also increases across the L to I and L to H transitions in this region. This increase occurs as both the gradient drive and the shear increase across confinement regime transitions. In the matched L-mode phase, the
  fluctuation amplitude is lower in the favorable configuration, where
  is comparable to the unfavorable configuration but the E × B velocity shear is higher. Across the confinement regime transitions, both the gradient drive and the shear damping mechanisms for turbulence increase, but this increase is more marked across the L to H transition than across the L to I transition. The resulting state of turbulent fluctuations in I-mode and H-mode is a result of a complex balance of this drive and damping.

Figure 9. Properties near the separatrix ( ) for during high power L-mode (both favorable and unfavorable discharges), I-mode (unfavorable only), and H-mode (favorable only) phases. (a) Shows the inverse
  gradient scale length normalized to minor radius, (b) shows the E × B velocity shear, and (c) shows the
  fluctuation amplitude. All quantities increase between L-mode and higher confinement modes (I and H). Electron temperature gradient and shear increases more from L to H-mode than from L to I-mode, while fluctuation amplitude increases more from L to I-mode than from L to H-mode.
Download figure:
Standard image High-resolution image
The pedestal  fluctuations presented in this paper have been associated with the WCM in the unfavorable configuration L-mode and I-mode, and the favorable configuration L-mode. The direction and amplitude of electrostatic heat and particle transport are determined by density, temperature, and potential fluctuation amplitudes in addition to the phase relationships between these fluctuating quantities. Therefore, we cannot quantify the transport caused by the WCM in these experiments, based on the measurement of
  fluctuations alone. Nonetheless, the observation of pedestal fluctuations is valuable, because a change in turbulence between different regimes and configurations (e.g. favorable L-mode vs unfavorable L-modes) indicate that turbulent-driven transport has changed.
The observation of significant  fluctuations in the H-mode pedestal may seem to contrast with the conventional picture of reduced ion-scale turbulence in the H-mode pedestal due to increased E × B flow shear. However, as previously noted, these
  measurements alone are not enough to quantify turbulence-driven transport. The I-mode WCM is known to exist in plasmas that have significant E × B flow shear with
  wells that can reach nearly as deep as H-mode
  wells. The WCM may, therefore, sit at the bottom of the
  well where the shear is zero, or may be driven by a type of instability insensitive to
  . I-modes also can have energy confinement quality approaching H-mode levels, so the existence of the WCM does not drive enough energy transport to negatively impact confinement quality. The identity of the H-mode broadband fluctuation feature is still under investigation, but the I-mode WCM demonstrates that significant pedestal fluctuations can exist in high energy confinement plasmas.
The differences in the three-wave coupling observed between L-mode, I-mode, and H-mode regimes indicates possible differences between the regimes in the exchange of energy between broadband pedestal fluctuations and turbulence-regulating mechanisms. The WCM–LFEO coupling, observed in bispectral analysis shown in figure 7, is unique to I-mode. When coupling is present, energy transfer between modes is possible. The WCM and GAM (or LFEO) have been shown to exchange energy in I-mode [30, 31]. The transfer of turbulence energy to ZFs rather than GAMs is also thought to be important in the L to H transition [34, 35]. In L-mode, no frequency coupling is observed in bispectral analysis, indicating that energy transfer is not occurring. One speculation for the differences in coupling between I-mode and H-mode in figure 7 is as follows: in I-mode, the transfer between the WCM and LFEO is dominant, while the transfer of energy to ZFs is subdominant. Energy transfer between the WCM and the LFEO preferentially to ZFs could act to prevent the transition to H-mode. In H-mode, the transfer of energy from turbulence to ZFs dominates, and ZFs are driven strongly enough that a transport barrier and the H-mode regime are sustained. The role of the I-mode LFEO in aiding the overall turbulence shearing rate or turbulence energy flow, and thereby the LFEO's role in reducing or enhancing the turbulence-driven transport, is an important point for future study.
The coupling between the LFEO and WCM in I-mode is found to be highly localized, with the maximum value of the coupling as determined by bicoherence analysis occurring at the same radial location as the LFEO has peak amplitude in coherence  . The I-mode confinement regime is the only phase during the presented favorable and unfavorable discharges in which the WCM experiences a frequency upshift to be centered at 85 kHz. Although the change in frequency between the unfavorable configuration L-mode and I-mode would be consistent with a Doppler shift of a WCM-scale mode due to increased
  , the changes in frequency of pedestal fluctuations with
  in the favorable configuration discharge are less straightforward. For example, the L-mode WCM is centered at 35 kHz in both favorable and unfavorable configuration discharges despite differences in
  between favorable and unfavorable L-modes. There is also no change in center frequency between the favorable L-mode WCM and the H-mode broadband fluctuation, despite a significant difference in
  . This indicates that the H-mode broadband fluctuation has a different nature than the I-mode WCM.
Other candidates exist to explain the frequency shift between the L-mode and I-mode WCM. It has been suggested previously that LFEO–WCM coupling causes the frequency broadened structure of the WCM [30, 31]. It is also possible that this coupling plays a role in determining the WCM center frequency in I-mode. Another explanation for the difference in frequency shift of the WCM in the favorable configuration as compared to the unfavorable configuration could be related to a difference in the three-dimensional nature of the edge turbulence in the different magnetic configurations. In calculating expected Doppler shift of the WCM, an assumption of long toroidal wavelength was made. If the toroidal wavelength is instead small enough for the  term in the
  Doppler shift to be significant, then differences in toroidal flows between favorable and unfavorable configurations could contribute to differences in WCM frequency shift. Determining the toroidal structure of the WCM requires further measurement.
These edge turbulence observations in power-matched favorable and unfavorable configuration plasmas point to the importance of the turbulence in the confined region of the plasma in the difference in power thresholds between magnetic configurations. Some previous studies have measured fluctuations in the SOL and just inside the last closed flux surface using probes, and found that important differences such as propagation direction exist in the turbulence of favorable and unfavorable configuration discharges [18]. Edge turbulence studies of the confined region show important differences in turbulence poloidal group velocity and turbulence-driven flow in favorable and unfavorable magnetic configurations prior to L to H transitions [12, 42]. The comparative measurements shown here demonstrate that differences in amplitude of turbulence can also occur deep in the confined region, in particular the important region where barrier formation takes place upon confinement regime transition,  –1.0. This work does not consider SOL turbulence measurements and cannot resolve in time when turbulence changes at difference locations.
This work motivates the need for further study across confinement regime transitions in favorable and unfavorable configurations. Further investigation is needed to fully understand broadband fluctuations in the H-mode pedestal in order to determine what conditions lead to the H-mode WCM-like feature, and if comparable favorable and unfavorable configuration discharges have comparable pedestal fluctuations. The unfavorable configuration discharge studied in this paper did not a have steady-state H-mode phase for turbulence analysis, so this is left for future work. In addition, time-resolved studies that couple pedestal fluctuation measurements (e.g. from CECE) with SOL measurements (e.g. from probes) would better uncover the temporal and spatial relationship between changes in SOL fluctuations and confined region fluctuations across confinement regime transitions.
Acknowledgments
This work has been carried out within the framework of the EUROfusion Consortium, funded by the European Union via the Euratom Research and Training Programme (Grant Agreement No. 101052200—EUROfusion). Views and opinions expressed are however those of the author(s) only and do not necessarily reflect those of the European Union or the European Commission. Neither the European Union nor the European Commission can be held responsible for them. This work was also supported by the US Department of Energy under Grants DE-SC0014264, DE-SC0006419, and DE-SC0017381.