


Abstract
For more than a decade, an unprecedented predict-first activity has been carried in order to predict the fusion power and provide guidance to the second Deuterium–Tritium (D–T) campaign performed at JET in 2021 (DTE2). Such an activity has provided a framework for a broad model validation and development towards the D–T operation. It is shown that it is necessary to go beyond projections using scaling laws in order to obtain detailed physics based predictions. Furthermore, mixing different modelling complexity and promoting an extended interplay between modelling and experiment are essential towards reliable predictions of D–T plasmas. The fusion power obtained in this predict-first activity is in broad agreement with the one finally measured in DTE2. Implications for the prediction of fusion power in future devices, such as ITER, are discussed.
Export citation and abstract BibTeX RIS

Original content from this work may be used under the terms of the Creative Commons Attribution 4.0 license. Any further distribution of this work must maintain attribution to the author(s) and the title of the work, journal citation and DOI.
1. Introduction: motivation for DTE2 predictions
The predictive capability of Deuterium–Tritium (D–T) plasmas is essential, as it is required for the correct evaluation of the fusion power expected in ITER and the future tokamak reactor, in order to correctly assess the potential of fusion as commercial energy production. Furthermore, the fact that in tokamak devices with a high production of fusion power the high neutron fluence might have a significant impact on the activation of the Plasma Facing Components motivates the necessity of reliable predictions for fusion power.
Reliable predictions for D–T plasmas are a challenge as most of the plasmas currently produced are in D, which largely prevents the validation of models using plasmas containing T. Such difficulty is a serious drawback as it was shown during the first D–T campaigns ever produced in TFTR and JET that compared to D plasmas, substantial differences on plasma confinement, transport or Magnetohydrodynamic (MHD) activities were found [1, 2]. Therefore, developing models capable of correctly explaining differences between D and D–T plasmas is a necessity towards reliable predictions of fusion energy.
In addition to reproduce differences in the physics behaviour between D and D–T plasmas, plasma models must retain a sufficient capability of predicting plasmas beyond the conditions in which they can be validated, i.e. they must have some extrapolation capabilities. This is an essential characteristic as future tokamak devices might not work in operational conditions similar to present day tokamaks. One key element that plays an essential role on verifying that extrapolability of models is well captured, is the use of first principle codes that are able to retain the fundamental physics and which simplified models can be compared to. It is worth to stress here that the requirement of good extrapolability was identified as essential. This is because the JET plasma conditions by 2010 were quite different from the ones expected in DTE2 as numerous machine upgrades were going to be conducted before D–T. For instance, the compatibility of high performance scenarios with the ITER-Like Wall (ILW) [3] had to be fully demonstrated experimentally and more Neutral Beam Injection (NBI) power was expected. All this means that plasma conditions and hence optimum operational scenarios in D–T were expected to be different from those available by 2010.
The second D–T campaign at JET, DTE2 [4–6], has provided a key testbed for evaluating the prediction of D–T plasmas before ITER goes to D–T operation. In order to profit from such a unique opportunity, and in parallel to the experimental programme, a strong modelling activity was initiated in JET by 2008. In such an important activity, two phases can be distinguished. A first phase, before starting the D–T experimental campaign, in which a dedicated 'predict first' effort was carried out in order to predict the fusion power that might be generated in different JET plasmas configurations [7, 8]. In a second phase, after the D–T campaign, a detailed comparison between models and D–T data would serve for the validation of models with the aim of refining their reliability [9]. This paper covers the activity performed during the 'predict-first' activity before the JET D–T campaign.
The 'predict-first' activity has been a challenge as fusion power prediction involves multiple physics. The thermonuclear fusion reaction rate requires kinetic profiles prediction, and it needs heating and transport models including the pedestal. Notably, fusion power is particularly sensitive to some plasma parameters e.g. density and temperature, such that small uncertainties in the predicted value of these parameters can result in larger uncertainties in the predicted fusion power. Beam-thermal neutron rate requires a NB heating model including slowing down and fast ion orbits. JET discharges also have Ion Cyclotron Resonance Heating (ICRH). The increase in the beam-thermal neutron rate by the beam-RF synergy should also be taken into account. These indicate fusion power calculation could largely depend on the models used, being subjected to uncertainties.
In parallel to the evaluation of fusion power in DTE2, the predict-first activity also aimed at providing guidance to the scenario developers in order to find an operational domain for maximising fusion power generation in D–T and identify intrinsic differences between D and D–T plasmas. This was an important activity, as it was critical to avoid relying on physical mechanisms that enhance D–D fusion neutron generation but might not be significant in D–T.
This activity, which expanded over more than a decade, has evolved in parallel to the increasing complexity of the physical models and with the increasing computational capabilities in the fusion community. Therefore, the use of first principle modelling, which has become more available nowadays, has enormously benefited the verification of simplified models, allowing for finer tuning and improvement. However, some physical mechanisms in tokamak plasmas are still far from being understood and the use of first principle modelling is not widely available yet. The predict-first activity carried out at JET in view of DTE2 predictions has been performed by using different modelling approaches, e.g. from first principle to phenomenological models, with the aim of covering a wider range of prediction of the possible results and finding potential discrepancies. In particular, integrated modelling, necessary to give a final answer about fusion power, has been performed using different suites of codes and models, avoiding relying on a single code that could lead to misleading results.
The strategy followed to predict the fusion power in DTE2 has evolved in time from the initial moments in ∼2008, in which extrapolations with scaling laws were produced in parallel to incipient integrated modelling simulations, to more sophisticated first principle modelling by the end of this exercise. In general, once it was clear that scaling laws were not fully adequate to extrapolate JET plasmas from ∼2008 to D–T, as it will be shown in section 2, a more detailed strategy for computational modelling was established.
In general, the physics understanding, modelling validation and extrapolation methodology used for DTE2 can be summarised as follows [10]:
- Validation of models on existing D plasmas.
- Verification of a minimum extrapolation capability with existing D plasmas when changing power, Ip and Bt.
- Verification of the extrapolation strategy with future D plasmas. Extension to H and T campaigns to test impact of isotope mass.
- Close the 'gap' with respect to D–T physics: validation of models with the first D–T campaign at JET (DTE1) and future isotope experiments in H and T.
- First-principle modelling supporting the extrapolation strategy.
- Assess the transferability of JET results to ITER plasmas.
This strategy was applied to several physics aspects in plasmas, e.g. core heat and particle transport, pedestal characteristics, heat and particle sources, neutron generation and integrated scenario development.
This paper gives a review of the activity performed and will provide a series of lessons learnt during these years. The knowledge obtained is important in order to predict other D–T campaigns such as the one expected in ITER.
The paper is organised as follows. In section 2, the initial D–T extrapolations performed are shown. The ICRH and the pedestal modelling are shown in sections 3 and 4 respectively. The integrated modelling activities are summarised in section 5. The analyses of the neutron rate predictability are shown in section 6. First principle activities in support of the extrapolation are explained in section 7. The final comparison of the predicted D–T fusion power and the results in DTE2 are discussed in section 8. Finally, a summary and conclusions are discussed in section 9.
2. Initial efforts: scaling laws vs integrated modelling
At the time when the predict-first activity for DTE2 started, ∼2008, the integrated modelling field was an incipient activity that was being developed as a new tool for the interpretation and prediction of plasmas, notably for ITER and DEMO. Several codes were being developed and a strong benchmark activity was being carried out [11–19]. In parallel to these newly developed efforts, the use of scaling laws, in particular the IPB98(y,2) [20], to project present day plasmas to those anticipated in future tokamak devices was widely used. Therefore, during the initial phases of the predictions for DTE2, a mixture of integrated modelling and scaling law was used. Consequently, several prediction comparisons were performed using both approaches.
Both the baseline, at βN ∼ 2, q95 ∼ 3 with thermal energy confinement ratio over the one predicted by the IPB98(y,2), i.e. H98(y,2)∼ 1.0, and the hybrid scenarios, typically with βN > 2.5, q95 > 3 and H98(y,2)> 1.0, were studied. One of the key activities in which the focus was stronger was the extrapolation of the hybrid scenario. The reason was that, at that time with the C-wall, hybrid scenarios at JET were capable of achieving stable H98(y,2)∼ 1.3 at βN ∼ 3 using a plasma current overshoot technique to form a q-profile with the q value at the magnetic axis close to unity and a wide region of low magnetic shear in the plasma core at the start of the main heating phase [21]. These good results were obtained at plasma current Ip = 1.7 MA and toroidal magnetic field Bt = 2 T, q95 = 4 with a total input power of 17 MW. The fact that a high Ti was obtained in the plasma core at this high beta suggested that high fusion power could be obtained in DTE2. Therefore, the predict-first activity should answer what would be the optimum plasma configuration for a hybrid scenario when 40 MW of input power would be available in DTE2.
Two D plasmas obtained during the 2008–2009 JET experimental campaigns were selected as reference plasmas for extrapolation to D–T. These plasmas have good confinement and stability. The two hybrid plasmas considered were heated using NBI only. The first plasma was #75225 (1.7 MA/2 T) [21] with low triangularity (δ), low density and high ion to electron temperatures Ti/Te ∼ 1.8. The second plasma was #77922 (1.7 MA/2.3 T) with high δ, high density and modest Ti/Te ∼ 1.3 [22]. Such shots were chosen as potential reference hybrid candidates for DTE2.
A first extrapolation to higher Ip and Bt, was performed by assuming the following procedure [7]:
- The toroidal field is increased with Ip (i.e. constant q95) up to Bt = 4 T, then Ip is increased at fixed Bt = 4 T.
- The following quantities are conserved from the interpretive simulations of the reference plasmas:
- plasma flux surface geometry
- ne, Te, Ti profile shapes, including the Ti/Te ratio
- Zeff & impurity composition.
- The electron density (ne) is scaled to either:
- maintain ne/nGreenwald constant (with nGreenwald the Greenwald density)
- maintain ne constant.
- The power is scaled to maintain βN until the power limit is reached assuming 34.8 MW of NBI plus 5.2 MW of extra heating by ICRH.
- The temperature is scaled to maintain H98(y,2).
- No credit is taken for α-heating power in order to be conservative. The alpha heating power (a few MW as one-fifth of the fusion power) would be small compare with the external heating power.
- The NBI [23] specifications for D–T are used:
- deuterium beams from the Neutral Injector Box (NIB)-4 with Energy, Eb = 124 keV, and maximum power Pmax = 16.1 MW
- tritium beams from NIB-8 with Eb = 118 keV, Pmax = 18.7 MW.
The D–T fusion power, Pfus, was calculated with the code JETFUSE and it is shown in figure 1 for different Ip values. The JETFUSE code estimates the neutral beam deposition using a single, zero-width 'pencil' in the plasma equatorial plane to represent the trajectory for the entire NBI system. The singularity generated at the magnetic axis is resolved by spatial smoothing of the particle deposition profile near the plasma centre. The fast ion slowing-down is calculated assuming the thermal ions are motionless and neglecting fast ion pitch-angle and orbit effects. The beam-target and thermal fusion reactions are calculated following [24, 25] respectively.
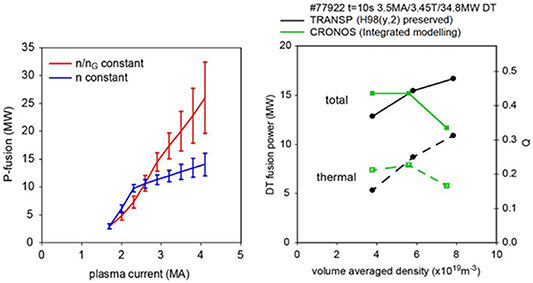
Figure 1. D–T fusion power Pfus (P-fusion in left figure) calculated with JETFUSE and the scaling strategy with different assumptions for the density extrapolation. The error bars cover the range due to extrapolations from three conditions from the two reference pulses, #75225 at t = 6.5 s and t = 8 s and #77922 at t = 10 s. Figure from [7] (left). Reproduced with permission from [7]. Comparison between Pfus and Q calculated with TRANSP from an extrapolation of the discharge #77922 preserving H98(y,2) and with the fully predictive simulation using CRONOS and BGB model for heat transport as a function of volume-averaged density (right).
Download figure:
Standard image High-resolution imageClearly, the fusion power increases with Ip but there is a strong dependence on the density at high current. If ne/nGreenwald was constant, which means that the density increases with Ip as usually obtained experimentally in H-mode type-I ELMy plasmas, the fusion power would increase almost linearly with Ip. However, if the density is assumed constant, the fusion power at high Ip would be always below 15 MW. Interestingly, both approaches give similar fusion power results at medium current ∼2.5 MA, Pfus = 10 MW at 40 MW of input power.
Extra efforts were devoted by means of integrated modelling using the codes TRANSP [26] and CRONOS [27]. One of the key elements of such simulations would be to clarify the role of the density on the hybrid scenario at higher Ip and Bt.
In the case of TRANSP, no predictive simulations were performed but a scaling procedure was used. The high triangularity hybrid reference case (#77922 at t = 10 s) was used. The plasma current and toroidal magnetic field were set conservatively at a ratio of 3.5 MA/3.45 T and the heating was modelled only from neutral beams with the maximum expected maximum combined D & T NBI power of 34.8 MW. The density, temperature and toroidal rotation profiles were conserved with the temperature being scaled to keep H98(y,2) constant. The density was scaled to three values to provide a coarse density scan assuming:
- ne conserved (low density)
- ne/nGreenwald conserved (high density)
- intermediate density with (∼1.5 times the density in the reference plasma)
Following this procedure, the fusion power and fusion gain, Q, obtained for different densities are shown in figure 1 (right). The increase of Pfus is again positive with the density, reaching values of Pfus > 15 MW at very high density. This means that high current, according to these results, would be favourable for the hybrid scenario. However, one key element that was clear from TRANSP simulations was that the NBI penetration was very different in different densities. In order to address the role of NBI power deposition, predictive modelling, at least for the electron and ions temperatures, was necessary. This was done with the CRONOS code performing self-consistent simulations for heat sources (not including alpha heating power) and heat transport. The fusion power was calculated with JETFUSE at a post-processing level and used for the temperature calculation. The model Bohm-GyroBohm (BGB) [28] was used for the heat transport and the densities used were the same one used in TRANSP. In this case, the output in terms of Pfus was quite different as there is an optimum point that provides the maximum Pfus at medium density, which significantly drops at higher densities. Once again, the impact of the NBI penetration was critical in order to have high core temperatures, notably Ti. At high densities, the penetration of the NBI was very poor resulting on a lack of core heating and the impossibility to reach high beta, which is characteristic of the hybrid scenarios.
These results were suggesting that an optimum in plasma current could be possible for the hybrid scenario if ne/nGreenwald was preserved. However, it was still a concern that, at least for the hybrid scenario, different approaches in the extrapolation techniques were giving significant differences on Pfus. This was an issue in order to better guide experiments with improved estimation of Pfus. In the particular case of the hybrid scenario, the role of beta, Ti/Te or rotation on the plasma confinement had to be understood in order to evaluate how such mechanisms extrapolate to higher Ip, Bt and power and also to D–T. Similar concerns were raised for the baseline and advanced scenarios. Therefore, even if the semi-empirical extrapolation activities continued [29], it was clear that more sophisticated analyses and extrapolation methodologies were also needed in order to more clearly understand the JET capabilities to produce high Pfus in plasmas closer to ITER conditions.
The physics topics that were specifically addressed in such a strategy involved all the main elements that had an impact on determining Pfus, i.e. heat sources (ICRH and NBI), heat and particle transport, pedestal temperature and density and neutron generation. The details of the modelling performed will be shown in the following sections.
3. ICRH modelling
ICRH is a well-established auxiliary heating mechanism that is envisaged as one of the key plasma heating mechanisms for ITER. As ICRH can accelerate ion species and produce localised bulk ion and/or bulk electron heating, the applicability and impact of ICRH goes beyond its initial purpose, i.e. plasma heating [30]. The ions accelerated by the electromagnetic waves can reach very high energies and have a strong impact on several physics aspects as shown in JET, e.g. controlling central impurity accumulation, sawtooth frequency control or reduction of instabilities leading to turbulence such as the Ion-Temperature-Gradient (ITG) [31–37]. Therefore, understanding the broad impact of ICRH on D–T was important, notably in order to distinguish its effects from potential alpha particle effects in D–T plasmas.
In this section, the focus is given to the D–T prediction modelling of ICRH and the understanding about the differences of ICRH characteristics between D and D–T plasmas. In particular, the efforts have been devoted to predict the plasma heating characteristics of different ICRH schemes in a D–T plasma, and its role in the fusion performance. Several ICRH schemes have been used during the D, T and D–T campaigns at JET. It is important to mention that a new ICRH scheme was studied and developed during recent years, the three-ion scheme [38, 39]. All these scenarios, such as different approaches of the three ion scheme or inverted schemes, have their own relevance and application purpose. In this paper, a review of each of these scenarios is out of the scope and the focus is given on H and 3He minority schemes instead, which both delivered satisfactory results during DTE1 [40, 41]. The rationale for this is that these schemes have been the ICRH workhorse schemes for the hybrid and baseline high-performance scenarios and most of the D–T prediction effort has been devoted to these. We notice that ITER's main ICRH scheme is planned to be 3He minority during the non-activation phase while 2nd T harmonic scheme during ITER's activation phase. In addition, the unbalanced ratio between bulk deuterons and tritons is also assessed.
As this study focuses on D–T prediction, we will refer to H minority as the  scheme, as D is resonant through the 2nd D harmonic resonance, T is also resonant through the 3rd T harmonic resonance but it is typically much smaller as compared to H and D and can be neglected in most cases [42]. The 3He harmonic will be referred to as
  as T is resonant through the 2nd T harmonic resonance. It is important to mention that these schemes achieve high-performance conditions by different means. On the one hand, the
  scheme is characterised by providing good H and D absorption, having strong D absorption is beneficial as it promotes a stronger D velocity distribution tail which typically leads to an increase of fusion reactions. On the other, the
  scheme shows a particularly strong absorption on 3He which leaves small power to T except at low (<∼1%) 3He concentrations. As 3He has a large atomic mass A = 3, its critical energy of fast ions, at which bulk ions and electrons are heated at equal rates, is substantially higher than that of H which allows this scheme to feature strong bulk ion heating. Therefore, the
  scheme relies on the power being channelled to D while the
  scheme relies on strong bulk ion heating to achieve high-performance conditions to impact the fusion performance.
Several studies along these years have been focused on identifying the capabilities of these schemes and, also, under which minority concentration range their key features are maximised. In general terms, the strategy followed has been to identify high-performance discharges from the JET campaigns and, after a validation process, perform a D–T prediction. The main figures of interest have been the wave absorption by the different ion species, the collisional power, the ICRF fusion enhancement and the predicted fusion power. Several codes have been used to achieve this goal: PION/PENCIL [43, 44], TRANSP/TORIC [45] and ETS/CYRANO [46, 47]. All these codes take into account the ICRH + NBI synergy, i.e. the velocity kick experimented by the NBI fast ions due to the ICRH wave.
3.1. H and 3He minority prediction
One of the first attempts to assess these schemes' role in D–T was with a fusion record D hybrid discharge performed in 2014, 86 614 [10]. This discharge consisted of two phases, a high-performance and a low performance one due to impurity accumulation and MHD activity. The main plasma parameters of the discharge were  and
and  . The toroidal magnetic field was set to
  and the plasma current
  . The ICRH scheme was hydrogen minority with resonant frequency
  . The modelling of this discharge was performed with JETTO/PION and PION/PENCIL, obtaining an excellent agreement between the experimental and simulated neutron rates. The JETTO/PION package allows to model the transport which became relevant in this particular set of simulations to predict the ion temperature in the H scheme and, specially, in the 3He scheme. On the other hand, the PION/PENCIL allows to assess the main plasma heating aspects but it does not model the transport, as for the scan in plasma parameters reported here it was not necessary. Several simulations in D with 4% concentration of H and 3He as minority schemes (notice that 3He was added to the D plasma for the purpose of the modelling work) were performed with JETTO/PION with predictive temperature using a BGB model [42, 48]. These simulations showed that the
  scheme schemes (notice that 3He was added to the D plasma for the purpose of the modelling work) achieved higher ion temperature as stronger bulk ion heating was obtained as compared to that from the
  scheme. As a continuation to these results, a 50:50 D–T prediction was undertaken using interpretative simulations with PION/PENCIL including the resonance on T as
  . The D–T prediction was performed by modelling 50% of the bulk D as T, and 50% of the D beams as T beams. A steady-state was assumed for these simulations, i.e. plasma parameters such as density and temperature were considered constant. The simulation evolves until a steady-state solution for the velocity distribution function of the resonant particles is found [42]. The goal was to understand whether these schemes would show reliable performance within the plasma parameter space considered (density and temperature, see figure 2). For this reason, the ion power absorption and collisional power were assessed. It was shown that strong ion power absorption was predicted, ranging from 60%–87% and 73%–90% for H and 3He, respectively. Furthermore, ion-ion (slowing down of the accelerated minorities onto bulk ions) collisional power was strong in both cases, from 57%–70% and from 74%–85% for H and 3He, respectively. Note that the
  scheme shows stronger ion-ion collisional power as compared to the
  scheme, as obtained in D main-ion simulations, which shows that higher ion temperature could be expected in the presence of 3He both in D and D–T.

Figure 2. Contour lines of normalised collisional power from resonant minority ions to thermal ions for NBI and NBI + RF to total RF input power (6 MW) and beam power (17 MW) in % for a minority concentration of 5%, (left) H minority and (right) 3He minority. Reproduced courtesy of IAEA. Figure from [42]. © EURATOM 2018.
Download figure:
Standard image High-resolution imageSuch studies continued in campaigns that are more recent. Two independent modelling efforts found similar results for the prediction of the baseline discharges 92 436 [49] and 96 482 [50, 51], respectively. Predictive simulations in temperature ( for the H scheme and
  for the 3He scheme) for a 50:50 D–T prediction of 92 436 were achieved using ETS/CYRANO. It was found that both schemes
  and
and  , obtained similar fusion power, ranging from 11 to 13 MW depending on the minority concentration, for 39 MW of input power. However, the
  scheme shows a mild maximum around 2% of minority concentration, while the fusion power with H minority scheme is maximised when there is no H minority (0%), as harmonic heating scales with temperature and density (2nd D harmonic in this case). This result is in line with what has been stated previously, that 3He produces more bulk ion heating, i.e. increasing Ti, while the H minority scheme tends to deliver more power to D by means of the 2nd D harmonic. In figure 3, this is clear from the middle plot, where bulk-bulk reactions maximise around 2% 3He concentration and beam-target reactions in the H case are higher as compared to the beam-target reactions in the 3He case (right plot).
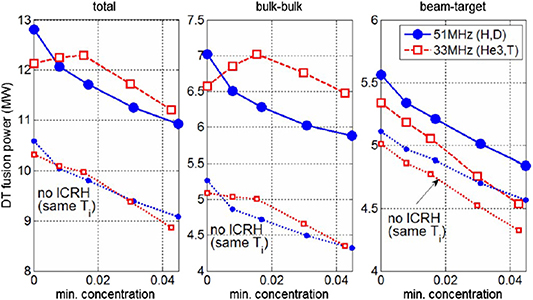
Figure 3. Fusion power components (total, bulk-bulk and beam-target) for  and
and  schemes. The dotted lines correspond to simulations with no ICRH but keeping the same plasma temperatures as predicted with ICRH. Horizontal axes are concentration ratios of minority ion (H or 3 He) density to electron one. Reproduced courtesy of IAEA. Figure from [49]. © EURATOM 2021.
Download figure:
Standard image High-resolution imageFor the discharge 96 482 50%–50% D–T prediction, PION/PENCIL modelling was performed assuming steady state conditions, 34.5 MW of input power and no transport modelling was considered. In this case, the predicted fusion power obtained ranged between 9 to 12.5 MW depending on the minority concentration considered. This result showed a similar trend with increasing minority concentration and a similar fusion power range as that in figure 3, despite of the modelling of different baseline reference discharges. In addition, the focus of this work was to understand where the key features of  and
and  are optimised. It was found that H minority concentrations should stay below 2.2% and 3He minority concentrations beyond 1.2% (see the gray circle in figure 4). The reason is that for H concentrations lower than 2.2%, 2nd D harmonic becomes dominant which is beneficial to increase the number of fusion reactions. For 3He, it must stay beyond 1.2% of concentration to have a stronger bulk ion heating as compared to H. This result is in particularly good agreement with what is shown in figure 3. However, high 3He concentrations might lead to some undesirable effects affecting the fusion power production. This is certainly the case of the dilution of 3He ion on D–T ions. As shown in figure 3, a maximum of fusion power is obtained at 1.75% 3He concentration and beyond that, fusion power decreases in spite of the fact that higher ion heating is obtained.

Figure 4. ICRH power absorption for H (a) and 3He (b) concentration scan in a D–T prediction of baseline discharge 96 482. The rightmost plot shows the ICRH collisional power for both H and 3He. Reproduced from [50]. © 2022 Centro Nacional de Supercomputación. All rights reserved.
Download figure:
Standard image High-resolution imageThe previous analyses motivated experiments with 3He in order to test the  scheme performance. These experiments tested a concentration range of 3He from 0 to 8%. Good fusion performance was obtained together with good bulk ion heating and high Ti [52], although as it happens in H minority scheme plasmas, central impurity accumulation control is generally an issue. In general, higher Ti were obtained as compared to the
  scheme, a result that has also been found in DTE2 [53]. More importantly, the best experimental performance was obtained around ∼2% of 3He concentration which is in line with the results presented here. Above mentioned negative impacts (e.g. fuel dilution and/or impurity accumulation) of higher 3He concentrations on fusion performance were also observed.
Regarding ICRH fusion enhancement, it was found to be systematically lower in D–T as compared to that in D discharges. The reason is that the D–D cross section has a maximum at the MeV range while for the D–T cross section it is around 120 keV. Importantly, neutral beams in JET are launched at around 110 keV which is close to the optimal D–T cross section energy. Bear in mind that ICRH can increase the fast ion energy to the MeV range in D–T plasma which makes the fusion reactions less efficient than in D-D plasma. The ETS/CYRANO simulations found a total ICRH fusion enhancement of 17.5%–16.5% for H at concentrations of 0 and 4%, respectively, while for 3He it was 14.9%–20.5% enhancement for the same concentration range. On the other hand, PION/PENCIL predicted an ICRH enhancement of 8%–3% for H and 2%–1% for 3He under the same concentration range considered. There is a difference of around 10%–20% ICRF fusion enhancement between the two codes depending on the minority scheme and concentration under consideration. The reason for this is twofold: (1) due to different plasma parameters as the 92 436 D–T prediction was performed with higher input power compared to the 96 482 prediction (0.6 MW and 4.0 MW higher ICRH and NBI, respectively). Moreover, the density in 92 436 was also lower which leads to better penetration and, therefore, higher ICRH + NBI synergy; (2) most importantly, due to the fact that, ETS/CYRANO accounts for all Coulomb collisional interactions by solving the coupled Fokker–Planck equations of the different ions species which can enhance the thermal velocity of the bulk. This is not the case for PION/PENCIL, where the collisional operator of the resonant species does not affect other species' distribution functions, i.e. the enhancement is due to direct power absorption by resonant ions only. This is the main reason why the difference is more accentuated in the 3He minority scheme.
3.2. Unbalanced D–T ratio and fundamental D ICRH predictions
The fact that D and T have different atomic masses, leads to different energy maxima of the beam-thermal reactivity,  , being
  and
and  . Therefore, at the JET beams' energy range, D beam-target reactivity is stronger as opposed to T beam- target. This can be exploited by changing the bulk D–T ratio, e.g. using a T rich plasma with D beams. Simulations performed with ETS/CYRANO predict the fusion power behaviour under different bulk ratios [54, 55]. Figure 5 shows the results for a high performance baseline discharge. It is clear that operating at D rich plasmas is non-optimal in JET. Operating with a D–T mixed beam shows that the fusion power is roughly constant in a wide range of D concentration around the D–T balanced ratio. When only D beams are used, deviating towards T rich plasmas is ideal. In fact, a T rich plasma using D beams with fundamental D ICRH scheme,
  , reached the fusion power world record during DTE2 confirming previous modelling activities [56].

Figure 5. Fusion power produced for different bulk D concentration in a D–T plasma and two different beam combinations: D–T beams (blue dashed line) and D beams (red dashed line). Reproduced from [54]. © 2022 ERM-KMS. All rights reserved.
Download figure:
Standard image High-resolution imageFurther simulations were performed considering several ICRH schemes and unbalanced D–T ratios using hybrid high-performance main plasma parameters ( ,
,  and
and  ) [55]. The kinetic and beam deposition profiles were kept identical among these simulations, so isotope transport and beam deposition effects are not considered. A total power of 36 MW was used (
 and
and  ). Figure 6 shows that fundamental ICRF heating of a large minority of D ions is predicted to produce the highest fusion power when T rich plasmas are being considered as opposed to 2nd T harmonic and 2nd D harmonic schemes. It is important to mention that small H and 3He concentrations were considered to account for parasitic absorption in these cases, which are relevant in the 2nd harmonic scenarios. The fusion power is dominated by beam-target reactions as most of the heating power comes from NBI, in the D-beam scenario the beam-target reactions represent the 62%–79% of the total fusion reactions from 60%–10% D concentration, respectively. Additionally, this prediction shows a slightly stronger enhancement for D minority at T rich plasmas for the three beam cases considered, balanced D–T, D and T beams. The ICRH fusion enhancement is clearly stronger at T rich and balanced bulk mix, while at D concentrations larger than ∼70% it becomes weaker (lower than 1 MW).

Figure 6. Fusion power estimates as function of the D:T isotope ratio for three NBI injection cases (PNBI = 32 MW, ENBI = 120 keV) and three different ICRF heating schemes (PICRH = 4 MW): Fundamental (N = 1) D heating with 1% Be (circles), 2nd harmonic (N = 2) T with 0.3% N = 1 3He heating (squares) and N = 2 D with 1% N = 1 H ICRF heating (triangles). The NBI only values (RF = 0) are also shown (small dots). Reprinted from [55], with the permission of AIP Publishing.
Download figure:
Standard image High-resolution image4. Pedestal modelling
A special focus was put on predictions for the pedestal pressure as the pedestal plays a crucial role in predicting the confinement by setting the boundary condition for the core transport simulations for H-mode plasmas, which were going to be the main target scenarios in DTE2.
An important model used to characterise and extrapolate the pedestal of JET plasmas was EPED1 [57], implemented in the Europed code [58]. One of the features in Europed is that it allows relative shift of the density profile with respect to the temperature profile. This is important as it has been observed in JET-ILW that the pedestal density profile is often shifted outwards with respect to the pedestal temperature profile. We simulated the effect of the radial density shift on the predicted pedestal pressure and found that the shift can degrade the pressure pedestal height by 30%–35% [59] due to the degradation of the pedestal pressure gradient, through its link with the ratio of density to temperature scale lengths. This is shown in figure 7 along with a comparison with the experimental JET-ILW plasma. Due to profile stiffness, this effect can propagate in the core and decrease the core temperature. We also showed that Europed predictions done with the experimental density shift was able to predict the pedestal height of database of over 1000 JET-ILW discharges with RMSE = 14% [60]. The database includes cases that are found to be stable for peeling-ballooning modes using experimental profiles. In these cases Europed underpredicts the pedestal width and overpredicts the pressure gradient. These effects compensate each other giving a good prediction for the pedestal top pressure.

Figure 7. Europed predictions of the effect of the relative shift in density to temperature pedestal (horizontal axis) on JET-ILW pedestal pressure (vertical axis) for pulse #87336.
Download figure:
Standard image High-resolution imageSelf-consistent simulations including EPED1 for the pedestal and BGB transport model for the core transport were able to reproduce the experimentally observed power degradation of confinement in hybrid scenarios that was markedly lower than that derived in the IPB98(y, 2) scaling law [58, 61]. The reason for this was the core-pedestal synergy that was shown to lead to virtuous cycle where higher pedestal leads to higher  due to better global confinement [33]. Increased
  in turn increases the predicted pedestal height as it has stabilising effect on ideal MHD peeling-ballooning modes that are the limit to the type I ELMy pedestal in the EPED model. The necessity of core and edge self-consistent simulations will be further discussed in section 5.
An alternative core transport model to BGB was also tested. A simple stiff transport model was considered in which the heat diffusion is low to a threshold value of  = 5, where R is the major radius and
  is the temperature gradient length,
  , and then increases rapidly above that value. The Europed modelling predicted 11–12 MW of fusion power with 40 MW heating power for a low triangularity plasma and 17–18 MW of fusion in high triangularity due to increased core-pedestal synergy.
In order to get a handle on the isotope effect on the pedestal, experiments and modelling of H plasmas were conducted on JET-ILW. In H experiments, compared to D, markedly lower pedestal density with the similar heating and fuelling was observed [62]. The linear ideal MHD stability analysis of these type I ELMy H-mode plasmas showed that the pure isotope effect on the pedestal pressure is very modest and cannot explain the observed improved pedestal with isotope mass [63].
It is important to clarify at this point that, whereas models for the pedestal pressure predictions are available, predictions for temperatures and density are more challenging. Notably, the prediction for the density at the top of the pedestal is essential as it has strong effects on NBI penetration in JET. Since no single model is able to fully predict the density at the top of the pedestal, several approaches were considered when extrapolating D plasmas to D–T at different Ip, Bt and input power. A predictive model for the density pedestal based on neutral penetration was used in [63]. It was able to predict the pedestal density with RMSE = 17% for the pedestal database when a correction term based on plasma triangularity (that has no physical basis in the neutral penetration model) was used. However, it must be noted that this model predicts the opposite effect from the main ion isotope on the pedestal density than what is observed in the experiment [63]. An improved model that correctly predicts the isotope effect has been developed [64, 65]. This model is still not fully predictive as it requires the input value of the experimental separatrix density and the adjusted ratio of heat to particle transport consistent with the response of the pedestal profiles as the isotope content is varied, however, it is very valuable as it provides guidance to identify the physics processes at play. This model is yet to be used in the integrated modelling of D–T plasmas.
Other approaches for the evaluation of the pedestal density consisted on using ad-hoc models based on a regression of the JET-ILW pedestal database [66]. This approach was used in dedicated integrated modelling simulations [67].
Finally, when using the CRONOS code [10], particle transport within the pedestal was assumed to follow some fraction of the ion neoclassical thermal transport. When this model was validated with D plasmas, it showed good extrapolation capabilities. However, it lacked the correct isotope physics.
The prediction of the density at the top of the pedestal was the biggest challenge to properly predict D–T fusion power. Performing sensitivity scans actually provided valuable Pfus trends which were used as a guide for scenario development.
5. Integrated modelling efforts using high fidelity models for core transport
5.1. Core transport models used for DTE2 prediction
Estimates of D–T performance from D shots were attempted with the semiempirical BGB transport model described in [28]. This model has been tuned on JET C-wall plasmas and it is therefore reasonable to use it for limited extrapolation of JET shots. However, one of the main drawbacks of the BGB transport model is that it cannot reproduce deviations from GyroBohm (GB) transport as expected from gyrokinetic studies when increasing the main ion mass [68]. Furthermore, use of empirical models such as BgB for core transport prediction has a large uncertainty when extrapolating to a different plasma regime e.g. the scenarios foreseen in ITER as the fit parameters in the model were found to match the experimental data in the present devices. This requires a physics based model. The saturated level of turbulence can be fundamentally calculated with a non-linear gyrokinetic simulation in a local flux tube, but its computation is too expensive to couple with integrated modelling codes, which should model the whole radius for a long time window, together with heat and particle source calculation. This has motivated to develop quasilinear models, which are theory-based reduced models. Quasilinear models are sufficiently fast to couple with integrated modelling codes, and have been validated in JET discharges [10, 67, 69, 70].
The Trapped Gyro Landau Fluid (TGLF) [71] model solves linearised gyro-fluid equations, of which the differential equation system is closed in a way to maintain the kinetic curvature drift and Landau damping resonances and finite Larmor radius effects [72]. Detailed analyses of D plasmas shots at JET with TGLF showed some difficulties to reproduce results from Gyrokinetic simulations. This was notably the case for the model of the saturation rule for calculating transport used in TGLF called SAT0, which tends to overestimate the impact of ExB shearing. Several other saturation rules, known as SAT1 and SAT2 [73], were developed. In particular, SAT2 fits the 3D spectrum (poloidal angle, radial and poloidal wavenumber) of the saturated level of electrostatic potential fluctuations from a database of CGYRO non-linear gyrokinetic turbulence simulations. The choice of poloidal wavenumber spectrum used in TGLF has been optimised to take into account the mixture of D and T hydrogenic isotope main gas species and multiple impurity species in JET DTE2 discharges.
Another quasi-linear model extensively used is QuaLiKiz (QLK), which is an electrostatic kinetic quasilinear transport model. It uses a simplified geometry to allow a fast kinetic solution of the eigenvalue problem and combined with a quasilinear rule predicts transport fluxes for an arbitrary number of species and plasma momentum [74, 75].
5.2. Heat and particle transport predictions
5.2.1. Initial JET core transport modelling efforts in 2014–18 and initial projections to D–T using ILW plasmas.
A dedicated integrated modelling activity in view of validation of models used and extrapolation capabilities started in the period 2014–2018 [10, 76]. A special focus was devoted to the physics of the hybrid scenario as already explained in section 2. In particular, it was important to evaluate whether a suite of models was able to reproduce the key physics of the hybrid scenario and to demonstrate extrapolability to different Ip, Bt and input power.
One key element was to validate models at high beta, which was the target of the hybrid scenario in DTE2. For that purpose, a validation phase started with the discharges from a power scan at JET which was carried out in similar conditions to the hybrid scenario, i.e. pre-shape q profile with low core magnetic shear, but in reduced Ip = 1.4 MA and Bt = 1.7 T [61]. In such a power scan, complex non-linear physics, involving core-edge interplay and improved core confinement due to electromagnetic and fast ions effects, was found to be at the origin of the good thermal confinement [33, 77]. Also important was to have enough central heating in order to generate enough core pressure gradients which enhance electromagnetic effects.
Integrated model simulations performed with the CRONOS code used the discharges 84 792 (at high input power) and 84 798 (at low power) to validate a self-consistent integrated modelling framework [10]. For such a purpose, it was necessary to have models for the core transport but also for the pedestal pressure in H-mode as both regions played a role on the good confinement. For the core transport, the quasi-linear code TGLF-SAT0 was used whereas for the pedestal a scaling for the pedestal pressure was used [78]. The results were good enough to proceed to the next step on the validation process. The input power, Bt and Ip were increased in order to match the hybrid discharge 86 614, which was developed in the following campaign. The agreement between extrapolated plasmas and the real experimental results was reasonably good.
Having a good suite of models allowed to perform scans with the aim of finding optimum hybrid conditions in D–T for fusion power optimisation. Notably, scans performed at different Ip and Bt (at constant q95) showed that the hybrid scenario was extremely sensitive to Ip through the role of the electron density. Actually, high Ip did not lead to higher Pfus, as shown in figure 8, as the higher density obtained at high Ip severely reduced core NBI heating and high core Ti might be lost in those conditions. This was an important result as it showed that, for the hybrid scenario route, working at lower Ip (and ne) might be beneficial, which can be initially counterintuitive. Dedicated Ip scans were performed in the D campaign preceding D–T precisely to test this point. It is worth to clarify that this result is related to the poor beam penetration in JET at high density, which prevents efficient core heating. This issue is not expected in ITER as the Negative NBI at 1 MeV will allow efficient core heating.
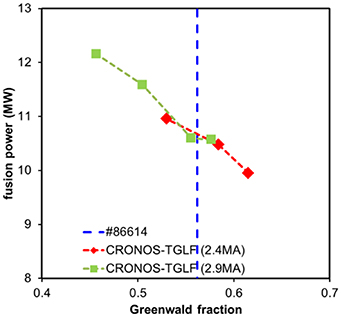
Figure 8. Fusion power dependence on the Greenwald fraction and the toroidal current of the discharge 86 614 extrapolated to 40 MW of input power in D–T with the CRONOS code and TGLF-SAT0. Reproduced from [10]. © IOP Publishing Ltd. All rights reserved.
Download figure:
Standard image High-resolution imageExtensive modelling scans showed that the fusion power expected from the hybrid scenario at 40 MW of input power could be of about ∼15 MW when D and T was included in the simulations. The fusion yield could be reduced to ∼11 MW considering that transport and pedestal in D–T is the same as in D. The same integrated modelling framework was applied to the baseline scenario discharge 92 436 obtained in following campaigns [79] showing that ∼15 MW of fusion power was possible at q95 = 3 [79, 80].
The baseline discharge 92 436 was also simulated with the code JINTRAC [81] and the transport model QLK [76]. Unlike the simulations performed with CRONOS, the rotation was also simulated. Generally speaking, the results obtained were similar to TGLF with CRONOS and showed some underestimation of the experimental Ti whereas the rotation was well reproduced. An extrapolation was performed to D–T and maximum input power. Broadly, the results also show that high fusion power was possible for the baseline scenario.
Further validations of the predictive capabilities of the TRANSP code and the transport models implemented were performed with baseline discharges from the same period and using two different transport models for core transport, GLF23 and TGLF [69]. Ti predictions with TGLF-SAT0 were in reasonable agreement with Ti measurements, thereby enabling better predictions of fusion power. This was an important step as it provided an extra integrated modelling suite, i.e. TRANSP, for D–T extrapolations.
BGB predictions for the JET baseline and hybrid scenarios were also carried out using the JINTRAC code and the reference discharges 92 436 for the baseline scenario and 86 614 for the hybrid scenario, respectively. A significant effort to use the pedestal model EPED1 was undertaken including self-consistent core simulations with BGB. Such an effort is described in detail in section 4.
A summary of the fusion power obtained with the different codes and models applied in this initial phase and comparison to the fusion power actually obtained in DTE2 is shown in section 8.
5.2.2. JET D reference discharges in preparation of DTE2.
The last D campaign in JET before DTE2 served for providing well prepared reference discharges to be reproduced in D–T so as to minimise T consumption and 14 MeV neutrons on scenario developments [5, 51]. The validation and verification effort continued during this phase by using reference baseline and hybrid discharges and integrated modelling simulations with several codes such as JINTRAC, ETS [82] and TRANSP. At least two quasi-linear models for heat and particle transport were used, TGLF and QLK and several approximations for the pedestal scaling with mass, power or current. In figure 9 it is shown the comparison between the predicted Te, Ti and ne for the hybrid discharge #97781 and the experimental data. The experimental values at the pedestal were chosen as boundary conditions for all the cases. In the particular case of ne, only an approximated boundary at the pedestal was obtained due to the different type of particle transport solver used in each code. The experimental rotation profile is taken for all the cases. From the simulations, it is clear that all the models lead to a good agreement with experimental data for all the channels simulated.

Figure 9. Comparison between the experimental and simulated Te, Ti and ne with TGLF-SAT1 and QLK for the discharge #97781. Reproduced with permission from [51].
Download figure:
Standard image High-resolution imageExtrapolations to D–T at the nominal input power and to the maximum available power available at JET were performed with the same models taking as a reference the time window 9.2–9.4 s for the discharge #97781. The impurity input data was given by profiles of Be, Ne, Ni and W density obtained by analysing measurements of several diagnostics [83] and it is assumed the same impurity content in D–T. In agreement with previous extrapolations shown in section 5.2.1, the expected fusion power in D–T for both baseline and hybrid routes is ∼9–11 MW for the baseline and ∼10–12 MW for the hybrid at 33 MW of input power. However, at 40 MW, the fusion power might reach ∼12–17 MW. The scattered values from the different models for the D–T fusion power at high input power reflects the sensitivity of the transport models to the isotope effect but also to differences in heating and fuelling patterns which are different in the integrated modelling tools used. A summary of the fusion power obtained with the different codes and models and comparison to the fusion power actually obtained in DTE2 is shown in section 8.
The good results obtained with TGLF-SAT1 were further benchmarked with Gyrokinetic simulations. It was found that, similarly to TGLF-SAT0, the model did not provide good levels of stiffness for the heat transport in plasma core conditions. Further development of TGLF-SAT2 was done and it has been used for the analysis of D–T plasmas from DTE2 [9].
5.2.3. Multi-channel predictions of fusion power and impurities in D–T.
In addition to the need to predict steady state confinement and fusion performance, multi-channel integrated modelling was developed and deployed to predict the evolution of the pulse with respect to tungsten accumulation, which limited the duration of many high performance phases. Over the first years of ILW operation, it was understood that heavy impurities (primarily tungsten) could accumulate near the magnetic axis, leading to performance limiting radiation, MHD triggers, and in some cases radiative collapse of the discharge. Detailed transport modelling demonstrated that this phenomenology was driven by an inward neoclassical pinch strongly enhanced by poloidal asymmetries driven by rotation and sensitive to main ion density and temperature gradients [84]. Predicting the impurity evolution and how it would change in D–T plasmas necessitated the development of multi-channel modelling which could accurately predict temperature, density and rotation, before the impurities could be accurately modelled. A multi-channel modelling capability with the QLK transport model was developed hierarchically adding one channel at a time (current, temperature, density, then rotation) by understanding the sensitivities at each level, and tuning the integrated model to correctly predict the evolution of high performance D hybrid pulses. Finally the heavy impurities with self-consistent radiation were added, and the NEO code [85, 86] was used for accurate neoclassical transport, giving a capability to predictively model the timescale of tungsten accumulation and radiative performance limitation in the core [67, 87]. This capability was used to examine competing contributions of ICRH to control impurity accumulation, and the optimal heating mix, field and current, for extrapolation of the hybrid scenario to extended high-performance in D–T [68]. This state of the art modelling assisted the scenario development, predicting that central W accumulation would occur sooner in tritium pulses due to stronger density peaking, but that this could be mitigated by raising the plasma current and localising the ICRH close to the axis but slightly on the Low Field Side. An anti-GB scaling of ion confinement was also predicted by these simulations due to decreasing ion-electron energy exchange and increasing transport contribution from the Electron Temperature Gradient (ETG) with isotope mass, but multiscale simulations later found this effect to be exaggerated [88]. A summary of these results is shown in figure 10. The current ramp-up of the hybrid discharges was also optimised against increased impurity radiation in T pulses using predictive modelling using a QLK neural network tuned to a parameter space informed by large JET discharge database [89].

Figure 10. Predicted time evolution of the total energy (WMHD), fusion power (Pfusion), total ion density in the axis (nD + T axial), radiated power inside ρ < 0.2, Te and Ti at the plasma axis (Te axial Ti axial) and minimum q (qmin) (left). Time evolution of nD + T axial, radiated power inside ρ < 0.2 and Te axial for different assumptions of ICRH power deposition width at the axis: wide, med (medium) and nar (narrow) (right). Reproduced courtesy of IAEA. Figure from [67]. © EURATOM 2020.
Download figure:
Standard image High-resolution imageThe JINTRAC and QLK combination was also used to analyse extrapolations of the baseline discharges 92 436 and 96 482 [90] including self-consistent impurity transport of a number of impurities modelled by the impurity transport code SANCO [91]. The impurity transport model includes neo-classical transport from NCLASS [92] and anomalous transport provided by QLK. Results indicated that these plasmas can achieve ∼10 MW of fusion power at 3.8 MA, 3.7 T and with an additional heating power of at least 38 MW. The impurity content considered for the extrapolation might significantly impact the fusion yield. As obtained in other modelling approaches, the performance is also extremely sensitive to the amount of heating power available with 15 MW of fusion power only achieved in a highly pure plasma and for additional heating power close to 40 MW.
6. D–D fusion neutron measurements and comparison with prediction from models
A reliable prediction of the neutron rate is the ultimate goal of integrated modelling, as this is the parameter proportional to fusion power and yet, a correct prediction of the neutron rate only is, per se, insufficient to validate a simulation as a whole. For example, a correct neutron rate may come from an underestimation of the contribution of thermal reactions to neutron emission, combined with an overestimation of non-thermal emission due to the heating scheme adopted. It is therefore important that simulation results are compared not just to the rate, but also to the energy spectrum of neutron emission as its shape makes it possible to disentangle thermal and non-thermal contributions to the neutron emission, for example with the aim of validating modelling of plasma heating by the auxiliary systems (NBI and/or ICRH). In JET-ILW deuterium plasmas, the neutron spectrum is measured primarily by the TOFOR neutron spectrometer [93] using the time of flight technique, where neutron energy is determined by the time it takes for neutrons to travel between two set of detectors. Thermal and non-thermal signatures of the neutron emission are often well separated in the TOFOR data, whereby the former shows up as a Gaussian shaped peak centred around tTOF = 65 ns (tTOF indicates here the time of flight; tTOF = 65 ns corresponds to a neutron energy of 2.45 MeV), while the latter is manifested as tails that extend to low and high tTOF. The strategy towards modelling validation by comparison with neutron data proceeds via synthetic diagnostics. In its simplest (and earliest) application, pre-determined shapes were used to empirically describe different components of the neutron spectrum: a Gaussian was used to represent thermal emission [94], while Maxwellians (either isotropic or anisotropic) [93] where fitted to the tails of the spectrum to determine the 'tail temperature' of the ions heated by ICRH, which stands as an indicator of the mean ion energy. The shape of the NBI component was empirically represented by a 'half box' distribution [95] of the ions in the energy space which, despite being generally effective at approximating the actual shape of this component, is a rather poor representation from a physics standpoint. As neutrons are predominantly born from the central regions of the plasma, the parameters of the components that are fitted to data in this approach characterise the core distribution functions only.
Starting from ∼2010, an increased effort was made towards the detailed validation of modelling results of the fuel ion distribution function using neutron spectroscopy by the development of a detailed modelling workflow [96, 97]. In this approach, the line of sight of the instrument is divided into a number of small volumes, called voxels. A neutron spectrum code [98, 99] calculates the energy spectrum generated by each voxel, starting from the simulated fuel ion distribution function in the voxel (provided by integrated modelling) and the main parameters (density, temperature, rotation velocity) of the bulk plasma. Each voxel has a weight that depends on its subtended solid angle with respect to the neutron spectrometer and the plasma volume it encloses. The synthetic neutron spectrum is the weighted sum of the spectra produced by all the voxels that make the line of sight, after folding with the instrument response function. This is required to convert from the neutron spectrum in units of energy, as determined by the neutron code, to the actual, related spectrum that is measured by the instrument and that uses its own units, for example time of flight in the case of TOFOR. As neutron spectrometers are generally not absolutely calibrated, a normalisation parameter is used to fit the synthetic spectrum to actual data. In some cases, more than one fitting parameter may be used, for example when neutron emission receives contributions from different fast ion populations, resulting in distinctive components to the neutron emission, and the corresponding fast ion densities are not modelled, or they are subject to a significant uncertainty.
The systematic application of the workflow made it possible to validate simulations of the fuel ion distribution function by the suite of codes used by integrated modelling, particularly TRANSP when used with its heating modules NUBEAM and TORIC [95]. The main area of application has been the validation of heating schemes. These ranged from simpler scenarios that made use of NBI only, to more complex plasmas where a combination of ICRH and NBI was used, either as the heating mix adopted by deuterium target plasmas in preparation of high power D–T scenarios [100], or as a tool to generate an MeV range ion population [96, 101, 102] for experiments dedicated to the physics of energetic particles.
In discharges heated by NBI only, modelling has been found generally consistent with data [101, 102], for plasmas both of D and with T (before DTE2). This may be expected at JET, as NBI ions are sub-Alfvenic and the plasmas are often MHD quiescent in these scenarios. An exception was found in one trace T case for which, however, pronounced islands were detected by the magnetic diagnostics [103] and may have been the cause of the discrepancy found.
In the case of plasmas heated by ICRH, or a combination of ICRH and NBI, the picture is more mixed. On the one hand there is a larger variety of schemes that can occur [96, 101, 102] and not all of them are presently fully modelled by the tools that are coupled to the synthetic neutron spectroscopy workflow. On the other hand, these scenarios generate MeV range ions that, in many cases, can trigger MHD instabilities. These in turn act on the fuel ions, thus altering the physics assumptions of the standard integrated modelling codes that are based on quiescent plasmas where the fast ion transport during slowing down is neoclassical. Despite this added complexity, in the quiescent phases of deuterium plasmas that could be modelled by the available tools, a general agreement was found between predictions and measurements. A key result was, for example, the correct prediction of the enhancement of the fusion production due to second harmonic heating of deuterium and which was relevant to build confidence in the predictions of the (more limited) enhancement expected in the case of D–T plasmas [100]. Another important result was the validation of the deuterium distribution function generated in the three ion D-(DNBI)-3He scheme [104], which was used in follow up simulations of turbulence stabilisation by the fast ions with gyrokinetic codes [105]. From the determination of the mix of components that made the neutron spectrum in high power scenario discharges of deuterium it was also possible to predict the fusion performance of DTE2 plasmas and to obtain results that were consistent with those of the more detailed integrated modelling simulations [106] and in line with the expectation to obtain a fusion power between 10 MW and 15 MW depending on the scenario.
In MHD active cases, for example in plasmas that made use of third harmonic ICRH on NBI deuterons for fast ion physics studies, instead, deviations between synthetic spectra and measurements were ascribed to an energy selective redistribution of the fast deuterons when they were resonant with so called 'tornado modes' [107]. A more recent analysis of a set of similar experiments was able to explain the 'holes' found on the high energy tails of the neutron spectrum as due to the appearance of a 'bump on tail' in the fast deuterium distribution function, as expected by theory [108]. Among the latest developments of the analysis tools for neutron (and gamma-ray) spectroscopy measurements at JET, the application of velocity space tomography is worth mentioning [109]. With this tool, it is possible to combine measurements from different spectroscopy diagnostics and use them to infer the fast ion distribution function (or a set of those) that is best compatible with data, without need for modelling. This is useful for those scenarios that integrated modelling tools cannot yet tackle, although the results, particularly some of their detailed features, should be taken with some care, due to the uncertainties associated to the intrinsically ill-posed nature of inversion problems.
The successful validation exercise based on the systematic comparison between neutron spectroscopy data and synthetic diagnostics by the modelling workflow described above, in D plasmas and some plasma with T before DTE2, is at the heart of the ongoing, broad physics validation effort of DTE2 experiment results. Although TOFOR has little diagnostic capabilities in DTE2 plasmas, D–T specific spectrometers have been developed and used. These are the MPRu (an upgraded version of the spectrometer already used in DTE1) and, for the first time at JET, synthetic diamond detectors [110]. An important feature of this new diagnostic set is that data can be simultaneously measured along different lines of sight. This feature, besides providing a better spatial coverage of the plasma cross section, also makes the data sensitive to different classes of fuel ion orbits, which offers increased opportunities for detailed modelling validation by the synthetic diagnostic workflow. This is especially relevant for the ICRH scenarios as, depending on the scheme, different types of (fast ion) orbits may be generated, for example predominantly trapped ions for minority heating, but mainly passing ions for the three ion scenarios [111]. An instrument selective sensitivity to the orbit type is therefore an unprecedented opportunity for modelling validation, also in view of understanding whether the MHD, whose interactions are often orbit-selective, had an impact on the overall performance for some of the scenarios in DTE2.
7. First principle transport modelling in support of the activity
One key aspect that had to be carefully analysed during the process of prediction for DTE2 was the reliability of simplified transport models to predict turbulence changes with different hydrogen isotopes. This was an essential step in order to verify whether the predictions shown in section 5 recovered the physics expected in heat and particle transport by the change from D to D–T. Furthermore, dedicated analyses on the difference between D and D–T transport and turbulence could guide D experiments towards producing reference discharges useful in D–T.
First principle modelling, in particular gyrokinetic simulations, have been widely performed to provide guidance on the mechanisms for heat and particle transport in JET plasmas as well as how such a mechanisms extrapolated to D–T. These studies, mainly performed for core transport, have been essential in order to evaluate the reliability of D–T predictions.
Initially, there was a strong push to understand the origin of the improved confinement obtained in hybrid scenarios and whether this improved confinement could also appear in D–T. In particular, several studies pointed out that hybrid scenarios required high  , namely
  , in order to provide stable high confinement [112, 113]. This feature pointed out the role of electromagnetic effects as important. Dedicated analyses were necessary to distinguish such a potential mechanism with respect to other more well-known mechanisms for turbulent transport reduction such as ExB shearing.
Using some of the reference discharges shown in section 2, gyrokinetic simulations were performed with the code GENE [114] in the plasma core. Non-linear simulations showed that electromagnetic effects were essential to understand transport reduction at high beta in the presence of high core pressure gradients in the inner core [33, 113]. Such effects were enhanced by the NBI fast ions as well as they highly contribute to the total pressure gradient. In addition to core effects, high pedestal pressure was also obtained due to the high  in the hybrid scenario, which stabilised ballooning modes. Furthermore, similar studies in JET for ILW plasmas at high beta confirmed these results [77]. For a detailed summary about the importance of electromagnetic and fast ions effects on JET plasmas the reader can check the [35, 115].
An extensive set of analyses were performed in order to understand how electromagnetic and fast ions effects and other mechanisms impacting turbulence reduction, e.g. ExB shearing, collisionality, zonal flows or impurities, extrapolated to other hydrogen isotopes. This was done in both the core and edge plasma regions and in parallel to the development of H and D JET campaigns, which provided experimental background plasmas to be used for validation. A summary of such studies can be found in [68].
The GENE code was able to reproduce with reasonable accuracy heat and particle fluxes of D reference plasmas, which allowed to perform extensive parametric studies. Fewer studies were carried out using plasmas with different main ion isotope as H discharges were less frequently performed. Therefore, the full assessment about the validity of GENE, and in general GK simulations to predict heat and particle fluxes with different main ion isotopes has to be yet fully clarified. One key point worth to clarify, is that the GK local approximation was used throughout these studies and thus global effects were not captured, which can have some impact when considering effects involving core-edge interaction [116].
Generally speaking, gyrokinetic simulations showed that for the plasma core, deviations from GB transport mass scaling are expected when considering electromagnetic and fast ions effects, kinetic electrons, collisions and ExB shearing, being such deviations stronger in the presence of T. Particularly, stronger core isotope effects could be expected in high beta, high fast ion fraction and high rotation plasmas [117]. Importantly, such core mechanisms were not clearly identified in the plasma core of experimental H vs D plasmas as due to the technical constraints the operation in pure H at JET was limited to 10 MW of NBI, which prevented to work in conditions where core isotope effects could be mostly expected. From the perspective of the plasma edge, electromagnetic effects have been also found to explain experimental differences in H vs D plasmas in L-mode [118, 119]. However, the biggest differences appear at the edge in H-mode plasmas with a clear higher pedestal pressure in D. Extended studies have shown that inter/intra ELMs changes on transport characteristics rather than neutral penetration differences are responsible for the lower confinement in H [63]. Further studies were carried out by performing neoclassical and gyrokinetic transport studies, with GENE, in D and H type I ELMy H-mode discharges. It was found that heat transport driven by ITG turbulence is characterised by an anti-GB scaling, primarily due to the different impact of E × B shearing with different mass. Interestingly, net increase or decrease of the total heat flux is not found as both neoclassical and turbulent transport roughly compensate each other. Conversely, the total particle transport clearly decreases with increasing mass also due to the strong E × B shearing effect [120].
Simplified models of heat and particle transport, such as those based on the quasi-linear theory, do not fully capture deviations from GB scaling [68, 120, 121]. Whereas models such as QLK and TGLF reproduce the stronger effect of the ExB shearing with increasing mass at some extend, the electromagnetic and fast ions effects, which are basically nonlinear effects, are more challenging. Therefore, expecting accurate predictions of fusion power in JET in particular at high beta and rotation was difficult. This was an important drawback as operation at high power was a key point of DTE2 for the production of high fusion power.
In order to perform extrapolations to D–T with simplified models as credible as possible, several approaches to treat this issue were taken. There were clear indications that electrostatic GK simulations including high ExB shearing could provide similar heat fluxes to electromagnetic simulations at high beta [77]. Since the ExB shearing leads to deviations from GB mass scaling for transport driven by ITG modes, this could end up being a good approximation for DTE2. Therefore, the transport model TGLF with SAT0 was used for the extrapolation of the hybrid scenario from discharges performed in 2014–2018 [10]. As expected, simulations with TGLF-SAT0 lead to significant deviations from GB mass scaling as shown in figure 11, in which D and D–T settings are identical except that 50% of D is replaced by T, and yet higher confinement is obtained for D–T compared to D. In the case of QLK, ad-hoc modification was introduced in order to take into account the role of electromagnetic effects and fast ions [67].
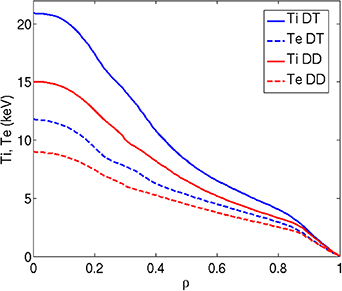
Figure 11. Comparison between Ti and Te for D–T and D in the case of the extrapolated plasmas at input power 40 MW from the JET hybrid discharge 86 614 with CRONOS and TGLF-SAT0. Reproduced from [10]. © IOP Publishing Ltd. All rights reserved.
Download figure:
Standard image High-resolution imageIn the particular case of the CRONOS simulation with TGLF and SAT0, it is important to clarify that the cordey scaling used for the pedestal pressure extrapolation, which leads to a dependence of Wped ∼ mi 0.2 [78]. Therefore, both deviations from GB scaling and higher pedestal had a beneficial effect on the fusion power produced, as an increase of about ∼4–5 MW was obtained in D–T compared to a case in which transport and pedestal pressure in D and T was identical. As will be shown in section 8, the better confinement in D–T make the total fusion yield to go above 15 MW at 40 MW of input power (without considering the alpha power). The fact that the confinement was higher in the presence of T was also obtained by using QLK although, at least partially, such an isotope effect was linked to the onset of ETG in hybrid plasmas, which was not confirmed in subsequent GK simulations of the same discharges [88].
Therefore, having different levels of modelling complexity is an essential way forward for plasma extrapolations. In this framework, it was essential to perform extrapolations to D–T with the guidance of first principle physics codes, which were able to clarify and overcome the limitations, range of applicability and potential issues of simplified models for transport. This critical aspect is still valid nowadays as first principle integrated modelling from the edge to the core plasma is not possible, and yet, evaluations of DEMO potential designs must be carried out with models that are not able to capture the full physics mechanisms present in magnetically confined plasmas.
8. Comparison of fusion power predicted by integrated modelling against the measurement
This section aims at comparing the fusion power predictions for DTE2 and the fusion power obtained in the experiments. The difficulties for obtaining stable baseline plasmas makes the comparison with predictions difficult, therefore, in this section, we focus in the hybrid scenario, which obtained high fusion power sustained for 5 s. This is done by splitting the predictions between those performed before the last JET D campaign before DTE2 and those performed using the reference discharges in D that would be later used as a basis for D–T scenarios in DTE2. This is an important aspect since on the one hand, before 2019, a significant exploratory phase was being carried out with the aim of searching optimal plasma conditions for fusion power generation and therefore modelling scans were necessary. On the other hand, the D experimental campaigns of 2019–2020 served to find optimum plasmas conditions for D–T and to provide reference discharges to be run in D–T. From this point of view, no extra modelling exploration was needed.
In figure 12, the extrapolation of the discharges described in section 2, in the period 2014–2018, is shown for different models and suite of integrated modelling codes. In this extrapolation phase, several sensitivity scans were performed, e.g. the total current, D vs DT heat flux from transport models or pedestal models assumptions. The impact of such scans on the fusion power is addressed in figure 12 by adding upper and lower bars to the nominal extrapolations, which are based on simulating pure D plasmas and calculating the equivalent D–T fusion power. The extrapolated fusion power is compared to the fusion power obtained in the hybrid scenario experiments in DTE2 at different input power.

Figure 12. Comparison between predicted fusion power and experimental one obtained in DTE2 for the hybrid scenario in the case of predictions performed using 2014–2018 plasmas (left) and 2019–2020 plasmas (right). Error bars in left figure account for sensitivity studies using different assumptions for the pedestal and core. Reproduced courtesy of IAEA. Figure from [76]. © EURATOM 2019. Reproduced with permission from [51].
Download figure:
Standard image High-resolution image
At medium input power, the fusion power is the one expected from extrapolations from plasmas in 2014–2016 at similar input power. At high power, the trend in fusion power seems to target the upper band of the extrapolations performed at 40 MW of input power. In the particular case of CRONOS-TGLF and JINTRAC-QLK the upper band of the extrapolation corresponds to D–T self-consistent simulations. However, a full comparison between measured fusion power and extrapolated one is difficult as the input power in the experiment did not reach 40 MW as assumed in the extrapolations.
Further details about the reproducibility of DTE2 hybrid plasmas by integrated modelling is discussed in [9] and the experimental details about the experimental scenario development for the hybrid scenario in D–T is shown in [122].
The extrapolation performed using reference D discharges obtained in the last D campaign before DTE2 is shown in figure 12. Similarly to the older discharges, Pfus ∼ 15 MW can only be obtained at Pin ∼ 40 MW. At the input power obtained in DTE2 hybrid scenarios, the fusion power predicted is in good agreement with measured fusion power.
It is important to stress that in these simulations some of the well-known physics that impacts the fusion power generation in JET was not included self-consistently. This is the case of the acceleration of NBI beams by ICRH, as explained in section 3.
9. Lessons learnt and conclusions
An ambitious predict-first activity was carried out for more than a decade in order to explore the potential output of a second D–T campaign at JET. Such an exercise has provided a unique opportunity to evaluate the status of the predictability of D–T plasmas close to ITER conditions. Together with detailed analyses of the D–T plasmas obtained in 2021, which are shown in [9], the modelling activity performed for DTE2 paves the way to an improved understanding of ITER D–T predictions.
In general it has been found that projections based on scaling laws are of limited use. Whereas scaling laws are valid to give a global picture of scaled plasmas, which is enough to characterise confinement as a first assessment, notably in future devices, detailed physics analyses cannot be based on such an approach. This is indeed the case of transport and turbulence, which is found to non-linearly interplay with the input power in such a way that predictions using power laws are of limited use [123].
Integrated modelling with validated models has provided a better way to predict the fusion power and guide DTE2. This is because integrated modelling can capture interplay between different physics aspects in a non-linear interaction. In order to achieve this degree of validity, a broad set of activities were identified as essential:
- (1)continuous comparison between simplified modelling and experimental data
- (2)more detailed comparison between simplified models and first principle models which are not possible to be used in integrated modelling due to the strong computational time required
- (3)revision of simplified models according to the comparison to experimental data and also to first principle physics models
- (4)extension of experimental programme according to projected results obtained from modelling in order to investigate their validity in different conditions to the ones used for the calibration of the models
- (5)development and use of specific diagnostics that can ensure a detailed physics comparison between models and experimental data.
Several codes, e.g. for heating or core heat transport, have been created or updated in the framework of this strategy. Examples are integrated modelling codes, TRANSP, JINTRAC, CRONOS, heating codes, PION, TORIC and the quasi-linear codes for heat transport TGLF and QLK. Even a new saturation rule for the calculation of heat transport driven by Trapped Electron Modes, which better accounts for the dependency of turbulence on the isotope mass, SAT3, has been developed in parallel of the different experimental campaigns [121].
With this approach, a solid answer to what fusion power could be obtained in DTE2 was given. It was clear that in order to achieve 15 MW of fusion power the maximum nominal input power available at JET, 40 MW, was necessary and lower fusion power was expected at lower input power. Such a result was confirmed by the experiments performed in DTE2 as discussed in the following papers [56, 122, 124].
An important point to highlight is the evolution of integrated modelling during this predict-first activity and how DTE2 has contributed. Initially, integrated modelling was performed by solving self-consistent transport equations for the ions and electrons heat and electron particle transport. Solving the particle electron transport seemed more adequate as measurements of electron density were straightforward, allowing for a direct comparison with modelling results. The installation of the JET-ILW led to the necessity to model high-Z metallic impurities and separate D and T species due to their asymmetric behaviour. Furthermore, such an effort also requires the simulation of both neoclassical and turbulent transport as they play an important role on high-Z W transport. Such simulations are now routinely performed in JET.
From this point of view, DTE2 has been an excellent background for understanding of the challenges for modelling D–T plasmas by using D plasmas as a reference. This is an essential information for ITER and other future devices.
However, with this approach, several issues have to be considered:
- (1)Modelling was based on several integrated modelling suite of codes as discrepancies due to different numerical approaches might be found.
- (2)As no single model is able to capture the whole physics of plasmas, several models with different characteristics were used in order to analyse the sensitivity of the results.
- (3)The level of maturity of the modelling in different plasma regions is quite diverse. Specifically, Scrape-Off Layer (SOL), separatrix and pedestal regions interplay is a challenge. This is particularly important for core modelling as the plasma edge is known to play an important role on the plasma core through well established physics mechanisms.
- (4)Predictions of the pedestal in type-I ELMy H-plasmas is a challenge particularly for the density at the top of the pedestal. Many more efforts towards such a modelling should be pursued.
- (5)The validation of simplified models for transport cannot be done solely by comparing to predicted temperatures and densities to measured kinetic profiles. Comparison to detailed physics diagnostics is also necessary in order to avoid unintended agreements because of the wrong physics reasons.
The modelling performed for DTE2 gives more confidence on the possibilities that D–T plasmas can be predicted in a Be/W tokamak environment. Of particular importance is the fact that the fusion power can be projected from existent D plasmas. This is an essential feature that will be required in tokamak devices in which the fusion power is the predominant heating mechanism, such as ITER, and which will go through a D experimental phase before developing D–T.
Finally, several considerations are important. The modelling results obtained in pre DTE2 must be confronted to the output from DTE2, specifically to the experiments addressing isotope effects on transport [9, 125], pedestal [126], ICRH heating [53] and fusion power [56, 122, 124]. Such a comparison is a necessary step to further improve the modelling requirements for future D–T plasmas.
The successful predict-first activity performed for DTE2 does not necessarily mean that reactor relevant D–T plasmas can be fully predicted. The presence of a significant population of alpha particles, much larger than in DTE2, might lead to extra physics characteristics such as turbulence suppression [105, 127].
In general we find that in order to improve predictive capability of future tokamak devices, e.g. for ITER, the following activities are needed:
- more routine efforts at rotation prediction
- more routine efforts at predictive impurities and radiation, including sources from SOL and ELMs
- pedestal prediction including impact of SOL conditions
- impact of alphas and fast ions on transport in the reduced models
- impact of MHD and Alfvén Eigenmodes on confinement.
Acknowledgments
This work has been carried out within the framework of the EUROfusion Consortium, funded by the European Union via the Euratom Research and Training Programme (Grant Agreement No. 101052200—EUROfusion) and from the EPSRC (Grant Number EP/W006839/1). Views and opinions expressed are however those of the author(s) only and do not necessarily reflect those of the European Union or the European Commission. Neither the European Union nor the European Commission can be held responsible for them.
The BSC part of this work has contributed through the Spanish National R&D Project PID2019-110854RB-I00 funded through MCIN/AEI/10.13039/501100011033. The BSC part of this work is grateful for the support received from the Departament de Recerca i Universitats de la Generalitat de Catalunya via the Research Group Fusion Group with code: 2021 SGR 00908