


Abstract
Mitigating tungsten (W) wall erosion and core accumulation are vitally important for the steady-state operation of tokamaks. It is well known that drifts have a great impact on the transport of charged particles in the edge region, which could affect W source and W impurity transport. In this work, SOLPS-ITER modeling is applied to study the W impurity behavior on EAST during neon seeding with the consideration of E× B drift. The objective is to establish the relationship between the eroded W flux, W transport and the corresponding accumulation in the core in different discharge regimes. The effects of drift on W sputtering at targets and W impurity distribution in the cases of different toroidal magnetic field (Bt) directions are assessed. The simulation results indicate that drift could influence W transport via W impurity retention and redistribution in the divertor, and the leakage from the divertor. In forward Bt (B× ∇B points to the X-point), eroded W flux at the outer target is increased remarkably, and most of the W ions transport from the outer to the inner divertor and escape to the upstream region in the high field side. W ions mainly transport from the inner to the outer divertor and escape from the divertor in the low field side in reversed Bt due to the opposite drift flux. The Ne puffing rate is scanned in forward Bt and without-drift cases to further investigate the W erosion and W impurity transport in different divertor regimes. It is found that the W source from targets is generally enhanced by drift compared to cases without drift. The core accumulation, as well as poloidal asymmetry, is also influenced significantly by the drift. In the attached regime, the intense W source and strong drift flux lead to enhanced W accumulation in the core, and obvious poloidal asymmetry of W density distribution appears. The drift flux is reduced and W erosion is suppressed after detachment. W concentration in the core and poloidal asymmetry consequently decline. Therefore, adequate Ne impurity seeding can be applied to control the W accumulation in the core.
Export citation and abstract BibTeX RIS

Original content from this work may be used under the terms of the Creative Commons Attribution 4.0 license. Any further distribution of this work must maintain attribution to the author(s) and the title of the work, journal citation and DOI.
1. Introduction
Tungsten (W) is the main candidate for use as the plasma-facing material (PFM) of future fusion devices. However, due to the limited tolerance of W impurities in the hot main plasma region, W concentration in the core should be strictly controlled, e.g. below 1 × 10⁻⁵ in ITER [1]. External impurity seeding with, for example, argon (Ar), neon (Ne) or nitrogen (N), is required to dissipate the energy and to reduce the heat load on the divertor targets, thus ensuring the lifetime of the device.
EAST is a full metal tokamak, with both divertors using W as the PFM [2]. In our previous work, it was found that even the heat flux to the target is obviously reduced during impurity seeding on EAST. The W sputtering process could be complicated by the introduced impurity particles and W self-sputtering [3, 4]. Moreover, the seeding impurities have a great impact on the W transport and accumulation in the core region [3]. Therefore, understanding W impurity behaviors during impurity seeding is important for steady-state discharge. The drifts influence the plasma transport significantly [5, 6], thus it may potentially change the W impurity accumulation. Numerical simulations have been applied to study W impurity transport with drifts. Quasi-kinetic 2D Monte Carlo code DIVIMP has been applied via manually adding the drift velocities to study the W transport on DIII-D, and it was found that the E× B drift dominates the W impurity transport and the W leakage in the divertor region [7]. Kinetic modeling by IMPGYRO, which naturally includes drifts, showed that the E× B drift in reversed Bt (B× ∇B points away from the X-point) dominates over the friction force on the transport of W ions in the scrape-off layer (SOL), thus pushing most of the W towards the top. This gives rise to the poloidal asymmetry of impurity distribution [8]. ERO modeling identified that the E× B drift plays the dominant role in W gross erosion [9]. However, the quantitative study of the impact of drifts on W impurity transport during external inert gas seeding is still inadequate due to numerical difficulties, and, in particular, the fully self-consistent simulation of W impurity and background plasma with drifts is still in demand.
SOLPS-ITER code suite with improved numerical solution of the drift terms and the electric potential equation has been applied to study the effect of drifts on the transport of seeded impurities [10, 11]. To our best knowledge, the influence of drifts on the transport of sputtered W impurity by SOLPS-ITER still remains unsolved. The bundled charge state model [12] has been developed to save computational time for high-Z impurity simulation. Highly resolved bundled schemes with more than 20 W fluids can describe well the W impurity behavior in the edge region [13]. Therefore, the bundled model and the improved numerical solution make it possible to fully simulate W transport with drifts using SOLPS-ITER.
In the present work, the influence of drifts on the W target erosion and W impurity transport with Ne seeding on EAST is studied by utilizing SOLPS-ITER. W impurity is bundled into 23 plasma species. To separate other contributing factors in W production and transport, three cases are analyzed with identical input parameters, and only drift terms and the direction of toroidal magnetic field (Bt) are varied. The effects of the divertor regime on drift-related transport and W accumulation in the core region are also investigated. The paper is organized as follows. The simulation setup is depicted briefly in section 2. In section 3, the simulation results are given by comparing with-drift and without-drift cases. The influences of drifts on W target erosion and W transport in different discharge regimes are analyzed. Finally, conclusions are summarized in section 4.
2. Simulation setup
SOLPS-ITER is a code suite consisting of B2.5 and EIRENE [14]. B2.5 solves a set of particle, momentum balance equations for ions with each charge state, internal energy balance equations for ions (summed over all charge states for each species) and electrons, and current continuity equation. EIRENE simulates interactions between neutral particles and plasma background by solving nonlinear Boltzmann equations [15]. In this work, the EAST lower single null (LSN) magnetic field equilibrium configuration is used for the simulation, and W is applied as the PFM. Figure 1 shows the divertor geometry, computational mesh and the sketch of drift flows. In forward Bt (ion B× ▽B drift points to X-point), the E× B drift, including poloidal Er × B drift and radial Ep × B drift, is in the clockwise direction, which drives particles from the outer to the inner divertor (ID) through the private flux region (PFR). While in reversed Bt, i.e. ion B× ▽B drift points away from X-point, the direction of E× B drift flow is opposite. Note that the direction of drift is the same for the D+ and impurity ions.

Figure 1. Computational mesh of EAST device with LSN configuration for SOLPS-ITER simulation. The locations of pumps and Ne impurity puffing are labeled and the sketch of drift flows is illustrated.
Download figure:
Standard image High-resolution imageAs shown in figure 1, two cryo-pumps are set behind the baffle and the recycling coefficient at the pump duct is assumed to be R= 0.9, and the impurity gas is injected near the outer strike point (OSP). These are consistent with our previous work [3]. The input power entering the core–edge interface (CEI, r− rsep = −5.1 cm at outer-mid plane) is set to PCEI = 4 MW, equally divided between electrons and ions. The deuterium ion density at CEI is fixed to nD+,CEI =5.0 × 10¹⁹ m−3. The leakage boundary conditions are imposed at the outer boundary of SOL and PFR for a radial flow of ions, ion and electron energy. The radial flow of ions across the boundary is  , and the leakage factor
  is assumed to be 1.0 × 10⁻³. The radial ion and electron energy flux at the boundary are proportional to sound speed as well, i.e.
  ,
,  , where
  ,
,  ,
,  and
and  . At the targets, a sheath boundary condition is employed. For the momentum equation, the parallel velocity follows
  according to the Bohm–Chodura criterion, where
  is the sine of pitch angle,
  is the E× B drift velocity of plasma particles. For ion and electron internal energy, internal energy flux at targets are specified by
  , where
  is the sheath heat transmission coefficient.
The fuel deuterium (D, D2, D+) and seed Ne impurity (Ne, Ne1−10+) are all included in the simulation. The intrinsic W impurities are mainly produced by physical sputtering. The W atom is handled by EIRENE, while the 74 W ion charge states species are bundled into 23 fluid species, which is called the 'jett' bundle model, as shown in table 1. The 'jett' model can not only make a fairly good treatment on low charge state W ions, but also calculate the core radiation well [13]. The Ne puffing rate is varied from 8 × 10¹⁸ to 1.5 × 10²⁰ Ne atoms/s. The physical sputtering yield  is calculated by the modified Roth–Bohdansky formula [16]. An averaged incident angle of 30° is assumed in the calculation. The redeposition rate of W impurity is set to 0.9. Collision processes for deuterium (such as charge-exchange, ionization, dissociation and recombination) are included in the modeling. The neutral viscosity (nonlinear neutral-neutral collisions) are added through the BGK approach. E× B drift is switched on in this work with 90% drift activated, while the diamagnetic and viscous drifts are not included in the simulation. The 'drift' in the following analysis stands for 'E× B drift'. The H-mode discharge is modeled and the setting of radial particle and thermal transport coefficients is the same as in our previous work [3]. Only steady-state discharge is simulated and transient events such as edge localized modes (ELMs) are not considered.
Table 1. Sketch of bundled W fluid species. The full 74 charge states are bundled to 23 fluid species.
| W fluid species | ||||||||
|---|---|---|---|---|---|---|---|---|
| Bundle model | 1 | 2 | 3 | 4 | 5 | 6 | 7 | 8 |
| W1+ | W2–4+ | W5+ | W6+ | W7+ | W8+ | W9+ | W10–12+ | |
| 9 | 10 | 11 | 12 | 13 | 14 | 15 | 16 | |
| W13–16+ | W17+ | W18+ | W19+ | W20+ | W21–22+ | W23–25+ | W26–27+ | |
| 17 | 18 | 19 | 20 | 21 | 22 | 23 | — | |
| W28–29+ | W30–31+ | W32–33+ | W34–40+ | W41–45+ | W46–55+ | W56–74+ | — | |
3. Simulation results
3.1. Influence of E × B drift on tungsten target erosion and W impurity distribution
The E× B drift has a great impact on the redistribution of particles and energy in the divertor, which may result in divertor in-out asymmetry [5, 17–19]. Figure 2 shows the profiles of electron temperature Te, electron density ne and deposited heat flux qdep along the inner and outer targets (OT) in different Bt directions, with the Ne puffing rate of 1 × 10²⁰ atoms/s. The divertor in-out asymmetry is changed significantly by E× B drift. Power exhaust in the whole region is dominated by Ne impurities, while radiation by the intrinsic W impurity is small (e.g. Prad = 2.54 MW by Ne vs Prad = 0.008 MW by W in the without-drift case). Figure 3 shows the 2D contours of total Ne density nNe and total Ne power radiation density Prad,Ne in the divertor region in different Bt directions. In forward Bt, drift can increase the total Ne ion flux across the radial cut at the X-point through PFR and enhance the Ne recycling from the inner target (IT), while suppressing the Ne recycling from OT. However, the achievement of detachment (when Te is very low) in the ID with drift reduces the Ne atom ionization. Therefore, more Ne atoms could penetrate the upstream region. Overall, the drift can drive the Ne impurity from the outer divertor (OD) to the ID through PFR, thus promoting the achievement of detachment in ID. Meanwhile, the drift also promotes the leakage of Ne impurity in ID to the upstream region in the high field side (HFS), thus the effective ion charge at CEI of OMP  (which is defined to evaluate upstream impurity content) is increased from 2.51 to 2.81 and the total Ne radiation in the core Pcore,Ne is increased from 0.47 MW to 0.83 MW. Radiation in the divertor is mainly contributed by line radiation due to excitation emission from Ne3−5+ ions, which mainly distribute near the separatrix. The front of the net Ne3−5+ source moves upstream of the HFS in forward Bt, which is attributed to the lower Te near the target and the drift flux directed to the upstream region, thus the radiation near the X-point increases significantly, see figure 3(e). As a result, Te and qdep decrease at IT, while they increase significantly at OT, see figures 2(a) and (e). In reversed Bt, the transport of Ne ions from ID to OD through PFR is enhanced by drift, and it induces the increase of Te and qdep at IT due to lower Prad,Ne in ID. However, even the peak Te at OT is reduced compared to the forward Bt case, but it is still higher than the without-drift case. The strong radial drift near the separatrix drives Ne ions to the outer far SOL, thus reducing the radiation near the OSP where the peak Te appears, as shown in figures 3(c) and (f). A shift of ne profile along IT towards the inner common flux region (CFR) in forward Bt can be observed in figure 2(c). Similarly, the ne profile along OT is shifted towards the outer CFR in reversed Bt, see figure 2(d).
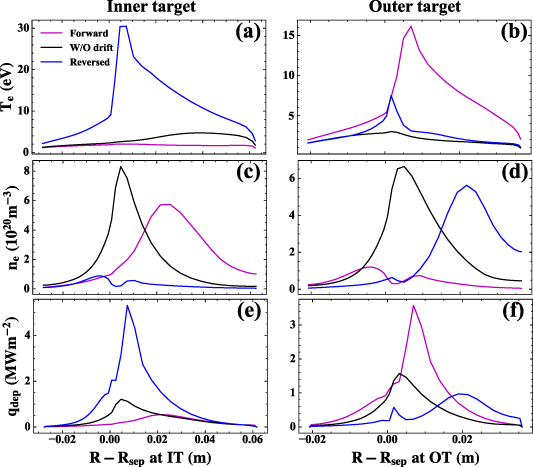
Figure 2. (a), (b) Electron temperature Te, (c), (d) electron density ne, and (e), (f) deposited heat flux density qdep along inner and outer targets of Ne puffing with the rate of 1 × 10²⁰ atoms/s. Three cases, i.e. forward Bt, reversed Bt and without drift, are compared.
Download figure:
Standard image High-resolution image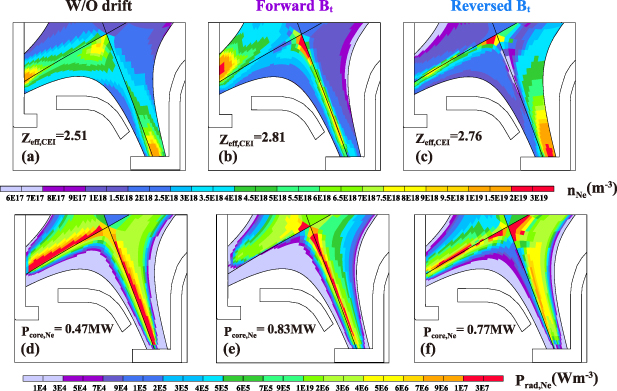
Figure 3. 2D contours of (a)–(c) total Ne density nNe and (d)–(f) Ne power radiation density Prad,Ne in the divertor region with Ne puffing rate of 1 × 10²⁰ atoms/s. Three cases, i.e. forward Bt, reversed Bt and without-drift, are illustrated.
Download figure:
Standard image High-resolution imageAs we know, the influences of drift on the transport of the main plasma (D+) and impurity ions are equally important. The ne and nNe in the divertor may increase/decrease simultaneously. Therefore, the Ne concentration (CNe= nNe/ne) may not be changed significantly by drift. However, Ne impurities play a dominant role in the power radiation, thus it has a greater impact on Te compared to D. It should be noted that since the electric field E is in direct proportion to Te, the E× B drift as well as ion transport are also affected by Ne impurity, which is a strong nonlinear process.
The W target erosion can be roughly calculated by  , where i and j represent incident ion species and different charge states, respectively,
  is sputtering yield and
  is the incident ion flux to the target.
  can be affected by drift in two ways. On the one hand, drift induces the divertor in-out asymmetry, and at least one of the divertors (depends on the Bt direction) becomes hotter than in the without-drift case. As a result,
  is enhanced. On the other hand, drift contributes to the redistribution of charged particles, which influences
  . The total eroded W flux
  along the targets are shown in figure 4. W target erosion is dominated by Ne ions, see the explanation in [4]. In forward Bt, the peak value of Te at OT increases from 3.0 eV in the without-drift case to 16.2 eV. The incident energy of Ne ions is in direct proportion to Te, and an ion with high incident energy has larger
  . Therefore,
  at OT is increased significantly by the drift. The erosion of the IT is suppressed by the drift mainly due to Te being reduced. While in reversed Bt, W erosion at IT is strongly enhanced as Te increases significantly.
  at OT is also increased owing to higher Te near the OSP compared to the without-drift case. The integrated W eroded flux at the IT and OT are summarized in table 2. The total integrated
  values at the targets are increased by two orders of magnitude (from ∼1017 to ∼1019) with the drift term switched on.
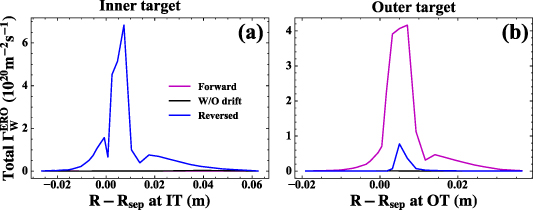
Figure 4. Total eroded W flux along (a) inner and (b) outer targets for Ne puffing rate of 1 × 10²⁰ atoms/s.
Download figure:
Standard image High-resolution imageTable 2. Integrated W eroded flux at inner and outer targets in different Bt directions.
| Integrated W eroded flux at targets (s−1) | ||
|---|---|---|
| Inner target | Outer target | |
| W/O drift |

|

|
| Forward |

|

|
| Reversed |

|

|
Next, the effect of drift on W impurity distribution is investigated. Figure 5 shows the 2D distribution of total W density nW. When the drift term is turned on, nW in the whole simulation domain is increased due to the stronger W impurity source, as shown in table 2. In forward Bt, the integrated  is larger at the OT than that at the IT, while nW in the HFS is higher than that in the low field side (LFS), see figure 5(b). The E× B drift influences the W transport as follows: the sputtered W atoms are ionized, and then they are driven from the outer CFR to the PFR in the OD by radial E× B drift. Thus, nW in PFR increases. The poloidal E× B drift prompts more W ions to transport from OD to ID through PFR. The ratios of the integrated W eroded flux along IT and along OT to the total W ion flux across the radial cut at the X-point through PFR are 0.05 and 8.4, respectively. This indicates that in the HFS the transport dominates the W flux balance, while in the LFS the W erosion is the dominant term. Moreover, some of the W particles in the OD transport to the upstream region in the near SOL of the LFS. It should be noted that the W concentration (CW = nW/ne) in both the HFS and the LFS of the forward Bt case is much higher than that in the without-drift case, which is attributed to the increase of nW, as shown in figures 5(a) and (b). In reversed Bt,
  at both targets is enhanced compared to the case without drift, as illustrated in figure 4, thus nW in the whole region is increased. Due to the transport of W ions from ID to OD through PFR by E× B drift, nW at LFS is higher than that at HFS and even more W atoms are sputtered from IT (table 2), which is contrary to the forward Bt case, see figure 5(c). Figure 6 shows the profiles of nW along the inner (IMP) and outer mid-plane (OMP) in SOL. nW at mid-planes is uplifted by drift. W ions mainly transport to the upstream from the inner divertor entrance (IDE) in forward Bt and from the outer divertor entrance (ODE) in reversed Bt, respectively. Comparing the reversed Bt case with the forward Bt case, nW at both IMP and OMP are higher due to stronger target erosion. It is worth noting that the integrated
  (9.68 × 10¹⁷ s−1) at IT is an order of magnitude higher than that at OT (7.42 × 10¹⁶s−1) in the without-drift case, as indicated in table 2. However, nW along IMP (peak value of 1.80 × 10¹⁴ m−3) is lower than that at OMP (peak value of 2.17 × 10¹⁴ m−3). This is attributed to the impurity leak mechanism in the divertor region. We will turn to the impurity leakage analysis next.

Figure 5. 2D distribution of total W density nW with Ne puffing rate of 1 × 10²⁰ atoms/s, in forward/reversed Bt and without drift cases.
Download figure:
Standard image High-resolution image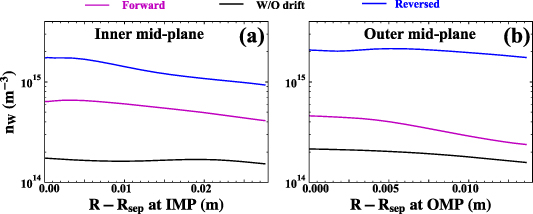
Figure 6. Profiles of W density nW along inner (IMP) and outer midplanes (OMP) with Ne puffing rate of 1 × 10²⁰ atoms/s, in forward/reversed Bt and without-drift cases.
Download figure:
Standard image High-resolution image3.2. Influence of E × B drift on W impurity transport
Sputtered W impurity has two typical transport paths: (1) returning to the targets after ionization (including prompt redeposition, which is defined as the redeposition of W+ during the first gyration) and retaining in divertor; (2) escaping to the upstream region and entering core plasma through cross-field transport. The process of W ions leakage and retention in the divertor dominates W core accumulation.
Friction force with main ions and thermal force due to the ion and electron temperature gradients dominate the parallel momentum balance of impurity. While the contribution of electric force and impurity pressure gradient are small, as illustrated by SOLPS-ITER simulation on DIII-D [20]. The W ion velocity can be deduced by the force balance summed over all the charge states [21]:
where the subscript 'a' denotes the individual charge state of all W plasma species,  ,
,  and
and  represent the mass, density and parallel velocity of the main ion (D+), respectively. The average W parallel velocity is
  with
with  . The rate coefficient for momentum exchange between W and D ions is
  with proportional coefficient
  ,
,  and
and  are kinetic coefficients. The W leakage from the divertor depends mainly on the relative position of the stagnation point (
 ) and the W ionization front. If the sputtered W atom is ionized below the stagnation point, it will return to the targets. When the ionization occurs above the stagnation point, the W ions can escape from the divertor and have the possibility of entering the core plasma. The velocity of each charge state W ions
  almost equals the average velocity
  when terms except for the friction force and thermal force in the force balance are relatively small. The validity of this approximation has been demonstrated in [21]. According to the balance between friction force and thermal force,
  satisfies the equation:

It can be concluded from equation (2) that W ion velocity depends on  .
.
When E× B drift is taken into consideration, the poloidal velocity of W  mainly consists of the poloidal projection of parallel velocity and poloidal Er
× B drift velocity
mainly consists of the poloidal projection of parallel velocity and poloidal Er
× B drift velocity  , and other components such as impurity anomalous diffusion make little contribution. Therefore, thr average poloidal velocity of W
  can be written as

where  is the sine of the pitch angle. Drift may change the position of the W velocity stagnation point, and thus affect the poloidal W flow pattern. Moreover, drift can change
  , which in turn influences
  according to equation (2).
The poloidal W flow pattern with the drift term switched off is first analyzed. The positions of the velocity stagnation point ( ) calculated by
  in equation (1) and the W ionization source
  in the SOL in the without-drift case are illustrated in figure 7(a). The stagnation points are in the vicinity of the ODE at LSF, while there are no stagnation points at HFS. The W erosion peak at OT locates near the OSP, where
  is intense. Nevertheless, most of the W atoms sputtered from the OT are ionized below the stagnation point. These ionized W impurities are retained in the divertor and can hardly escape.
  is compressed to the hot OT region especially near the OSP, while the stagnation points in the corresponding flux tubes are located above the ODE. Therefore, the transport of W ions to the upstream region is suppressedin the near SOL due to W ion flux directed to the OT, which leads to low nW in the near SOL at OD, see figure 7(b). Due to the erosion of the baffle, an obvious W ionization zone can be seen in the far SOL near the ODE, where part of the W ionization appears above the stagnation points. Thus, nW at the OMP is slightly higher than that at the IMP, as indicated in figure 6. W target erosion at the upper divertor by high energy neutral particles contributes to
  in the top region. The
  near the top region is directed towards HFS, thus some W ions can transport to the IMP and deposit onto the IT.
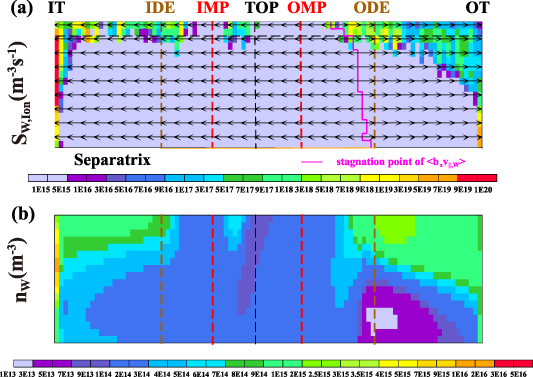
Figure 7. Distributions of (a) W ionization source  and (b) total W density nW in the SOL in the without-drift case. IT, IDE, IMP, OMP, ODE, and OT stand for inner target, inner divertor entrance, inner midplane, outer midplane, outer divertor entrance and outer target, respectively. The black arrows represent the direction of average poloidal projection of parallel velocity
  . The pink line stands for the stagnation points of
  . Ne puffing rate is 1 × 10²⁰ atoms/s.
Download figure:
Standard image High-resolution imageNext, the influence of drift on W impurity transport is investigated. Figure 8(a) shows the positions of the stagnation point ( ) and W ionization source
  in the SOL in forward Bt. The position of the stagnation points is changed by drift flow. As a result, almost all of the sputtered W atoms are ionized below the stagnation point at both LFS and HFS. Thus, the W impurity can hardly escape from the divertor region. Even though
  at the OD is much stronger than at the ID due to the larger
  of the OT, nW at the IDE is higher than that at the ODE, see figure 8(b). This is attributed to the W ions redistribution in the divertor induced by poloidal and radial E× B drift. In addition, the cross-field transport of W ions from the far SOL to the near SOL in the OD driven by radial Ep
× B drift enhances the nW near the separatrix, figure 8(b).
of the OT, nW at the IDE is higher than that at the ODE, see figure 8(b). This is attributed to the W ions redistribution in the divertor induced by poloidal and radial E× B drift. In addition, the cross-field transport of W ions from the far SOL to the near SOL in the OD driven by radial Ep
× B drift enhances the nW near the separatrix, figure 8(b).
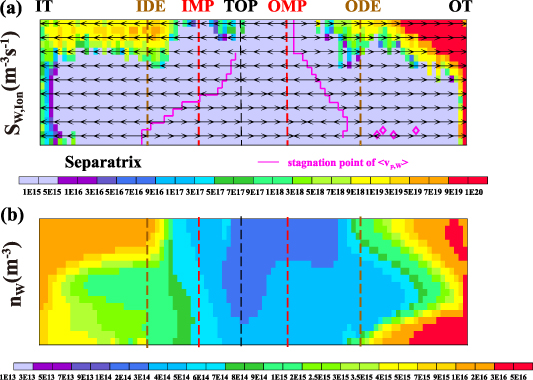
Figure 8. Distributions of (a) W ionization source  and (b) total W density nW in the SOL in forward Bt. The black arrows represent the direction of average poloidal velocity
  . The pink lines stand for the stagnation points of
  = 0 and the pink diamonds are separate stagnation points. The calculation of the stagnation point is
  , where
  is total poloidal W flux and
  is total W density. Ne puffing rate is 1 × 10²⁰ atoms/s.
Download figure:
Standard image High-resolution imageFigure 9 shows the distribution of  and nW in the inner and outer PFR in the without-drift and forward Bt case. The direction of W impurity flux is illustrated in figures 9(a) and (c). In forward Bt, massive
  at some distance away from the OT in the outer PFR comes from dome sputtering, which is contributed by enhanced charge exchange neutrals. These W ions can transport to the inner PFR and then cross the separatrix and enter the ID. Thus, nW is high near the X-point, figure 9(d). As shown in figure 8(a), the stagnation points are located close to the IDE in the near SOL. Therefore, the W can easily escape from the inner PFR to the core region through the X-point. The W flow pattern is similar in reversed Bt and only the direction of drift flow is changed, thus it is not shown here. W impurity transport can also be influenced by the ionization mean free path (MFP) of the W atom [22]
  , where
  is W atom velocity,
  is the ionization rate coefficient. The radial Ep
× B drift, which drives plasma from the inner PFR to the inner CFR, leads to a decline of ne in the inner PFR compared to the without-drift case, see figures 2(c) and (d). Thus,
is the ionization rate coefficient. The radial Ep
× B drift, which drives plasma from the inner PFR to the inner CFR, leads to a decline of ne in the inner PFR compared to the without-drift case, see figures 2(c) and (d). Thus,  in the inner PFR is larger in forward Bt and the ionization front extends closer to the X-point, which contributes to the enhanced W leakage from ID.
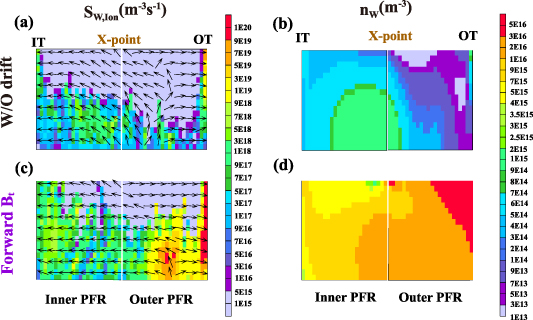
Figure 9. The distribution of (a), (c)  and (b), (d) nW in the inner and outer PFR in the without-drift and forward Bt cases. The black arrows represent the direction of total W particle flux. Ne puffing rate is 1 × 10²⁰ atoms/s.
Download figure:
Standard image High-resolution imageTo quantitatively analyze the effect of E× B drift on W transport, the total W flux and E× B drift W flux integrated over different segments are summarized in table 3. The sketch of corresponding segment locations is shown in figure 10(b), where L1 is the interface of inner and outer PFR, L2 and L3 are radial surfaces of ODE and IDE, respectively, L4 and L5 are segments between the X-point and strike points. The radial Ep × B drift facilitates the cross-field transport from the outer CFR to the outer PFR and the integrated E× B drift flux through L4 is −7.66 × 10¹⁸ s−1, which is comparable to the integrated total W flux of −5.54 × 10¹⁸ s−1. Thus, nW in the PFR is increased. The integrated total W flux (−4.72 × 10¹⁷ s−1) from the OD to the ID through L1 is dominated by poloidal Er × B drift flux (−4.66 × 10¹⁷ s−1), which conduces to W ion redistribution in the divertor. W ions in the inner PFR enter the SOL through L5 by radial Ep × B drift, and the integrated drift flux (2.59 × 10¹⁷ s−1) is almost a factor of two larger than the integrated total W flux (1.40 × 10¹⁷ s−1), as shown in table 3. Both the integrated total W flux and Er × B drift flux through L2 is directed towards the OT, thus W ions in the OD can hardly transport to the upstream region in the LFS. At the IDE, the integrated Er × B drift flux through L3 is directed upstream, while the integrated total W flux points towards the IT. Overall, both of the integrated total W fluxes along the IDE and the ODE are directed towards targets. The net W flux from upstream is balanced by (1) W impurity escaping from the X-point and (2) the W atoms ionized above the divertor entrance. Note that the E× B drift flux may be higher than the total flux, mainly due to the components of total flux being in different directions.
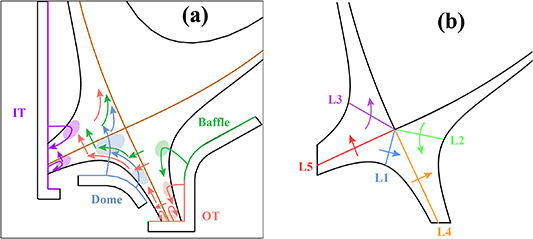
Figure 10. (a) Sketch of W impurity transport directions in forward Bt. (b) Sketch of different segments to calculate the integrated total and E× B drift W flux. The positive values of W flux in table 3 correspond to the direction of arrows in (b).
Download figure:
Standard image High-resolution imageTable 3. Total flux and E× B drift flux of W impurity integrated over different segments as shown in figure 10(b) in forward Bt.
| Total flux (s−1) | E × B drift flux (s−1) | |
|---|---|---|
| From OD to ID (L1) |

|

|
| From OD to upstream (L2) |

|

|
| From ID to upstream (L3) |

|

|
| From outer CFR to outer PFR (L4) |

|

|
| From inner PFR to inner CFR (L5) |

|

|
The W impurity transport in forward Bt can be summarized as follows, and the sketch of W impurity transport is given in figure 10(a).
- (a)Retention in the divertor region: the sputtered W atoms from the targets and baffle are ionized below the velocity stagnation points, thus flowing back towards targets.
- (b)Redistribution in the divertor region: W particles produced in the OD transport to the ID through PFR, which is dominated by the combined effect of radial and poloidal E× B drifts.
- (c)Leakage from the divertor region: W ions in the PFR (including ionized W source from the dome, baffle and targets) transport through the separatrix by radial E× B drift and leak from the ID to the upstream region in the near SOL. There are also a few W ions from the PFR entering the OD through cross-field transport and flowing to upstream region in the near SOL of LFS.
3.3. Influence of Ne puffing rate on W transport and accumulation in core
Seeded impurities have a great impact on divertor plasma and thus change  at targets. When the impurity seeding rate is increased, radiation exhaust caused by impurities is enhanced, which can prompt the achievement of divertor detachment [10, 23, 24]. Drifts may trigger the movement of the radiation front and affect plasma parameters in the divertor [25, 26]. Moreover, the production and transport of W impurity are varied by drift. Therefore, the Ne puffing rate is scanned to further investigate the influence of impurity levels on target erosion and W transport. The magnetic field is fixed to forward Bt, and only the puffing rate is varied. The without-drift cases are used for comparison. In forward Bt, when the puffing rate is low, the corresponding E is large. As a result, E× B drift is enhanced significantly, which causes a serious numerical converge problem. Therefore, there are no values for forward Bt for low puffing rates in the present work.
Figure 11 shows the peak value of electron temperature  , peak
  and integral
  at the IT and OT as functions of the Ne puffing rate. In without-drift cases,
  and peak
  at the OT are higher than IT when the puffing rate is low (<7 × 10¹⁹ Ne atoms/s), see figures 11(a) and (b). However, from figure 11(c) it can be seen that the integral
  at the IT dominates over the OT due to the larger W erosion area of the IT. The effect of drift is more obvious in the high recycling regime (upstream Te is much higher than that at targets and
  at targets) than that in the low recycling regime [5, 27, 28]. In forward Bt, the divertor in-out asymmetry is enhanced drastically by drift in the high recycling regime and Te at the OT is increased significantly compared to without-drift cases, thus W erosion at the OT is aggravated remarkably and the integral
  at the OT is much higher than that at the IT, see figure 11(c). It should be noticed that
  at the OT is similar (∼30 eV) with the Ne puffing rate of 1 × 10¹⁹ atoms/s in without-drift case and 7 × 10¹⁹ atoms/s in the forward Bt case, while both the peak
  and integral
  at the OT in the drift case are much higher than that in the without-drift case, with a difference of about an order of magnitude. The suppressed W erosion without the drift term activated is due to the fact that incident Ne ion flux is much smaller than that of the drift case. Therefore, we can see that the W source from targets is generally enhanced by drift.
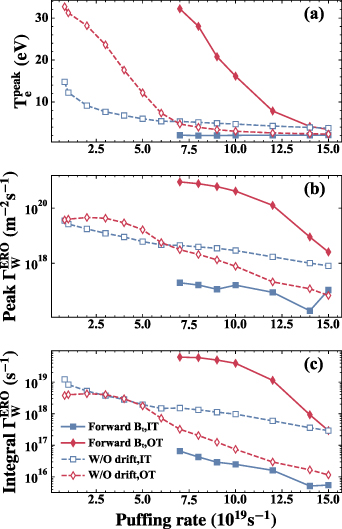
Figure 11. (a) Peak value of electron temperature  , (b) peak
  and (c) integral
  at both targets as functions of Ne puffing rate. Forward Bt and without-drift cases are plotted in solid and dashed lines, respectively.
Download figure:
Standard image High-resolution imageTo determine which factor dominates the W transport and accumulation in the core region, the W concentration at the CEI of the midplanes  as functions of
  at the OT (
 ) in the without-drift case and forward Bt case are given, and the correlations between integrated
  at targets and
  are also established, as shown in figure 12. In the without-drift cases,
  at the OMP is higher than at the IMP, even the W source from the IT is predominant, see figures 11(c) and 12(a). This is due to the fact that W ions escape easily from the OD in the far SOL while W ions tend to remain in the ID, as discussed in section 3.2. The integrated OT
  first increases when
  is lower than about 30 eV, followed by a drop with decreasing
  , as shown in figure 12(c). In forward Bt cases, a similar trend of integrated OT
  with
with  is also observed, see figure 12(d). This is due to the fact that inadequate seeded impurities can give rise to larger
  depending on the competition between lower Te and increased incident Ne ion flux [4], which is in accordance with the measurement of sputtered W flux during the Ne seeding experiment on EAST [29]. However, larger
  does not necessarily raise
  (figures 12(a) and (c)) since the divertor regime also plays an important role in W accumulation in the core, which was demonstrated by our previous work [3] and DIVIMP simulations on EAST [22].
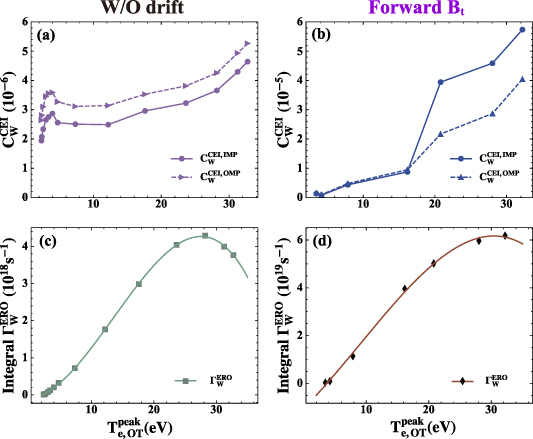
Figure 12.
 at both midplanes as functions of
  in (a) without-drift and (b) forward Bt cases, solid lines and dash lines stand for
  and
and  , respectively. The correlations between the integral
  at the OT and
  in (c) without-drift and (d) forward Bt cases.
Download figure:
Standard image High-resolution imageIn forward Bt, the W impurity source mainly comes from the OT, as shown in figure 11(c).  at the IMP is much higher than at the OMP when
  becomes larger than 20 eV, see figure 12(b), which is attributed to the influence of E× B drift on W transport. Higher
  results in larger electric potential, which corresponds to higher electric field, thus the E× B drift is enhanced [5, 30]. W leakage is reinforced and
  at midplanes is increased consequently.
Figure 12(b) also demonstrates that drift can vary the asymmetry of W impurity poloidal distribution by affecting the W source and impurity transport. We define the degree of  asymmetry as
  , where the positive value indicates
  at the IMP is higher than that at the OMP and the negative value indicates
  at the IMP is lower than that at the OMP. Figure 13 shows AD as functions of
  in both cases. In without-drift cases, AD varies slightly (between −0.15 and −0.25) with
  . It should be noticed that the absolute value of AD becomes smaller in without-drift case as
  increases. The reason for the reduced asymmetry is that the velocity stagnation point of W impurity also exists below the
  front in the near SOL region of the LFS, thus W impurity from the IT can escape from the divertor region. In forward Bt, AD ∼ −0.15 when detachment (
 5 eV) is achieved in the OD. In the attached regime (
 > 5 eV), AD is increased to 0.82 with
  = 20.8 eV due to the enhanced drift flow. AD decreases to some extent as puffing rate declines with
  , see figure 13. This is due to the fact that the total integral
  at targets, which is determined by the incident energy (i.e.
  ) and incident Ne ion flux, rises relatively slowly and then falls with
  , as shown in figure 12(d). With the consideration of drift, the poloidal asymmetry in W distribution is only obvious when one divertor is much hotter and has a stronger W source than the other, thus it leads to considerable W ion transport to another divertor through the PFR and then the leakage to the upstream region due to E× B drift. When detachment is achieved in both divertors, the W source from both targets declines and the redistribution of W impurity is weakened owing to the reduced drift flow.
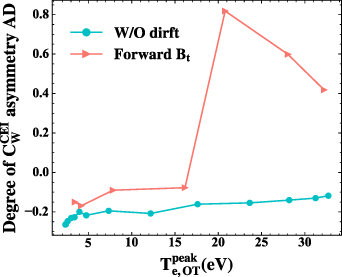
Figure 13. Degree of  asymmetry AD as functions of
  in without-drift and forward Bt cases.
Download figure:
Standard image High-resolution imageThe average W concentration in the core plasma  is also evaluated to clarify the relationship between the W source and accumulation in the core. Figure 14 displays the
  as functions of total integral
  at targets. It can be seen that when
  is smaller than 1019 s−1, the drift can reduce
  significantly with the same
  compared to the without-drift case. As we have discussed above, W ions in the core mainly come from the HFS in forward Bt and the LFS in the without-drift case, respectively. Drift flow is decreased after divertor plasma detachment and thus fewer W ions transport to HFS, which gives rise to the suppressed W accumulation in the core compared to without-drift cases.
  decreases as the total integral
  at the targets reduce in forward Bt, which can be ascribed to the suppressed W erosion and enhanced W screening in the divertor. With a high puffing rate, Te at the OT is reduced significantly, thus
  is reduced due to the low sputtering yield, and the corresponding ne in the divertor becomes large. As a result,
  is reduced and W impurities retention in the divertor is increased. However, when the total integral
  at the targets is higher than ∼1019 s−1,
  is increased remarkably by drift. This is due to the fact that Te at the OT is high with a lower puffing rate (<1.2 × 10²⁰ atoms/s), as can be seen from figure 11(a) and the OD is in the attached regime, which contributes to the intense W sputtering at the targets and strong W leakage from the divertor. Plenty of W ions transport from the OD to the ID through the PFR by E× B drift and escape from the divertor in the near SOL at the IDE, as discussed in section 3.2. Therefore, W accumulation in the core is enhanced by the drift. In general, W accumulation in the core becomes severe when the divertor in-out asymmetry is enhanced by drift in the attached regime, while the W content in the core can be controlled effectively in the detached regime of both divertors when considering drifts.
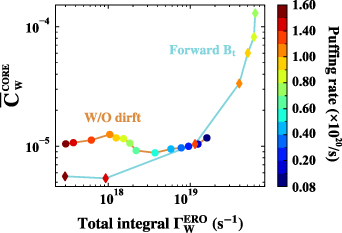
Figure 14. Average W concentration at CEI  in forward Bt and without-drift cases as functions of total integral
  at targets. Corresponding Ne puffing rate is also shown.
Download figure:
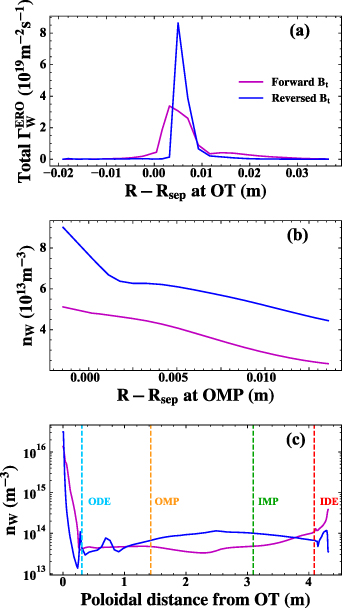
Standard image High-resolution imageTo directly illustrate the effect of drift on the W transport and the core accumulation, two cases in different Bt directions, with similar total integrated  at the targets, were chosen. The two cases are converted from the drift cases discussed in sections 3.1 and 3.2. Here, only physical sputtering from targets is included (erosion from other wall elements is turned off), and the redeposition rates at the IT and OT are varied so that the W source in forward Bt is in accordance with that in reversed Bt. The integrated
  at the OT is 3.05 × 10¹⁸ s−1 and 3.00 × 10¹⁸ s−1 in forward and reversed Bt, respectively, and the eroded W profiles at the OT are shown in figure 15(a).
  at the IT is two orders of magnitude smaller than at the OT. As we can see from figure 15(b), nW along the OMP in reversed Bt is higher than in forward Bt, especially in the near SOL. W ions are driven toward the separatrix from the outer CFR due to Ep
× B drift in forward Bt, while they are driven away from the separatrix in reversed Bt, thus nW below the ODE in the near SOL of the OD is higher in forward Bt than in reversed Bt, see figure 15(c). It is also visible in figure 15(c) that in the near SOL of the ID, nW in forward Bt is also higher than in reversed Bt. In forward Bt, W ions transport from the OD to the ID through PFR by Ep
× B and Er
× B drift, while W ion flux is in the opposite direction in reversed Bt, which contributes to higher nW of HFS in forward Bt compared to reversed Bt. Nevertheless, we should keep in mind that the background plasma in the OD is different between forward and reversed Bt. The drift flux is stronger due to the higher Te of the OD in forward Bt. Thus, it can be inferred that W transport caused by E× B drift is of vital importance and has a great influence on core accumulation.
at the IT is two orders of magnitude smaller than at the OT. As we can see from figure 15(b), nW along the OMP in reversed Bt is higher than in forward Bt, especially in the near SOL. W ions are driven toward the separatrix from the outer CFR due to Ep
× B drift in forward Bt, while they are driven away from the separatrix in reversed Bt, thus nW below the ODE in the near SOL of the OD is higher in forward Bt than in reversed Bt, see figure 15(c). It is also visible in figure 15(c) that in the near SOL of the ID, nW in forward Bt is also higher than in reversed Bt. In forward Bt, W ions transport from the OD to the ID through PFR by Ep
× B and Er
× B drift, while W ion flux is in the opposite direction in reversed Bt, which contributes to higher nW of HFS in forward Bt compared to reversed Bt. Nevertheless, we should keep in mind that the background plasma in the OD is different between forward and reversed Bt. The drift flux is stronger due to the higher Te of the OD in forward Bt. Thus, it can be inferred that W transport caused by E× B drift is of vital importance and has a great influence on core accumulation.
Figure 15. (a) Total  at OT, (b) nW in the SOL along OMP and along the third flux tube in the SOL (ix = 20) in forward and reversed Bt with only sputtering from targets. The total integral
  at targets are similar for the two case (∼3.00 × 10¹⁸ s−1), and the Ne puffing rate is 1 × 10²⁰ atoms/s.
Download figure:
Standard image High-resolution image
4. Summary and conclusions
SOLPS-ITER modeling has been carried out to ascertain the completely self-consistent W impurity behaviors, including W production, transport and accumulation in the core during external impurity seeding (Ne) with consideration of drift on EAST. W target erosion in forward and reversed Bt cases is evaluated and compared to the without-drift case.
We find that W erosion is influenced significantly by the E× B drift when strong divertor in-out asymmetry occurs during Ne seeding, due to both physical sputtering yield ( ) and incident ion flux (
 ) being changed by drifts. This is in agreement with experiment observations [20, 31–36]. E× B drift also plays an important role in W impurity transport. The relative position of the stagnation point of W ion velocity and the W ionization front, which is a decisive factor of W retention in the divertor, is varied by drift. The transport of W ions through the PFR becomes dominating when the drift term is switched on, thus W ions are redistributed between the inner and the outer divertors.
W impurity behavior depends on the divertor condition. This is illustrated by a Ne puffing scan that shows W erosion at the OT is aggravated by drift due to the higher Te in forward Bt compared to without-drift cases. To obtain similar Te, a lower puffing rate is needed in forward Bt than in without-drift cases. Therefore, the W erosion is smaller due to lower incident Ne ion flux in without-drift cases, which suggests that W source from targets is generally increased by drift. We also find inadequately seeded Ne may lead to larger  , which is in agreement with our previous modeling work on EAST [4] and the nitrogen seeding experiment on JET [37]. W accumulation in the core is also linked to divertor regimes. In the attached regime (
 > 5 eV), high
  and intense drift flux give rise to serious W accumulation in the core and the poloidal asymmetry of W distribution is increased significantly. The W source and W concentration in the core can be controlled within a lower level when both divertors are in the detachment regime. For the cases with similar total integrated
  at targets, nW in the upstream region of the reversed Bt case is higher than in forward Bt, especially in the near SOL.
This work reveals that drift has a great impact on the W behaviors. Sufficient Ne seeding to induce the plasma detachment can effectively reduce W accumulation in the core. It can be applied to the impurity control in the fusion device. However, the erosion of the first wall by the charged particle, which may be very important in the fusion reactor, is not included in the present work. This can lead to the underestimation of the W concentration in the core. The new version of SOLPS-ITER with extended grids [38] will be used in future work to consider the plasma first wall interaction. Moreover, the process of prompt redeposition is not considered in the fluid treatment of W impurities, and it requires the kinetic treatment of the W impurity [39].
Acknowledgments
This work is supported by National Natural Science Foundation of China under Grant Nos. 12122503, 12235002, 12261131496, National Key R&D Program of China No. 2018YFE0301101, Dalian Science & Technology Talents Program No. 2022RJ11, Inter-disciplinary and Collaborative Teams of CAS.