


Abstract
The plasma-beta effect on the n = 1 resonant magnetic perturbation (RMP) field penetration in purely radio-frequency (RF) wave heated discharges has been investigated in EAST. The experimental results show that the dependence of the threshold RMP coil current for field penetration,  , on the total absorbed power Ptot scales as approximately
  , indicating that the error-field tolerance is improved with increasing RF power. This is benefited by the increased electron perpendicular flow dominated by a counter-current electron diamagnetic flow with increasing RF power. However, theoretical scaling in cylindrical geometry overestimates the power index. Assuming an additional term
  for the normalized beta in the scaling, it is shown that the fitted
  from the experimental observation is around −1, indicating a degradation effect of plasma beta. To clarify the underlying physics of the plasma-beta effect that was not included in the theoretical scaling in cylindrical geometry, the MARS-Q code with full toroidal geometry is employed for simulation of nonlinear field penetration (Liu et al 2013 Phys. Plasmas20 042503). The MARS-Q simulation results reproduce the
  dependence well, and hence the Ptot scaling of the threshold current in experimental observations. The main reason for this is that the net total torque, which is mainly contributed by the neoclassical toroidal viscosity (NTV), increases with increasing plasma
  . The results demonstrate that the nonlinear toroidal coupling effect via NTV torque plays an important role in determining field penetration, even in cases with relatively low
 ![$\beta_\textrm N \in [0.3,0.6]$](https://content.cld.iop.org/journals/0029-5515/63/7/076004/revision2/nfaccdedieqn7.gif) , which is far less than the no-wall beta limit.
, which is far less than the no-wall beta limit.
Export citation and abstract BibTeX RIS

Original content from this work may be used under the terms of the Creative Commons Attribution 4.0 license. Any further distribution of this work must maintain attribution to the author(s) and the title of the work, journal citation and DOI.
1. Introduction
Non-axisymmetric magnetic fields caused by misalignment in the coil design and construction inevitably exist in tokamak devices. These fields, commonly called error fields, can be resonant with the rational surface of plasmas. One of the important phenomena, due to the interaction between the plasmas and error fields, is that the rotating mode will be locked to the external helical field, called error-field penetration [1–3]. The field penetration can occur with the non-axisymmetric field as small as  , which is difficult to avoid in engineering design and installation [3–5]. Here,
  and
and  represent the radial error fields and the equilibrium toroidal magnetic field strength, respectively. Field penetration or mode locking is particularly prone to occurring during the plasma-current ramp-up phase with low density in experiments. This is generally thought to be due to the
  resonant component of error-field-induced mode locking, where (
 ) refers to the poloidal and toroidal mode numbers, respectively. The locked modes can degrade the confinement and even stimulate plasma discharge termination [3, 6, 7]. Hence, the extent of the parameter dependence for error-field penetration has been appreciated in recent decades. Resonant magnetic perturbation (RMP) or error-field correction coils, as types of effective control strategies, are actively used to investigate the error-field locked mode and correct the intrinsic error fields [3–20], which help to extrapolate the error-field tolerance to ITER. Furthermore, RMPs have been applied in many tokamak devices to control edge localized modes (ELMs) [21–25].
The empirical scaling of the error-field penetration threshold on various plasma parameters has been obtained in many tokamak devices. The general scaling can be expressed as  , where
  and
and  are the density and toroidal magnetic field, respectively. Here, R0 and q95 represent the major radius and safety factor at the 95
 poloidal magnetic flux, respectively. Nevertheless, the experimental scalings on the penetration threshold show substantial discrepancies among various tokamaks. For instance,
  is observed in JET [4, 5], DIIID [4, 6, 26], COMPASS-D [4] and MAST [16], while
  is observed in NSTX [17], J-TEXT [14] and EAST [10]. Toroidal field and q95 scalings have been studied in various tokamaks (i.e. JET, MAST, NSTX, C-MOD and EAST) [4, 11, 16, 18, 19]. In these results, the scaling index αB
changes from −2.9 to −1, and αq
ranges from −0.6 to 1.6. Differences in experimental scaling pose a challenge to predicting error-field penetration tolerance for future fusion reactors.
is observed in NSTX [17], J-TEXT [14] and EAST [10]. Toroidal field and q95 scalings have been studied in various tokamaks (i.e. JET, MAST, NSTX, C-MOD and EAST) [4, 11, 16, 18, 19]. In these results, the scaling index αB
changes from −2.9 to −1, and αq
ranges from −0.6 to 1.6. Differences in experimental scaling pose a challenge to predicting error-field penetration tolerance for future fusion reactors.
Theoretical studies of error-field penetration have been advanced to understand the experimental scalings. The locked-mode theory based on single-fluid assumption deduces the dependence of the error-field penetration threshold on various basic plasma parameters ( , τν
,
, τν
,  and f0) [27–29]. Here, τν
is the viscosity diffusion time, while
and f0) [27–29]. Here, τν
is the viscosity diffusion time, while  and f0 are the electron temperature and the plasma rotation. Single-parameter scanning accompanies the variations of multi-parameters in experiments. By taking into account experimental dependences of these parameters, the field penetration theory has been well validated by a series of experiments in the EAST tokamak [10–12].
Recently, it has been shown that the error-field tolerance for both ideal magnetohydrodynamic (MHD) and tearing-mode stability can be significantly reduced in high- neutral beam injection (NBI) heated plasmas, especially in low-input torque plasmas in DIII-D [30, 31]. Here,
  , where β is the ratio of the plasma thermal pressure to the magnetic pressure, a is the minor radius of the plasma, B0 is the toroidal magnetic field and
  is the plasma current. It is worth mentioning that the existing lock-mode theory [27–29] is established in cylindrical coordinates. In high-beta plasmas, toroidal effects become important [32–34]. The coupling between different poloidal harmonics can generate an additional resonant component due to toroidicity [35–38]. Another toroidal effect, i.e. neoclassical toroidal viscosity (NTV), induced by non-resonant magnetic field perturbations, can generate a global torque that damps plasma toroidal flow [39–43]. The coupling between different toroidal harmonics has also been directly observed in EAST [44]. The NTV effect on nonlinear field penetration may play an important role in this case. Nonlinear field penetration theory in toroidal geometry is still under investigation. The plasma-beta-induced toroidal coupling may play a crucial role in the nonlinear process of field penetration.
Future fusion devices like ITER are expected to have low NBI torque or purely radio-frequency (RF) heating to access stable high-performance plasma operation. Thus, error-field tolerance in RF heated plasmas deserves study. The plasma-beta effect on field penetration may also be important for understanding ELM control. The toroidal coupling effect in the nonlinear field penetration stage is still not well understood. Therefore, we carried out this study on the dependence of the error-field penetration threshold on RF heating power in the EAST tokamak.
The rest of the paper is organized as follows. In section 2, the experimental setup is introduced. In section 3, the observation of experimental scaling on RF heating power is presented and compared with the theoretical scaling. Detailed nonlinear simulations of n = 1 RMP field penetration by the MARS-Q code with full toroidal geometry are presented in section 4. Finally, the paper is summarized in section 5.
2. Experimental setup
EAST is a fully superconducting tokamak equipped with advanced heating schemes [45]. The RMP system has been successfully applied for studies in error-field penetration and ELM control in EAST [9, 25, 46, 47]. Two sets of eight RMP coils are located in the upper and lower regions of the low-field mid-plane inside the vacuum vessel. Each coil has four turns, and the maximum current in a single turn is 4.0 kAt. The RMP system can produce a rotating resonant field (n = 1–3) and static ones (n = 1–4). Here, n is the RMP toroidal mode number. Furthermore, magnetic diagnostics, dedicated to the detection of plasma responses to RMP fields, have been developed in EAST [9, 44]. Two arrays of saddle loops and magnetic probes are located near the two RMP coil arrays, and three arrays of saddle loops and magnetic probes cover both the low- and high-field sides.
To study the error-field tolerance threshold in RF heated plasmas, scanning of auxiliary heating power supplied by a lower hybrid wave (LHW) and electron cyclotron resonant heating system has been performed with a fixed RMP configuration, which is static n = 1 RMP with an even coil connection [12]. Two sets of RF power scans with  and
and  , respectively, have been employed in this paper. The toroidal magnetic field on the magnetic axis is kept constant around
  T. The detailed dependences of the electron density
  , electron temperature
  , energy confinement time
  and mode frequency f0 on the total absorbed power for the two sets of discharges are summarized in figure A1 in appendix
Figure 1 shows the temporal evolution of (a) the n = 1 RMP coil current IRMP, (b) the n = 1 radial magnetic response  , (c) the electron density
  , measured from hydrogen cyanide laser interferometer diagnostics, and (d) the normalized plasma-beta
  from EFIT reconstruction for three example discharges with
  and different RF heating powers. A slow ramp up of the RMP coil current IRMP up to 3.0 kA from 3.0 s to 4.5 s is applied, as shown in figure 1(a). The marked vertical dashed lines indicate the onset of field penetration, at which time a sudden increase in
  can be observed, as shown in figure 1(b). The dominant harmonic of the measured penetration field is
  . The line-averaged density is kept almost constant at around
  in this case, as shown in figure 1(c). The normalized plasma beta increases with increasing LHW power. This shows that the threshold RMP coil current increases with increasing heating power, which is different from previous high-beta experiments with NBI heating in DIII-D [30, 31].
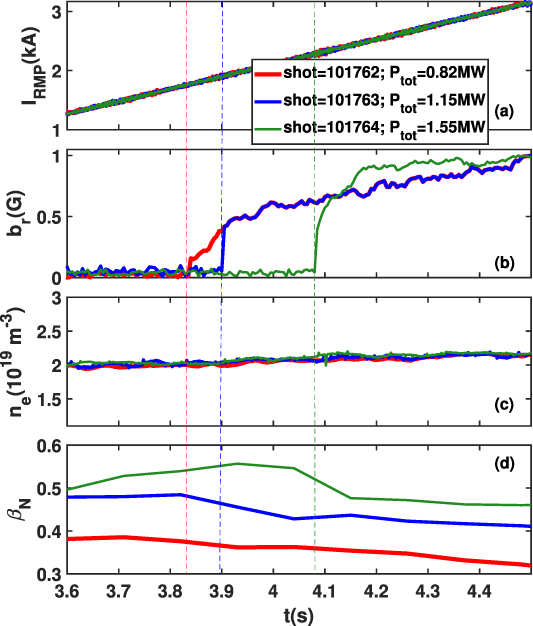
Figure 1. Error-field penetration experiments for different LHW heating powers in three EAST L-mode discharges with  . Shown are temporal evolutions of (a) the RMP coil current, (b) measured n = 1 radial magnetic response perturbations, (c) the electron density and (d) plasma
  . The vertical dashed lines indicate the onset of field penetration.
Download figure:
Standard image High-resolution image3. Experimental observation of n = 1 RMP penetration scaling on heating power and comparison with theoretical scaling
3.1. Observation of field penetration scaling on heating power
Figure 2 shows a summary of the threshold RMP coil current  for field penetration as a function of the total absorbed power Ptot [48] under two sets of experimental scans with
  (red squares) and
  (blue stars), respectively. With the increase in heating power, the penetration threshold increases accordingly. Assuming
  , the power scalings are around
  and
and  , which are quite close. This suggests that the error-field tolerance is enhanced with increased RF heating power. To understand the underlying physics, it will be compared in detail to that from theory and modeling in the following.
Figure 2. Comparison of the observed (symbols for experimental data and solid lines for fitting curves) n = 1 RMP field penetration threshold current  scaling on the total absorbed power Ptot with theoretical predictions (dotted lines), under two experimental scans with
  (red squares) and
  (blue stars), respectively. Equation (1) is used for the theoretical scaling.
Download figure:
Standard image High-resolution image3.2. Comparison with scaling based on the theory in cylindrical coordinates
There is no explicit theoretical scaling on heating power. However, the physical quantities involved in field penetration [10–12] are usually changed during a heating power scan. Let us write these dependences as  for electron density,
  for electron temperature,
  for momentum diffusion time and
  for mode frequency f0 on the total power, where the indexes
  for the two sets of discharges are summarized in table 1, which are evaluated from the experimental observations presented in appendix
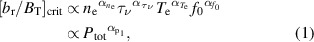
Table 1. The contributions from different quantities to Ptot scaling  based on theoretical scaling for
  and
and  .
.
| i |

|

|

|

| q95 |
|---|---|---|---|---|---|
| αi | 7/16 | −7/16 | 9/32 | 5/8 | |

| 0.16 | −0.66 | 0.56 | 0.25 | 4.70 |

| 0.10 | 0.30 | 0.16 | 0.16 | |

| 0.72 | ||||
| αexp | 0.35 | ||||

| 0.00 | −0.70 | 0.28 | 0.15 | 5.30 |

| 0.00 | 0.30 | 0.10 | 0.10 | |

| 0.50 | ||||
| αexp | 0.30 | ||||
where  , and
, and  ,
,  ,
,  and
and  . In this study, we determined that the theoretical regime lies in the Waelbroeck regime [27]. The method of how to determine the theoretical regime using experimental parameters is discussed in detail in appendix A in [10].
Figure 2 shows the comparison of Ptot scaling between the theory using equation (1) (dotted lines) and the observation (solid lines). It is shown that the evaluated theoretical scaling also gives a positive power index  , which is qualitatively consistent with the observation. Table 1 gives the individual contribution from each quantity (
 ,
,  ,
,  ,
,  ) to
) to  in theory. It is shown that the dependences of all the quantities can contribute a positive
  . In the
  case, the density is kept constant, and hence it does not have any contribution. This suggests that shorter momentum diffusion time, higher electron temperature and higher mode frequency (in the counter-current direction) induced by additional RF heating power can increase the error-field penetration threshold.
Compared to the NBI heating cases in the other studies, the key difference in the RF heating case might be the mode frequency contribution. In RF heated plasmas, the plasma flow is typically small [25], and the increase in mode frequency is mainly contributed from the electron diamagnetic frequency (in the counter-current direction) because of two fluid effects [49–51], as discussed in appendix
Although the theory also gives a positive power index, the theoretical scaling overestimates the power index compared to the observed ones. The evaluated theoretical power indexes are  (for
(for  ) and
) and  (for
(for  ), which are larger than the experimental results
  . If the plasma is located in the Rutherford and Transition regime [27, 29], the power indexes are 1.0 (0.7) and 0.9 (0.6) for
  (
( ), which are even larger than that in the Waelbroeck regime. The discrepancy between experimental and theoretical scaling will be clarified in the following.
3.3. Plasma-beta effect on field penetration
Previous study on high-beta plasmas in DIII-D [30] showed that high plasma beta can amplify the error field and reduce the error-field tolerance. Therefore, the overestimated power index may be caused by neglecting the plasma-beta effect in the field penetration theory [27]. The mode toroidal coupling effect due to plasma beta cannot be included in the classical field penetration theory in cylindrical coordinates.
Figure 3 shows the dependence of normalized plasma-beta  on heating power. The
  increases from 0.3 to 0.6 with increasing RF heating power for the two cases. This discrepancy may be explained by including additional plasma-beta dependence in the theoretical scaling. When comparing the Ptot scaling between the two cases, the experimental scaling results are almost identical, although the theory predicts a higher threshold current for the lower q95 one with a slightly higher
  . This may also be due to the higher beta effect in the lower q95 case.
Figure 3. Dependence of the normalized plasma-beta  on the total absorbed power Ptot under two experimental regimes with
  (red squares) and
  (blue stars), respectively.
Download figure:
Standard image High-resolution imageLet us introduce an additional  term in equation (1), and the revised empirical field penetration scaling, including the plasma
  effect, is written as
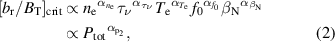
where  and
and  for the two cases are shown in figure 3.
Using  , the contribution from plasma-beta
  can be evaluated, as shown in table 2. The index
  in both cases with
  and
and  is close to around −1. This suggests that the field penetration threshold is inversely proportional to the normalized plasma beta, which is qualitatively consistent with the error-field tolerance in high-beta plasmas in DIII-D [30]. The minor difference in the
  in the two q95 cases may be due to the fact that the plasma is more stable in the higher q95 case, which reduces the plasma response.
Table 2. The contribution of  to Ptot scaling in the two cases.

|

|

|

| |
|---|---|---|---|---|

| 0.35 | 0.72 | 0.35 | −1.06 |

| 0.30 | 0.50 | 0.25 | −0.80 |
Figure 4 shows the correlation between the observed threshold current  and the theoretical scaling in equation (1) (blue symbols) and the revised scaling in equation (2) with
  (red open symbols). The square symbols represent the experimental data in
  , and the star symbols are for
  . It shows that the revised scaling in equation (2) with a fixed
  can reproduce both cases well. This indicates that the inclusion of plasma
  in equation (2) can further make up the deviation between theory and observation in field penetration. The no-wall plasma-beta limit is around 2.25, as shown in figure B1 in appendix
  , the plasma beta still has an impact on field penetration.
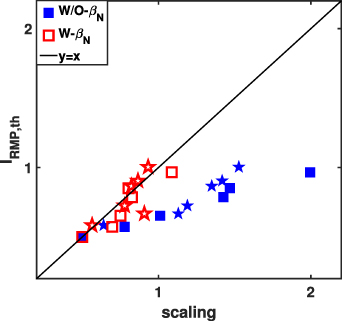
Figure 4. The measured threshold  for field penetration versus that predicted by the theoretical scaling in equation (1) (blue symbols) and the revised version in equation (2) with
  (red open symbols).
Download figure:
Standard image High-resolution image4. Nonlinear modeling of n = 1 RMP field penetration with full toroidal geometry
In previous studies, nonlinear field penetration was usually simulated using resistive MHD codes with cylindrical coordinates [12, 52, 53]. However, the toroidal coupling effect due to plasma beta cannot be taken into account. To study the plasma-beta effect on RMP field penetration, the MARS-Q code with full toroidal geometry and the NTV effect on rotation braking are employed to simulate the nonlinear field penetration [54], which has been applied in field penetration studies in [54–56].
4.1. Numerical models for nonlinear field penetration
In this paper, the plasma response to external n = 1 RMP fields is studied using the single-fluid resistive MHD equations [54]


where ξ is the plasma displacement, b is the perturbed magnetic field, j is the perturbed plasma current, v is the perturbed fluid velocity, p is the perturbed plasma pressure, and the variables
B
,
J
, P and ρ are the equilibrium magnetic field, current, pressure and density, respectively. Here,  is toroidal equilibrium flow, where R, Ω and
  represent the plasma major radius, toroidal rotation frequency and geometrical toroidal angle of the torus, respectively. The parameters Γ = 5/3 and η denote the adiabatic heating coefficient and plasma resistivity, respectively. The last term of equation (4) describes the parallel sound wave damping, where
  is the numerical damping coefficient. In this work, strong parallel sound wave damping (
 = 1.5) is assumed to simulate the ion Landau damping. Here,
  is the parallel wave number, where m and q are the poloidal harmonic number and safety factor, respectively. Meanwhile,
  denotes the thermal ion velocity, with
  ,
,  being the thermal ion temperature and mass, respectively. Equations (3)–(6) are the perturbed MHD equations in the plasma region. Equation (8) describes the RMP coil current
  , which is located in the vacuum region. Equations (7) and (9) represent the vacuum field solution.
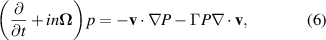
A quasi-linear plasma response model is used to investigate the interaction between RMP and plasma flow. The above linear RMP response equations coupling to the plasma flow are described by the following toroidal momentum balance equation
where  represents the surface-averaged plasma toroidal moment. The first term D(L) is the momentum diffusion term and can be written as
where  is a geometric factor. Here, F is the equilibrium poloidal current flux function;
  is the toroidal momentum diffusion coefficient; and Vpinch represents the velocity pinch term, which is ignored in this work. We assume that the toroidal momentum balance,
  , has been achieved before applying the RMP field. Hence, the evolution of momentum,
  , results from the toroidal torques
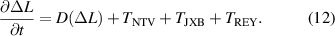
The momentum balance equation (12) contains three toroidal torques: the neoclassical toroidal viscous torque TNTV, the resonant electromagnetic torque TJXB and the Reynolds stress torque TREY. The Tsource is the momentum source term. Detailed expression of these toroidal torques is derived from [54, 55, 57].
Considering the efficiency of numerical simulations, we only study one case with  to verify the effect of plasma
  . Plasma equilibrium at t = 3200 ms in the EAST discharge 86 458 with
  is used as a reference in this study. A group of equilibria for different plasma betas is generated by scanning plasma pressure with a fixed q95 and the last close surface using the CHEASE code [58].
For different RF heating powers, the numerical parameters in MARS-Q simulation are based on the experimental observations in figures A1 and 3
 . The resistivity η is calculated from the Spitzer formula with electron temperature. The Alfvén time
  varies with density. The plasma rotation frequency Ω is evaluated from
  , where f is the mode frequency measured from a Mirnov probe. The momentum diffusion coefficient
  changes with the viscosity diffusion coefficient
  . An even coil connection of n = 1 RMP is applied in the simulation. In addition, a linear ramp-up of the coil current is employed to study the dynamics of field penetration.
4.2. Numerical results on nonlinear RMP field penetration in toroidal geometry
4.2.1. Toroidal effects on field penetration dynamics.
Figure 5 presents one example of modeled field penetration dynamics using the MARS-Q code for  . Figure 5(a) shows the time traces of the perturbed radial magnetic field,
  , for different poloidal harmonics, m = 2–4, and toroidal plasma rotations at each rational surface, Ω. Different harmonics penetrate in turn, starting from m = 4. Just after the penetration of each harmonic, the plasma rotation at the corresponding rational surface reduces to zero. Notably, the field penetration of m = 3 and m = 4 also affects the evolution of
  . The rotation at the q = 2 surface changes dramatically after the penetration of both m = 4 and m = 3 harmonics. This is induced by the enhancement of NTV torque after their penetration, as shown in figure 5(b). It is interesting to note that the electromagnetic torque is the dominant one at the beginning, while the NTV torque over takes it after the penetration of the m = 4 harmonic. Figures 5(c) and (d) show the radial profiles of the electromagnetic torque density and NTV torque density at the moments before (t1) and after (t2) of the m = 4 field penetration. With the occurrence of the m = 4 harmonic, a local decrease in electromagnetic torque density is presented in the nested graph of figure 5(c), as well as reversing the sign of the electromagnetic torque [59, 60]. The electromagnetic torque is mainly localized near the rational surfaces, while the NTV torque density shows a broader profile. Therefore, the NTV torque induces global rotation damping. These results demonstrate that the nonlinear coupling effect via the NTV torque from the high-m harmonics may play an important role in reducing the penetration threshold of the m = 2 harmonic.

Figure 5. (a) Simulated time traces of the perturbed radial magnetic field  (solid lines, left y-axis) and plasma rotation Ω at each rational surface (dash–dotted lines, right y-axis) for the
  (red),
  (blue) and
  (black) resonant harmonics. The vertical dashed lines indicate the penetration moment. (b) Evolution of the net total torque, the electromagnetic torque and the NTV torque acting on the plasma with
  . Also shown are the simulated radial profiles of (c) the electromagnetic torque density and (d) the NTV torque density at two time slices, as marked in (b). The vertical dashed lines represent the position of rational surfaces.
Download figure:
Standard image High-resolution image4.2.2. Toroidal coupling effect on mode structure.
Figure 6 shows a comparison of the mode structures before and after the m = 2 field penetration for two  . Figure 6(a) presents the real part of the radial structure of the plasma radial displacements
  and RMPs
  [46, 61] for
  (red) and
  (blue) at the moment before the m = 2 field penetration. Here, we choose the real part of the displacement to compare the variation of the mode structures for convenience. The increase in plasma
  enhances the global plasma response, which agrees with previous linear modeling results [17, 31, 33]. Here, an even stronger enhancement of the plasma response can be found in the nonlinear stage after the m = 2 field penetration, as shown in figure 6(b). This suggests that the toroidal coupling effect is important at the nonlinear field penetration stage as well.

Figure 6. The real part of the radial structure of the resonant  component of plasma radial displacements
  (solid lines, left y-axis) and magnetic perturbations
  (dash–dotted lines, right y-axis) at the moment (a) before and (b) after field penetration, assuming two different plasma-beta values, i.e.
  (red) and
  (blue). The plasma radial displacement ξρ
at the
(blue). The plasma radial displacement ξρ
at the  poloidal cross section and a displacement at the q = 2 rational surface (solid black lines) for (c)
  and (d)
  before the field penetration. The corresponding perturbations after field penetration are shown in (e) and (f), respectively.
Download figure:
Standard image High-resolution imageA similar result can be found in a two-dimensional view of the plasma radial displacement ξρ
in a poloidal cross section at  in figures 6(c)–(f). To study the toroidal coupling effect on mode structure, the ratio of displacement at the low-field side to that at the high-field side,
  , is shown in the legend. It is much larger than 1, indicating a kink mode structure before field penetration, while it is greatly reduced to be close to 1, i.e. a tearing-type structure. Please note that here we used local displacement at the q = 2 surface. To compare with experimental observations, magnetic perturbation outside the plasma is often easier to measure. The ratio of the magnetic perturbations outside the plasma may not show the same trend because of the relative phases of different Fourier harmonics after phase-locked modes [62].
Upon comparing the results in the two plasma-beta cases, it is shown that the value of  is larger for the higher plasma
  in both time slices before and after field penetration. This demonstrates again that the toroidal coupling effect is important at the nonlinear field penetration stage as well as at the linear stage.
4.2.3. Plasma-beta effect on field penetration threshold.
It is shown in the previous section that the resonant field amplification effect is stronger at both the linear and nonlinear stages with the higher  . To subtract the pure plasma-beta effect on field penetration, a dedicated comparison of field penetration thresholds for two different plasma-beta
  (red) and
  (blue) with the same kinetic profiles is shown in figure 7. The corresponding vertical dashed lines in figure 7(a) indicate the time at which
  field penetration occurs. It is shown that the higher beta case has a lower threshold for field penetration, because the total torque is higher in the high-beta case, as shown in figure 7(b). In the higher-beta case, the most significant difference is the much larger NTV torque, although both the electromagnetic torque and the NTV torque become larger, as shown in figures 7(c) and (d). This demonstrates that the higher plasma beta results in higher NTV torque for rotation damping, and hence reduces the threshold field for field penetration, which qualitatively agrees with the observation in the previous section.
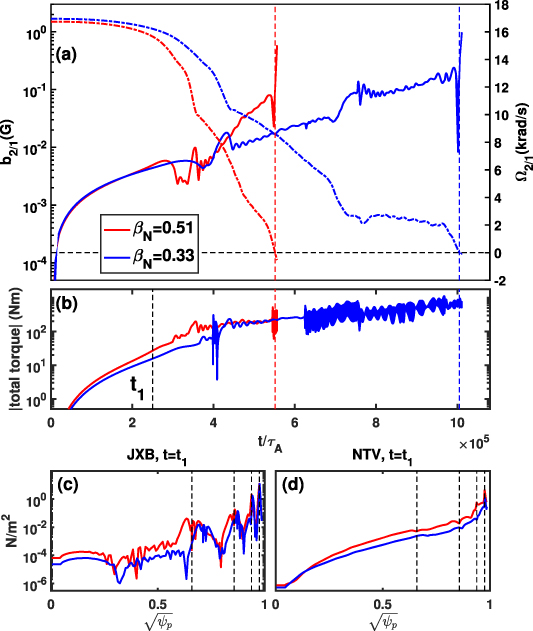
Figure 7. Temporal evolution of (a) the  (solid line, left y-axis) and
  (dash–dotted line, right y-axis), and (b) the net total torque for two cases with
  (red) and 0.33 (blue), respectively. Also shown are the corresponding radial profiles of (c) the electromagnetic torque density and (d) the NTV torque density at t1 marked in (b). Black vertical dashed lines indicate the rational surfaces.
Download figure:
Standard image High-resolution image4.2.4. Simulation of the mode penetration threshold scaling with Ptot.
To compare with the observations, simulations using realistic experimental equilibrium and kinetic profiles have been carried out in this section. Figure 8 shows a comparison of the field penetration threshold for three different plasma-beta cases with different total heating powers. It is shown that the penetration threshold increases with total heating power and plasma beta, which reproduces the trend of the experimental observation. The overall RF power heating effects enhance the error-field tolerance in this experiment.

Figure 8. Temporal evolution of the  resonant magnetic perturbation
  at the q = 2 rational surface (solid line, left y-axis) and plasma rotation
  at the q = 2 surface (dash–dotted line, right y-axis) for three different plasma-beta values, i.e.
  (red), 0.43 (blue) and 0.51 (black) using realistic experimental profiles.
Download figure:
Standard image High-resolution imageFigure 9 shows a summary of the comparison of the n = 1 RMP penetration threshold current scaling with heating power between experimental observations (black squares) and various theoretical and simulation results. The red stars and the fitted red line are from the simulation results using the MARS-Q code with realistic equilibrium and kinetic profiles and including the plasma-beta effect. Compared to the cylindrical theory scaling  (gray line), these simulation results (red stars) give a much closer scaling
  to the observed results
  (black squares).
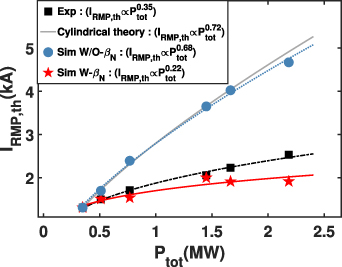
Figure 9. Comparison of the n = 1 RMP penetration threshold current scaling on the heating power between experimental observation (black squares) and various theory and simulation results, including cylindrical theory (gray solid line), simulation without the  effect (cyan circles) and simulation with the
  effect (red stars).
Download figure:
Standard image High-resolution imageFor verification of the modeling results with the theory in cylindrical coordinates, another group of simulations using realistic kinetic profiles but an equilibrium with a fixed  is carried out and it is shown as cyan circles in figure 9. The modeling parameters use experimental data, which correspond to the Waelbroeck regime. In this group of simulations in the absence of beta effects, the field penetration scaling should be mainly determined by the layer response physics, because the toroidal effects (e.g. kink mode coupling, the GGJ term [63], NTV) are kept constant and may not contribute to the scaling power index. It is shown that the simulation results without the
  effect (cyan circles) give a scaling result of
  , which agrees very well with the cylindrical theory results
  (gray line).
When we compare the two simulation results with and without the  effect, the plasma-beta effect
  on field penetration can be clearly identified. Table 3 gives a summary of
  in Ptot scaling between the experimental observation (
 ) and simulation results (
 ). The destabilizing effect of plasma
  on the field penetration process is well reproduced by the nonlinear simulation results using the MARS-Q code.
Table 3. The contribution of  to
to  scaling in experiments and simulations.
 with with 
|
 without without 
|

| |
|---|---|---|---|
| Experiment | 0.35 | 0.72 | −1.06 |
| Simulation | 0.22 | 0.68 | −1.31 |
5. Summary and conclusion
In this paper, error-field penetration induced by the n = 1 RMP field has been investigated by performing our analysis under RF heating power scan conditions in EAST. The experimental results reveal that the n = 1 penetration threshold current,  , increases with the increase of the total absorbed power Ptot. The improvement of device error-field tolerance sends a favorable message to ITER in pure-RF heating operation scenarios. Detailed analysis of experimental observations indicates that a shorter momentum diffusion time, higher electron temperature and faster mode frequency all occur with the stronger RF heating power. According to theory, error-field penetration threshold scales with all the quantities with positive power factors. Compared with the NBI heating scenario, the screening effect of the faster mode frequency, which is mainly contributed from the electron diamagnetic frequency, plays a key role in increasing the penetration threshold in purely RF experiments.
When we utilize power scaling of those parameters on the total absorbed power Ptot for two sets of discharges ( ), however, both estimated theoretical scalings in the cylindrical geometry (
 ) overestimate the experimental results (
 ). Previous studies have indicated that the increasing plasma beta, which is not included in classical field penetration theory, can reduce the error-field tolerance. Further estimated empirical scaling, when taking plasma
  into consideration, shows that the penetration-field threshold depends on the plasma pressure with a negative power factor (i.e.
  ).
).
To clarify the underlying physics of the plasma  effect, numerical simulations for the n = 1 RMP field penetration are carried out using MARS-Q in full toroidal geometry. Good agreement is found between the experimental (
 ) and numerical scaling results (
 ), by taking into account all of the experimental dependences, including increasing plasma
  in the simulation. For verification of the simulation results with the cylindrical theory without plasma-beta effects, the numerical scaling (
 ) is established with fixed plasma-beta
  while using realistic kinetic profiles, which is close to the cylindrical theory result (
 ).
).
The significant physical findings from the quasi-linear numerical simulation are that the NTV torque induced by the penetrated high-m harmonics dominates the total torque during the process of the  field penetration. This nonlinear mode coupling via the NTV torque from the high-m harmonics affects the
  field penetration. Moreover, the MARS-Q results indicate that the higher plasma
  leads to a stronger total torque, thus reducing the field penetration threshold.
These experimental and numerical results suggest that the plasma- effect in error-field penetration plays an important role in future high-parameter plasmas, and should be taken into account in error-field correction criteria for ITER. It should be noted that the above
  scaling is only limited to the
  and
and ![$\beta_\textrm N \in [0.3,0.6]$](https://content.cld.iop.org/journals/0029-5515/63/7/076004/revision2/nfaccdedieqn219.gif) in EAST discharges. The effect of the plasma
in EAST discharges. The effect of the plasma  on field penetration in different q95 regimes, as well as experiments where the plasma
  is close to the no-wall stability limit for ideal kink, will be studied in the future.
Acknowledgments
This work is supported by the National Natural Science Foundation of China under Grants (12175276, 11875292, 12005261, 12105323, 11905250 and 12075278), the National Magnetic Confinement Fusion Science Program of China under Grant No. 2017YFE0301100, and the Natural Science Foundation of Anhui Province under Grant No. 2208085J39 and the HFIPS Director's Fund under Grant No. BJPY2022B05.
Appendix A: Determination of the indexes of (
 , , ,
) using experimental observations
, , ,
) using experimental observations


In a tokamak experiment, it is very difficult to keep other plasma parameters fixed during heating power scanning. To obtain accurate scaling, the determination of all the parameters from experimental data is required. In the experiment, we try to keep the electron density within a small range using a feedback gas puff in order to eliminate the influence of density on penetration. There is a weaker density dependence, as shown in figure A1(a). Figure A1(b) shows the Ptot dependence of the electron temperature at the q = 2 rational surface, which is obtained by Thomson scattering. The stronger heating power increases the electron temperature, and the higher electron temperature can provide stronger shielding of the external field. As stated in [10–12], the viscosity diffusion time (τν
) is proportional to the energy confinement time ( ) in EAST L-mode discharge. Figure A1(c) gives the scaling between the heating power (Ptot) and the energy confinement time (
 ). It is calculated from
  , where W represents the plasma stored energy.
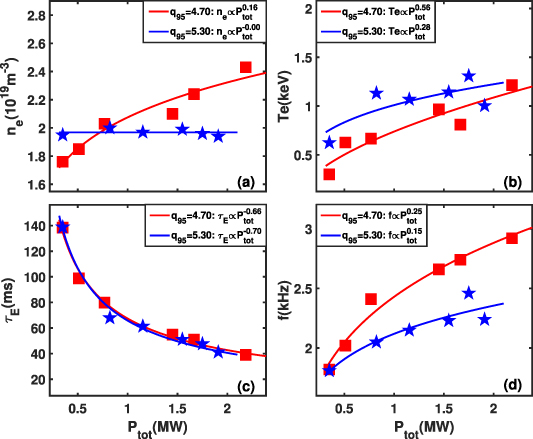
Figure A1. The dependence of the total absorbed power Ptot on (a) the electron density, (b) the electron temperature at the q = 2 surface, (c) the energy confinement time and (d) the mode frequency measured by a Mirnov probe signal under two experimental platforms ( and
and  ).
).
Download figure:
Standard image High-resolution imageUnlike the previous experimental observation in density scaling, figure A1(d) shows the faster mode frequency with stronger heating power. The onset of error-field penetration relies heavily on the relative frequency between the plasma and RMP field. The mode frequency measured by the Mirnov probe is determined by the electron fluid frequency ( ) because of two fluid effects [49–51]. It is the sum of the plasma rotation (
 ) and the electron diamagnetic frequency (
 ). In fact, the contribution from the plasma rotation
  can be ignored and the mode frequency is dominated by the electron diamagnetic frequency
  in the EAST pure-RF heating experiment. This tendency is reasonable due to the fact that higher LHW power enhances the electron temperature gradient at the q = 2 surface (
 ). The faster plasma rotation enhances the screening effect on external resonant perturbation.
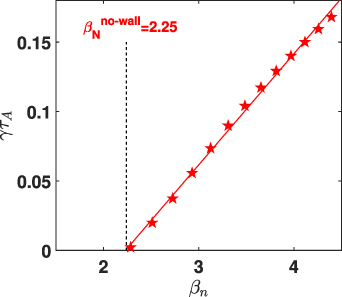
Appendix B: Calculation of no-wall beta limit based on reference equilibria
Figure B1 shows the growth rate of the n = 1 ideal kink mode versus  , based on a set of equilibria for 101 762 [64]. It can be seen that the range of
  in this experiment is still considerably less than the MARS-F computed no-wall stability limit of 2.25 in EAST.
Figure B1. The n = 1 ideal kink mode growth rate, calculated using the MARS-F code, versus  for EAST plasma 101 762.
Download figure:
Standard image High-resolution image