


Abstract
Self-consistent modeling using the stability, transport, equilibrium, and pedestal (STEP) workflow in the OMFIT integrated modeling framework (predicting pedestal with EPED, core profiles with TGYRO, current profile with ONETWO, and EFIT for equilibrium) suggests ITER and future devices such as China Fusion Engineering Test Reactor (CFETR) Zhuang et al (2019 Nucl. Fusion 59 112010) will benefit from high-density operation (Greenwald limit fraction  0.7−1.3). Regimes with an operational density near the Greenwald limit will likely need peaked density profiles so that the pedestal density remains below the Greenwald limit. Peaked density profiles can be achieved with the help of pellet injection. A flexible Pellet Ablation Module (PAM), which predicts the density source based on a comprehensive analytical pellet ablation model, has been developed for predicting pellet fueling for transport studies, and has been incorporated into the STEP workflow for predictive modeling. This workflow is applied to DIII-D and finds good agreement with experiments. On ITER the effect of pellet fueling is examined in an advanced inductive scenario, where a fusion gain of up to Q = 9 is predicted with strong central pellet fueling. On CFETR, with a mid-radius density source, an average of
  electrons s−1 are required to achieve the density and temperature profiles necessary for the 1000 MW advanced scenario with a tritium burn-up fraction of
  .
.
Export citation and abstract BibTeX RIS
1. Introduction
Accurate modeling of integrated core-pedestal solutions with self-consistent and validated fueling sources is critical to the assessment and optimization of fusion performance and the tritium burn fraction in ITER and future burning tokamak devices such as the China Fusion Engineering Test Reactor (CFETR). An important objective of CFETR is to develop the technical basis for an electricity-generating DEMO plant. One of the key mission elements of CFETR is to achieve tritium self-sufficiency, which requires that a tritium burn-up fraction produce enough neutrons for breeding and to reduce the tritium throughput in the whole system. Simultaneously, CFETR must produce enough fusion power to demonstrate economic viability. Integrated modeling has suggested that to achieve high fusion power, high density operation with the density near the Greenwald fraction ( ) is critical. Projections of the high density super H-mode in ITER suggest that a fusion gain of (Q = 10) may be achieved when the Greenwald fraction is near unity [1]. A previous CFETR study with a major radius of R = 6.5 m indicates that densities above the Greenwald limit are required to achieve a fusion gain of Q = 10 in steady-state operation [2]. Densities above the Greenwald limit have been achieved experimentally with core pellet fueling. For example,
  was achieved with the use of core pellet fueling on DIII-D [3]. Note that operation above the Greenwald limit via density peaking is still limited to being moderately above unity by core particle confinement times.
Combining pellet ablation [4] and  B drift effect [5–8], pellet fueling deposition has been shown to accurately predict experimental deposition on DIII-D [9]. The pellet ablation is the rate the atoms are stripped off the pellet from the surrounding pellet, and the
  B drift effect is due to a local pressure bump combined with
  B inducing a E × B flow which causes the pellet mass to drift in the major radius direction. Recent results from computationally intensive 2D and 3D numerical simulations showed that the total ablation was modified by the magnetic-field [10, 11]. A new flexible Pellet Ablation Module (PAM) for predicting pellet penetration depth and the fuel deposition (or source) profile for arbitrary injection locations in the poloidal plane have begun to be developed and have been implemented into the OMFIT integrated modeling framework [12]. Due to the hot pedestal in a reactor, deep penetration of pellets into the plasma will be challenging. To achieve deeper penetration, the pellet must be made stronger to survive the increased inertial forces high temperatures create. Technologies developed in the production of fuel pellets used in Inertial Confinement Fusion (ICF), where a large number of pellets must be injected into the ICF chamber per day, can be applied here to increase the strength of the DT ice pellets. One idea is to encapsulate the pellet inside a solid shell of high strength refractory material.
One of the main advantages of PAM is that it has been implemented as a Python module in OMFIT [13]. This allows for easy integration of other OMFIT workflows. While certain parts of the module are still under development such as the  drift effect, PAM can still be effectively utilized with integrated modeling workflow to understand density fueling needs. The integrated modeling workflow used in the paper is based on the following iteration scheme to obtain self-consistent stationary plasma profiles using the stability, equilibrium, transport, pedestal (STEP) module workflow inside of OMFIT. This OMFIT STEP module is used in combination with PAM to obtain the time-averaged particle source profile from repetitive pellet injection. By integrating the pellet source profile over the pellet injection frequency, one can find the particle flux at each radius. The TGYRO transport manager [14] then makes calls to the TGLF [15] and NEO [16] transport codes which calculate, respectively, local turbulent and neoclassical particle fluxes. TGYRO adjusts these gradients to match fluxes at each radial location. By integrating the local gradients new profiles are obtained for each iteration cycle. Since pellet sources depend on the plasma profiles, iteration between ONETWO [17], equilibrium solver EFIT [18] and TGYRO continues until acceptable convergence is achieved. This method only works in the plasma core ρ < 0.8, where core turbulence models are valid. Therefore, it is necessary to prescribe boundary conditions for the plasma density and temperature at the plasma edge, which in our analyses comes from using the EPED [19] pedestal model without the use of a detailed core/SOL coupling scheme as in [20]. One of the main advantages of the STEP workflow over the predecessor OMFIT predictive modeling loop [13] is that data is passed using a unified data structure called OMAS (Ordered Multi-dimensional Arrays) [21], which is a Python library designed to manipulate data according to the ITER integrated modeling and analysis suite (IMAS) specifications [22]. This allows for easier integration of modules, implementation of workflows, and reduces the total data storage.
This paper is divided into six sections. Section 2 describes the key PAM module to predict pellet ablation and deposition profiles, along with its verification and validation. The incorporation of PAM into the STEP workflow is described in section 3. Section 4 shows the incorporation of pellet fueling into the STEP workflow improves prediction of confinement of an advanced inductive regime in ITER. The CFETR pellet fueling needs to simultaneously achieve 1 GW fusion power and  % are evaluated in section 5 assuming a Gaussian particle source density with a peak at various radial locations. Then the density source from shell pellet fueling predicted by PAM replaces the Gaussian particle source profile in order to determine the pellet fueling parameters necessary to achieve the CFETR goals in section 5. Conclusions are given in section 6.
2. Development of PAM
The PAM is developed with the intention of modeling the ablation of spherical pellets bearing arbitrary multi-layer structure with homogeneous composition in each layer. It is implemented as a Python module in OMFIT and intended to be executed as either a stand-alone module or called from other OMFIT workflows. Inputs of PAM are the electron density ( ) and temperature (
 ) profiles, along with a 2D equilibrium. This data can be provided as 1D arrays plus an EFIT equilibrium in the gEQDSK format. Additionally, PAM can generate these inputs from OMAS [21], and by extension the IMAS data structure [22]. Case configuration can be performed where users can specify the number of different pellet structures to be modeled: pellet injection time, velocity, frequency, radius, material, and size of the computational mesh for pellet ablation modeling.
Currently two ablation models have been implemented in PAM. Both models are based on the 1D spherically symmetric neutral gas pellet ablation theory of pellets composed of pure light elements [23], both cryogenic and refractory, modified by the magnetic-field dependence from the results of computationally intensive 3D numerical simulations [11] to form an approximate scaling law for the ablation rate of a pellet. While the magnetic field does not enter the 1D model in its original formulation, it does convert the predominately neutral radial flow near the pellet into an ionized bi-polar outflow extending in both directions along the magnetic field. Due to this extra 'plasma shield' the 2D simulations found that the ablation rate is reduced considerably with increasing magnetic field strength, which is advantageous for pellet fueling in ITER and future reactors such as CFETR. The first model is the ablation rate of a DT composite either in the form of separated deuterium (D) and tritium (T) layers or homogeneous mixtures with arbitrary DT blends. The second is an approximate carbon (diamond) ablation model which is based on extrapolating the ablation rate of boron pellets using the same model as given in [23].
The ablation rate of a homogeneous DT mixture is evaluated using the 1D spherically symmetric ablation model given in Parks et al as:

where  is the mean atomic weight of DT mixture,
  ,
,  , in atomic mass unit,
  ,
,  is the molar fraction of D and T in the pellet;
  ,
,  ,
,  are electron density, electron temperature, and pellet radius.
  is an adjustment factor, which includes additional shielding processes needed to match experimental data from the IPADBASE [24]. This model differs from the neutral gas shielding model [4] where the electron distribution function of the incident plasma electrons was approximated by a mono-energetic distribution function. In the new model, electron transport through the cloud is calculated by solving the steady-state linearized 3D Fokker–Planck kinetic equation for the electron distribution. We note that this model ignore the effect of ionization effects of ablation [25]. For a 2 T magnetic field,
  , however, the ablation rate is expected to decrease for higher magnetic fields. We employed a fitted expression based on preliminary results from a limited number of 3D Lagrangian Particle codes simulations at
  T for deuterium pellets. The approximate scaling is:

The companion equation for rp comes from mass conservation:
where 
 is the mixed-species pellet mass density evaluated with an alloy-based model, and
  g cm−3,
  g cm−3. The model for carbon ablation has a similar dependence, with different atomic weight and normalization.
To solve the differential equation for the pellet radius  , the electron density
  and temperature
  are interpolated onto the pellet trajectory using the 2D equilibrium mapping. The ablated material must then be converted onto the transport grid. This is performed by approximating the pellet as a point source, or as a finite cloud areal disc as discussed in Zhang et al [26]. As pellets deposit with a finite perpendicular cloud width, two additional methods are applied to the pellet source using Gaussian filters, with the width of the filter determined by the pellet cloud size: radial Gaussian and 2D Gaussian filter. The radial Gaussian filter method applies a Gaussian filter of finite width based on the pellet's radial location ρ. For a 2D Gaussian filter, a 2D grid in ρ and θ is constructed based on contouring of the EFIT equilibrium. Here ρ is the normalized square root of the toroidal flux, and θ is a poloidal grid of no particular coordinate system. Then the deposited pellet density can be defined as:
where R is the major radius of the grid location, Z is the height of the grid location,  is the major radius location of the ablated pellet,
  is the height of the location of the ablated pellet, and
  is the size of the pellet drift in the direction of the major radius from the
  drift effect [9]. To get
  on the transport grid, a flux surface average is performed to get a 1D pellet deposition profile:
where  is the differential of the arc-length.
Applying this model to a DIII-D plasma, PAM shows good agreement with the predecessor Parks 1998 model [27] as implemented in the ONETWO code, and reasonable agreement with experiments. Figure 1 shows the line-averaged density versus time for a DIII-D core fueling L-mode pellet discharge 99470. This plasma discharge had pellet injection for multiple angles including vertical launch, high field side launch, and radially outward launch. The jumps in density correspond to the increase in density from pellet injection. Then the density relaxes to a higher density than before injection. At t = 2.3 s, there is a pellet injected from the low field side at 570 m s−1. The bottom panel shows the change in density from the experiment and the predicted density deposition from the previous PELLET module [28] in the ONETWO code and from PAM. The depositions from PAM and PELLET are very similar. The experimental change in density is deposited more radially outward than in both the ablation models, which is due to the neglecting of the  drift effect.
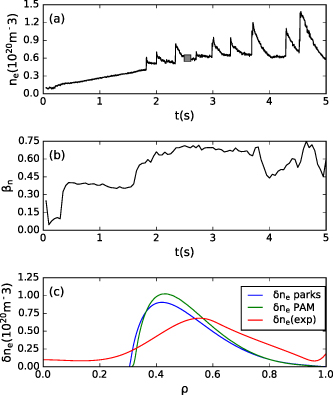
Figure 1. Experimental line averaged density vs. time (panel (a)). The plasma βN vs. time (panel (b)). A comparison between the density deposition calculate for PAM, PELLET, and experimental change in density between 2500–2550 ms (panel (c)).
Download figure:
Standard image High-resolution imageThe PAM carbon pellet ablation model has also been tested and shows a similar penetration depth to in carbon shell experiments. DIII-D experiments showed that a thin 40 µm diamond shell could deliver a payload of boron to the plasma core as deep as  . As PAM does not have an boron dust ablation model, a thin carbon layer surrounds a payload center of fast ablating deuterium-tritium (C-DT) is simulated, as shown in the very left panel of figure 2. The second panel shows electron density and temperature, which are important for calculating the ablation. For the C-DT core-in-shell pellet, the carbon layer is predicted to deplete for normalized minor radius ρ = 0.3–0.4, which is consistent with the experimental observation that the shells appear to burn through at
  for v = 230 m s−1 [29]. The right panel shows the decrease of pellet size as a function of ρ, which characterizes the penetration of pellets in the plasma which ablates slowly during the carbon layer and very quickly at
  –0.4 in the payload layer.

Figure 2. PAM simulation of carbon shell pellet injected into DIII-D discharge 173 873 at 3820 ms. On the very left is a thin carbon outer layer encapsulates an inner DT payload. Pellet ablation prediction by PAM, left: DIII-D  and
and  profiles; center: particle deposition for C-DT pellets; right: pellet size variation vs. r/a.
Download figure:
Standard image High-resolution image3. Incorporation of Pellet fueling in to the STEP workflow
A particle source from pellet ablation has been integrated into STEP with the workflow shown in figure 3. In order to get source profiles that are not directly linked to the ONETWO transport code, the CHEF module has been incorporated into the STEP suite. The CHEF module predicts heating, current drive, and fueling profiles. CHEF incorporates the IMAS data structure, and is connected to many heating, current drive, and fueling codes. GENRAY [30] can be used to predict the ion cyclotron radio frequency heating, electron cyclotron current drive (ECCD), lower hybrid current drive, and helicon current drive, TORAY [31] can be used to predict the ECCD, and an analytical source can add Gaussian profiles to the ion and electron energy, current drive, particle, and momentum sources.
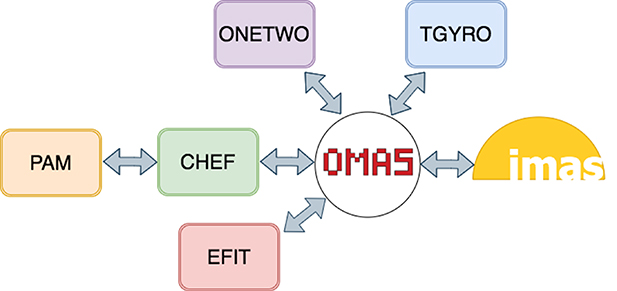
Figure 3. STEP workflow incorporating the CHEF and PAM module.
Download figure:
Standard image High-resolution imageThe STEP workflow used here is based on the assumption of stationary profiles. The pellet deposition into the plasma is very short compared to the stationary transport time scales which are predicted with the STEP module. To couple PAM into the STEP workflow, the pellet injection must be averaged over the time period of injection to get the electron particle source rate:
where  is the frequency of pellet injection and
  is the pellet deposition density.
The STEP workflow with pellet fueling has been tested against a DIII-D pellet-fueling experiment, and finds reasonable agreement. Figure 4 shows a comparison with DIII-D L-mode discharge 99 470 with core pellet fueling from 1800 ms to 3200 ms. The separatrix boundary, NBI heating power assuming classical fast ion diffusion, and large radius (ρ > 0.8)  and
and  are matched to the experiment. Then the STEP workflow is performed with and without an averaged 4 Hz low-field side injected pellet source with velocity of 570 m s−1 and radius of 1.4 mm to represent an approximate average pellet fueling for the discharge. The addition of the pellet source increases
  and lowers
  with only a small change to the total β, consistent with the experiment. The experimental Thomson scattering measurements of
  and
and  are also shown for discharge 99 470 before pellet injection and after the initial transient phase in
  from the pellet fueling at 2600 ms. The values of
  and
and  match well from ρ = 0.4–0.8. However, there is an over-prediction in
  and
and  with and without pellet fueling.

Figure 4. Profiles of  (top) and
  (bottom) from STEP with (solid red line) and without (solid blue line) pellet fueling are compared against Thomson scattering measurements for a DIII-D discharge 99470 before pellet injection (blue) and after pellet transient phase (red).
Download figure:
Standard image High-resolution image4. Pellet fueling and self-consistent modeling of reactors with ITER
In this section, the dependence of pellet ablation on toroidal magnetic field ( , where G is the ablation rate), suggested by 3D Lagrangian modeling [11] is analyzed finding that it slightly improves ITER core fueling prospects. Additionally, STEP modeling of an ITER advanced inductive scenario is performed finding improved predicted performance with increased fueling and pedestal density. Figure 5 shows the predicted ablation from PAM with and without the Bt
dependence. The simulation uses
, where G is the ablation rate), suggested by 3D Lagrangian modeling [11] is analyzed finding that it slightly improves ITER core fueling prospects. Additionally, STEP modeling of an ITER advanced inductive scenario is performed finding improved predicted performance with increased fueling and pedestal density. Figure 5 shows the predicted ablation from PAM with and without the Bt
dependence. The simulation uses  m s−1 pellet injected by the planned ITER high field side pellet fueling launcher. The pellet modeled with Bt
-dependence has a modest improvement of radial penetration of the ablation, with the Bt
-dependence pellet reaching up to ρ = 0.9, and the pellet with no Bt
-dependence reaching up to ρ = 0.925. Additionally shown in figure 5 is simulations with a Bt
-dependence of
m s−1 pellet injected by the planned ITER high field side pellet fueling launcher. The pellet modeled with Bt
-dependence has a modest improvement of radial penetration of the ablation, with the Bt
-dependence pellet reaching up to ρ = 0.9, and the pellet with no Bt
-dependence reaching up to ρ = 0.925. Additionally shown in figure 5 is simulations with a Bt
-dependence of  , based on 2D Eulerian modeling [10]. This reduction of ablation leads to the pellet ablating up to ρ = 0.87. While this Bt
reduction of ablation will help the pellet penetrate deeper into the plasma, the ablated material is still deposited near the edge and does not provide a core pellet fueling source by itself. Additionally, we note that the Bt
-dependence still needs to be verified with experiments.
, based on 2D Eulerian modeling [10]. This reduction of ablation leads to the pellet ablating up to ρ = 0.87. While this Bt
reduction of ablation will help the pellet penetrate deeper into the plasma, the ablated material is still deposited near the edge and does not provide a core pellet fueling source by itself. Additionally, we note that the Bt
-dependence still needs to be verified with experiments.

Figure 5. Predicted ablation with (green, purple) and without (blue) Bt -dependence for an example ITER discharge with 3 keV pedestal.
Download figure:
Standard image High-resolution imageThe pellet ablation depth is only part of the story when discussing pellet fueling. Another important effect is the  B drift determining pellet fueling location. The
  B drift is due to a local pressure bump combined with
  B inducing a E×B flow which causes the pellet mass to drift in the major radius direction. To calculate the redistribution of the ablated and ionized fuel particles caused by the
  drift effect [6, 8, 9] for ITER, the current version of PAM uses a simple zero-dimensional reduced model described in [32], which is fast at the expense of accuracy. The radial drift is defined as:

where  is the on-axis electron temperature,
  is the electron pedestal temperature,
  is the radius of the pellet from equation (4), and q95 is the edge safety factor. This scaling law was derived by performing PRL simulations of ITER plasma with high field side injection. Thus, it is only used for the ITER simulations in this paper. Then
  is used in equation (4) to calculate the density deposition. Figure 6 shows the PAM predicted particle deposition from the pellet for the contour of the lower half of ITER with no
  drift in the top panel, and with
  drift in the bottom panel. The
  drift leads to increasing the predicted particle deposition up to ρ = 0.6. PAM is flexible enough to include future improvements in pellet ablation modeling and validation with experiments, as well as improved treatments of the
  drift effect with ever-increasing physics fidelity. More complete models for the
  B drift effect are currently being implemented in PAM.
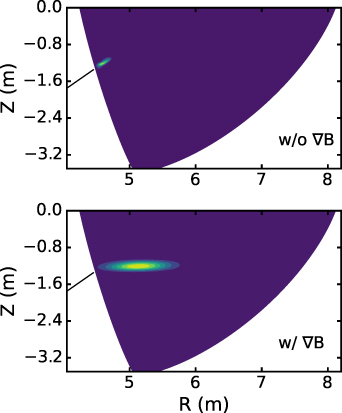
Figure 6. Pellet source deposition with(top) and without(bottom)  effects included.
Download figure:
Standard image High-resolution imageThe predicted pellet deposition from PAM with Bt
-dependence and 0D scaling for  drift is used to predict a pellet fueled ITER advanced inductive hybrid scenario. This predicted scenario has
  MA of current and
  is fixed slightly above unity. STEP predicts that the ITER advanced inductive hybrid scenario could reach near the ITER baseline goal of Q = 10 when pellet fueling is incorporated. Figure 7 shows the predicted fusion gain Q from STEP modeling as a function of the pedestal density and the frequency of pellet injection. The predicted Q increases as the particle source is increased and the boundary pedestal density is increased. A a Greenwald pedestal boundary condition
  , Q increases significantly going from Q = 6.7 at
  Hz to Q = 8.35 at
  Hz. However, increasing the density source leads to diminishing returns with Q = 9 predicted when the pellet fueling is at
  Hz. Possible ways to improve confinement further to achieve Q = 10 could be to improve the pellet penetration depth, broaden the plasma current profile, or increase
  which would allow for a higher electron pedestal density.
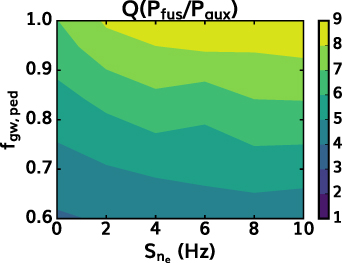
Figure 7. STEP predicted fusion gain Q for an ITER advanced inductive hybrid scenario vs. normalized pedestal density  and pellet source injection frequency
  .
.
Download figure:
Standard image High-resolution image5. Self-consistent modeling of CFETR
In this section, the pellet fueling depth required to achieve 1 GW fusion power in CFETR is evaluated using the STEP workflow, assuming a Gaussian particle density source. Variation of the radial location of the density source has been performed, finding that deep fueling penetration is key to high fusion performance and that the pellet fueling depth affects directly the particle confinement time.
The STEP workflow calculates the pellet deposition source self-consistently, and thus can be used to evaluate both fusion power and tritium burn-up fraction with source deposition. First, with assigned fusion power  (GW) and the energy released per fusion reactor (
 ), the required tritium fueling rate ST
of CFETR is assessed as follows. The tritium burn up rate is:
), the required tritium fueling rate ST
of CFETR is assessed as follows. The tritium burn up rate is:

If all tritium fuel is from pellets with a tritium molar fraction of 1/2, then  , where
  is the atomic number in one pellet, and
  is the pellet injection frequency. The tritium burn-up fraction,
  , can be related to
  and
and  through the following equation,
A fusion reactor must simultaneously have high fusion output and tritium self-sufficiency. The metrics we used to analyze this requirement for CFETR are 1 GW fusion power and 3% tritium burn-up fraction, which corresponds to a tritium fueling throughput of  tritons s−1. For a 50-50 D-T molar mix, the required pellet injection parameters to achieve 1 GW fusion power are evaluated with this given amount of tritium fueling and other system parameters such as auxiliary heating and current drive setup. In this paper, we do not optimize our simulation results with these system parameters, which are held fixed.
To assess the fueling needs for CFETR, a Gaussian density source option has been incorporated into the STEP workflow inside of the CHEF module. The predicted performance of CFETR improves significantly when a pellet-like Gaussian-shaped density fueling source is incorporated into the core. This workflow is applied to the CFETR advanced steady-state scenario with:  12 MA, and heating of 42 MW of NNBI, 30 MW of ECCD, and 20 MW of helicon heating [33]. Simulations were performed with a density source centered around ρ = 0.4, ρ = 0.5, and ρ = 0.6, where ρ is the normalized square root of toroidal flux. However, it should be noted that usually, a pellet will deposit many more particles at the edge than the Gaussian tail in the Gaussian assumption. The fusion performance measured by Q and
  is examined for two impurities carbon and neon as the main plasma impurity, along with helium. Neon is added to account for impurities that will likely need to radiate energy from the divertor and additional impurities from the wall which would raise
  . A flat
  and that the contribution to
  is equally split between helium and main plasma impurity is used. When neon is used, the relative fractions are 4.5% helium, 1% neon, and 80% D-T fuel. The main plasma impurity carbon is added to consider the possible effect of added impurities from a pellet shell. When carbon is used, the relative fractions are 6.5% helium, 2.3% carbon, and 75% D-T fuel. Note that the lowering of the D-T fuel in carbon is an effect of holding
  , as
, as  goes as the square of the charge. Due to limitations from the ONETWO code, neon is fully replaced by carbon. Thus, we can think of fully replacing carbon as the most optimistic case where a carbon shell pellet injects 3% carbon.
Using neon as the non-helium plasma impurity specie, the fusion performance goals of CFETR are predicted to be achieved with a density source placed at all ρ tested, shown in figure 8. With a density source centered about ρ = 0.4, the CFETR goal of  GW is predicted with a density source of
  electrons s−1. For comparison to a physical pellet, the number of electrons from a density source of 100 × 1020 electrons s−1 is equivalent to a pellet radius of
  mm injected at a rate of 1.4 Hz. When the density source is shifted to a larger ρ, the required density source to predict
  GW increases to
  electrons s−1 with a source located at ρ = 0.5, and
  electrons s−1 with a source located at ρ = 0.6. This result is consistent with the finding that
  increases with deeper pellet fueling deposition when the ratio of diffusion coefficient to thermal conductivity (
 ) is held fixed [20]. As shown on the bottom panel of figure 8, the tritium burnup fraction remains above the required 3% for all simulations, suggesting that tritium breeding requirements will be met for fueling that can penetrate to ρ = 0.6. Note that for lower source rates
  could be over-predicted, as only the fueling from the pellet is assumed to be sufficient to fuel the pedestal. If the pellet fueling source is not enough, an additional density source would be needed which would lower the burn rate.

Figure 8. STEP CFETR prediction of  (top) and
  (bottom) vs. Gaussian electron density source rate
  using neon as the primary impurity.
Download figure:
Standard image High-resolution imageThe predicted profiles are similar examining the densities and temperatures for the  GW scenarios with different source locations. The STEP predicted
  ,
,  , and
, and  are shown in figure 9 with
  electrons s−1 at ρ = 0.4,
  electrons s−1 at ρ = 0.5,
  electrons s−1 at ρ = 0.6. Additionally, the zero source profile is also shown for reference. The
  profile is more peaked for the sourced profiles with
  m−3 than the
  with no additional core fueling source with
  m−3. Comparing the radial source locations, the
  profile is slightly broader for the sources that were deposited at higher ρ. Overall, the effect of different source profiles is fairly small in terms of changing the predicted profile shapes, and the largest effect of the deeper fueling source is in the number of particles needed to sustain the density profile.

Figure 9. STEP CFETR  GW prediction of
  (left),
  (middle), and
  (right) vs. ρ. Density. The ρ = 0.4 source profiles are plotted in red, ρ = 0.5 in green, ρ = 0.6 in blue, and zero source in black.
Download figure:
Standard image High-resolution imageOne possibility for deep core fueling in a reactor is via shell pellets. STEP simulations are repeated with carbon as the non-helium impurity species, since current shell pellets have only be made with a diamond shell. The confinement improvements from a Gaussian fueling source with a carbon background are more pessimistic for all source locations, and deeper fueling is required. The fusion power is shown on the top panel of figure 10. When a Gaussian source at ρ = 0.4 is added to the simulation, an injection rate of approximately  electrons s−1 is required to predict a fusion gain of 1 GW. This is approximately three times larger than was needed in the neon impurity simulations. When the density source is shifted to a larger ρ, the required density source to predict
  GW increases to
  electrons s−1 with a source located at ρ = 0.5, and
  electrons s−1 with a source located at ρ = 0.6. This reduction of confinement is likely due to the lower Z = 6 of carbon having a larger dilution to the main ion impurities than neon, and suggests the amount of low-Z impurities injected in the plasma needs to be limited. As shown on the bottom panel of figure 10, the tritium burn-up fraction remains above 3% for all source rates for the ρ = 0.4 centered source. For the ρ = 0.5 centered source, the required
  % and
% and  GW, is narrowly met with a source of
  electrons s−1. Finally, with a source centered at ρ = 0.6, the simultaneous goals are not met for all source rates with the closest point being
  % and
% and  GW at
GW at  electrons s−1.
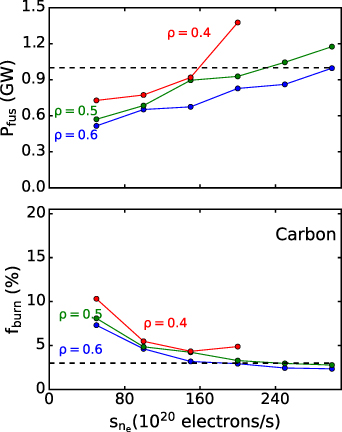
Figure 10. STEP CFETR prediction of  (top) and
  (bottom) vs. Gaussian electron density source rate
  using carbon as the non-helium impurity.
Download figure:
Standard image High-resolution image6. Shell assessment of pellet fueling on low field side injection
Based on the Gaussian particle source scans, CFETR would benefit strongly from a core fueling source located near ρ = 0.5. It was found that fueling at least to ρ = 0.6 was required to predict a 1 GW scenario. Due to the high plasma temperatures in a reactor, a traditional fuel deuterium-tritium pellet would ablate near the edge. In order to achieve the fueling depth of radius ρ < 0.6 in CFETR, one possibility is to encapsulate the frozen fuel inside a thin shell of low-Z material [34]. For an initial assessment, simulations of shell pellets in CFETR are performed calculating the deposition ignoring the  B drift effect. If the radial shift
  B drift effect turns out to be large in CFETR, then the same strategy could be performed from the high field side.
PAM predicts that a 4 mm DT pellet with a 25 µm diamond shell injected from the low field side with velocity 3000 m s−1 can penetrate to ρ = 0.6 in the CFETR hybrid plasma. The thin carbon layer slowly ablates until ρ = 0.7, then releases the fuel deuterium-tritium (DT) ions in between ρ = 0.5–0.7. This provides a core source of fuel ions with minimal electrons deposited near the edge. While increasing shell thickness increases the fuel penetration, it also increases the source of impurities in the plasma. Even a thin shell of 25 µm adds enough carbon into the plasma is raise  without even considering the other impurities. Therefore, the low-Z impurity shell should be as small as possible while still achieving core penetration. A STEP simulation with this pellet injected at
  Hz finds a high fusion performance plasma, shown in figure 11. The
  to be consistent with the number of carbon impurity atoms injected into the plasma. The electron density has strong gradients where the D-T is deposited, and the plasma is predicted to have
  GW and
  . Note diamond is used here as current DIII-D shell pellet experiments were composed of diamond shells [29], and could be replaced with another low-Z impurity.

Figure 11. STEP predicted  ,
,  ,
,  , and
, and  for CFETR.
Download figure:
Standard image High-resolution image
7. Conclusion
The PAM has been developed to model the ablation of spherical pellets with an arbitrary multi-layer spherical structure. With the existing functionalities, it has been proven to be a useful tool in both preliminary stand-alone simulations and core-pedestal self-consistent modeling using the OMFIT STEP module. PAM has been benchmarked against and shows good agreement with the predecessor model on a DIII-D discharge. Validation of PAM against DIII-D experiments with pellet injection from the low field side shows reasonable agreement. However, PAM is overpredicting the pellet penetration from the low field side due to neglecting the  drift effect. Integration into the STEP workflow shows that the addition of the pellet source increases
  and lowers
  with only a small change to the total β, consistent with the DIII-D pellet fueling experiment.
The dependence of ablation on the magnetic field ( ) as suggested by 3D Lagrangian particle modeling of pellet ablation could slightly improve ITER core fueling prospects. The STEP predicted Q increases with both pellet fueling rate and boundary pedestal with fusion gain Q = 9 at 10 Hz fueling rate and pedestal
  .
.
STEP modeling of CFETR shows that an idealized fueling source located at  significantly improves the predicted fusion performance. However, fueling inside of ρ < 0.6 is difficult with traditional fueling pellets. The possibility of using low-Z shell pellets is explored with the deposition profiles of which are predicted for a CFETR plasma. Shell pellet designs can help the pellet ablate up to ρ = 0.6 with low field side injection. However, the
  drift effect still needs to be accurately considered and a thick shell pellet for deep penetration could add a significant amount of impurities which would degrade plasma performance. Additionally, injection from the high field side for CFETR has not been explored in this paper and may improve pellet penetration once the
  drift is incorporated into PAM.
Future improvements to PAM will include using the cloud pressure relaxation model as described in [8, 9] to better estimate the  B drift effect as well as the implementation of an ablation model for shells consisting of high-strength refractory materials for molecular species such as boron nitride and boron carbide.
Acknowledgments
This material is based upon work supported by the U.S. Department of Energy, Office of Science, Office of Fusion Energy Sciences, using the DIII-D National Fusion Facility, a DOE Office of Science user facility, under Awards: DE-FG02-95ER54309 (GA Theory Grant), DE-FC02-04ER54698 (DIII-D), and by GA CFETR Contract 19KH00367US.
Disclaimer
This report was prepared as an account of work sponsored by an agency of the United States Government. Neither the United States Government nor any agency thereof, nor any of their employees, makes any warranty, express or implied, or assumes any legal liability or responsibility for the accuracy, completeness, or usefulness of any information, apparatus, product, or process disclosed, or represents that its use would not infringe privately owned rights. Reference herein to any specific commercial product, process, or service by trade name, trademark, manufacturer, or otherwise, does not necessarily constitute or imply its endorsement, recommendation, or favoring by the United States Government or any agency thereof. The views and opinions of authors expressed herein do not necessarily state or reflect those of the United States Government or any agency thereof.