


Abstract
We study localized edge turbulence in the ASDEX Upgrade tokamak that appears if resonant magnetic perturbations (RMP) are applied to suppress edge localized modes (ELMs) in the high confinement mode. The concomitant density fluctuations are detected by microwave reflectometry at the outboard midplane. Two modes can be distinguished, (a) a broadband fluctuation below a threshold of the RMP field amplitude, and (b) a narrow-band quasi-coherent mode (QCM) above the threshold. The broadband fluctuation is toroidally spread out but disappears at the toroidal position of maximum E × B shear in the gradient region. Temporal and spatial correlation along field lines of the midplane density fluctuation and the divertor particle flux suggests that this mode is producing significant particle transport across the gradient region and into the divertor, hence contributing to the plasma density reduction that is often observed when applying RMP fields (the so-called 'pump-out' effect). The QCM is also toroidally localized, its radial extent grows with increasing RMP field amplitude, and leads to further increased divertor particle flux compared to the broadband mode. Our observations suggest that both modes not only play an important role in keeping the plasma density stationary in the absence of ELMs but also to reduce the plasma pressure such that the plasma edge becomes stable against ELMs.
Export citation and abstract BibTeX RIS

Original content from this work may be used under the terms of the Creative Commons Attribution 4.0 license. Any further distribution of this work must maintain attribution to the author(s) and the title of the work, journal citation and DOI.
1. Introduction
Edge localized modes (ELMs) [1, 2], repetitively occurring instabilities in tokamak high confinement mode (H-mode) plasmas [3] driven by the edge pressure gradient and its associated bootstrap current [4], lead to pulsed heat loads onto the surrounding wall which threatens the lifetime of the first wall in future tokamak reactors such as ITER [5, 6]. Hence, techniques to control ELMs are heavily studied as one of the key issues in an H-mode tokamak reactor [7]. While early studies in COMPASS-C [8] and JFT-2M [9] demonstrated the mitigating effect of resonant magnetic perturbations (RMPs) on ELMs, it was shown first in DIII-D [10] that ELMs can be fully suppressed by RMP fields under certain experimental conditions. This observation has later been reproduced in KSTAR [11], EAST [12] and ASDEX Upgrade [13].
In addition to the effect on ELMs, it is also often observed that the electron density decreases as a consequence of the RMP field [14], which is attributed to an increase of the radially outward directed particle transport and thus referred to as the 'pump-out' effect. Various physical mechanisms have been proposed to explain the pump-out effect, including parallel transport in a stochastic magnetic field created by the RMP in the H-mode gradient region [15–17], parallel transport around RMP-induced magnetic islands [18, 19], and increased neoclassical transport [20–23]. However, observations of enhanced edge fluctuations in DIII-D [24–26], KSTAR [27] and EAST [28] point at a possible role of turbulent transport, particularly during ELM suppression [24, 25, 27].
In this work, we study the effect of the RMP field on plasma turbulence experimentally in ASDEX Upgrade H-mode plasmas with and without full suppression of ELMs. The application of an RMP field leads to the appearance of density fluctuations in the edge transport barrier (ETB), where turbulence is usually suppressed in H-mode in between ELMs. We show that the density fluctuation in the ETB region leads to radially outward directed particle transport as well as particle flux into the divertor and, hence, contributes to the pump-out effect.
The outline of this paper is as follows. In section 2 we describe the experimental setup, including plasma and RMP parameters used. The fluctuation measurements are described in section 3. By midplane reflectometry, we identify two distinct fluctuation patterns in the ETB region when RMP is applied: (a) an increase of broadband fluctuations and (b) a quasi-coherent mode (QCM). The broadband fluctuations are investigated with respect to their localization, effect on transport and origin in section 4. In section 5 the focus is on the QCM, its localization and effect on transport. In section 6 the results are discussed, followed by our conclusions in section 7.
2. Experimental setup
ELM suppression is reliably found in ASDEX Upgrade [13] (a) in a narrow edge safety factor window at around  which is achieved in our experiments with a toroidal magnetic field
  and a plasma current
  , (b) in lower single-null plasmas with an upper triangularity of
  and lower triangularity
  and (c) if the pedestal density in H-mode is near or below
  . The plasmas are mainly heated by about
  neutral beam injection power and additional 1.0–
 of central electron cyclotron resonance heating power.
The RMP field in ASDEX Upgrade is generated by a set of 16 in-vessel saddle coils at the low field side, of which eight are toroidally distributed above and eight below the midplane [29, 30]. Here, we use exclusively RMPs with a toroidal mode number n = 2. For the above plasma parameters, the phase offset between the upper and lower row of coils (also termed the 'differential phase') is chosen to be either  or
or  , which in both cases creates a significant kink-resonant field component at the plasma edge [31].
As an example for ELM suppression in ASDEX Upgrade, time traces of the ELM suppression discharge AUG #35307 are shown in figure 1. After the flat top has been reached, the magnetic perturbation field is turned on at  and the pedestal electron density starts to drop. We will refer to this drop subsequently as the 'first density pump-out'. It is directly related to the application of the magnetic perturbation field, while the plasma is still in ELMy H-mode. At the same time, the upper triangularity is ramped up, which leads to a temporary increase of the electron density until the target shape is reached at
  and the gas puff is reduced to a minimum level. While the electron density is decreasing, ELMs are becoming smaller until ELM suppression is finally reached at
  . At the transition into ELM suppression, another decrease of the electron density can be observed. In order to avoid confusion with the initial density pump-out observed when the RMP field is turned on, we will refer to it as the 'second density pump-out'. In this case, also the ion and electron temperatures drop at the transition, however, they recover for the most part during the ELM suppressed phase.

Figure 1. Time traces of AUG #35307 showing the neutral beam injection heating power  , the electron cyclotron resonance heating power
  , the deuterium gas puff
  , the effective n = 2 MP coil current amplitude
  , the upper triangularity
  , the shunt current measurement in the divertor
  , the electron density at the pedestal top
  , the electron
  and ion
  temperature at the pedestal top.
Download figure:
Standard image High-resolution image3. Density fluctuation patterns during ELM suppression
In order to characterize the edge turbulence during the application of RMPs, measurements from a homodyne reflectometry system with perpendicular incidence angle [32, 33] are used as an approximation of density fluctuations. Figure 2 shows the frequency-integrated power spectral density, i. e. total spectral power, and a spectrogram of the reflectometer homodyne signal for a probing frequency with wave cut-off in the ETB for a time interval in shot #34548 around the end of RMP application. The RMP switch-off time ( ) is subtracted from the time base
  , so
, so  corresponds to full ELM suppression and
  to the time evolution after switching off the RMP field. The effective MP coil current (top panel) is calculated as described in [13] and includes the effect of image currents in the passive stabilization loops on which the MP coils are mounted and which slow down the evolution of the vacuum field.
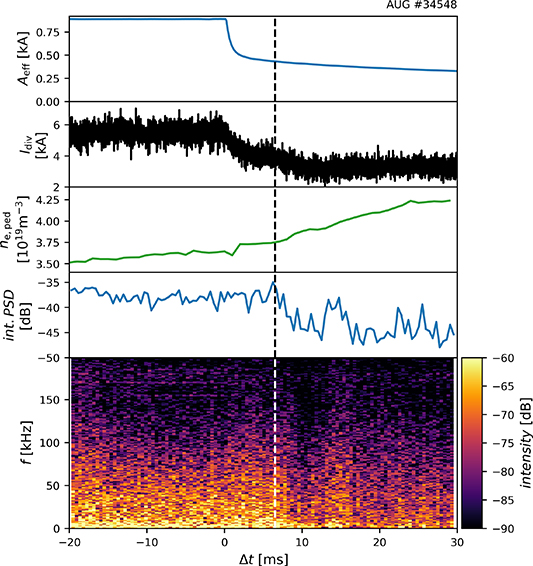
Figure 2. Time traces of AUG #34548 showing the effective RMP coil current amplitude  , the divertor shunt current
  , the electron density at the pedestal top
  , the integrated power spectral density PSD, and the spectrogram of the reflectometry measurement with a probing frequency of
  . The dashed line indicates the onset of the decay of the spectral density simultaneous with a further decrease of the
  baseline.
Download figure:
Standard image High-resolution imageDuring the ELM suppressed phase ( in the figure and t = 3.0–
 in pulse #34548), broadband density fluctuations are observed at frequencies with a corner frequency of approximately
  (see spectrogram in the bottom panel) and no discernible structure at lower frequencies. The divertor shunt current (an indicator for particle fluxes on the divertor) and the pedestal electron density (third panel) remain constant during ELM suppression. After turning off the MP coils at
  and the initial fast decay of the RMP field lasting for a few milliseconds, the divertor shunt current drops, indicating reduced particle and heat fluxes on the divertor, and the electron density in the plasma starts to increase. At
  (marked by the vertical dashed line in figure 2), the density fluctuation level begins to drop significantly and at the same time the divertor shunt current starts to decrease further.
The effect of increasing the RMP field strength is demonstrated in figure 3 for shot #35307, where an effective coil current amplitude of  (as compared to
  in shot #34548) is applied. This figure shows both the begin (left panels) and the end (right panels) of the ELM suppressed phase. As seen in the bottom panels, the fluctuation that appears during ELM suppression has changed spectral character and now has a pronounced amplitude maximum at
  with a width of about
  , around which the amplitude drops off. Because of its finite bandwidth, we hereafter refer to this peak as 'QCM'. Simultaneously with the plasma transition from the ELM mitigated state into the ELM suppressed state at
  , the pedestal plasma density (third panel) begins to drop with a steeper slope while the baseline of the divertor shunt current increases slightly, indicating the onset of an additional pump-out mechanism. Throughout the entire ELM suppressed phase, the QCM is present in the ETB and the electron density remains stationary. When the MP coils are turned off and the RMP field starts to decay at
  , the QCM also starts to decay, the divertor shunt current drops and the electron density starts to increase. The QCM is a typical observation during ELM suppression with a strong RMP field in ASDEX Upgrade, and its peak typically appears in the frequency range of 30–
 .
.

Figure 3. Time traces of AUG #35307 showing the effective RMP coil current amplitude  , the divertor shunt current
  , the electron density at the pedestal top
  , the integrated power spectral density PSD, and the spectrogram of the reflectometry measurement. The vertical dashed lines indicate the transitions into and out of ELM suppression. The horizontal dashed line indicates the
  baseline level during the ELMy phase before
  . The QCM is encircled with white ellipses.
Download figure:
Standard image High-resolution imageThe presence of either broadband density fluctuations or the QCM appears to depend on the strength of the RMP field. In order to study a transition between these two states, the RMP field amplitude can be decreased stepwise during ELM suppression as done in shot #35943 (figure 4). Throughout the RMP amplitude scan, ELM suppression is maintained while the electron density increases constantly as the RMP amplitude is reduced. As the density increases the H-factor also recovers to about 1. During each step of this scan, the frequency of the probing beam of the reflectometry system is varied such that density fluctuation measurements are obtained at several positions in the ETB region for each RMP amplitude level. Density profiles and the occurrence of the QCM are shown in figure 5 for three different times during the scan. A red color marker at the corresponding probed density and radius indicates that the QCM was not observed while a green color marker indicates that the QCM was observed. The first profile is taken at the highest effective MP coil current amplitude  (t = 3.3–
 ). The QCM is observed in the ETB region close to the pedestal top but also close to the pedestal foot. During the second time interval (t = 5.8–
 ,
,  ), the QCM is observed only close to the pedestal top, and at lower RMP amplitude (e. g.
  at t = 7.3–
 ), the QCM is not present anymore and only broadband density fluctuations can be observed. This scan of the RMP amplitude demonstrates (a) that the QCM is localized in the ETB, (b) that it tends to align with the top of the ETB and (c) it disappears below a threshold RMP amplitude (
 –
– in this case). The appearance of the QCM at fewer measurement positions with decreasing RMP field amplitude can be either interpreted as a narrowing of the QCM's radial extent or a decrease in the amplitude of the QCM.

Figure 4. Time traces of AUG #35943 showing the effective coil current amplitude  , the divertor shunt current
  , the pedestal top electron density
  and the H-factor
  .
.
Download figure:
Standard image High-resolution image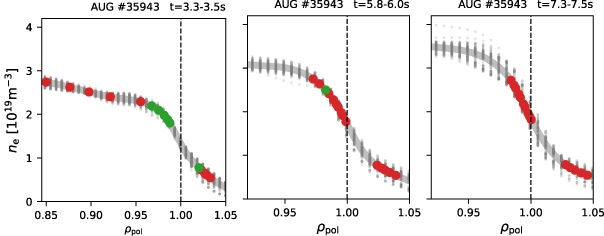
Figure 5. Electron density  profiles (combined lithium beam and Thomson scattering) taken at three different times during shot #35943 (see figure 4) as a function of the normalized poloidal flux coordinate
  . The dots mark the reflectometry measurement positions. Green (red) indicates that the QCM was (not) observed.
Download figure:
Standard image High-resolution imageIn the following sections, the broadband density fluctuations and the QCM are investigated further with respect to their localization and role for the observed increased particle transport.
4. Broadband density fluctuations
4.1. Localization
We now consider the broadband density fluctuations which appear at a moderate perturbation field amplitude and study their toroidal localization within the RMP field pattern.
We use a technique introduced in [34] which is to rotate the current pattern in the RMP coils toroidally as a function of time and take measurements at toroidally fixed diagnostic positions. The resulting data can then be attributed to the toroidal phase of the perturbation. For a given poloidal and radial measurement position, this also corresponds to a particular field-line. Figure 6 gives an overview of discharge #34548, in which ELM suppression was reached with maximum RMP field amplitude at  and a differential phase angle
  . At
. At 
 is changed to
  and the amplitude is decreased. A further small decrease in amplitude occurs at
  . During periods of constant amplitude, the toroidal phase Φ0 of the RMP field pattern is rotated, with two full rotation periods being passed through while ELM suppression is maintained. For each rotation period, the pedestal parameters remain reasonably constant. In the following we use predictions from VMEC 3D equilibrium calculations (described in [34, 35]) to map different diagnostics on the helical field-line label α. We follow the definition of the helical field line label used in [36] which is
  with the poloidal coordinate
  in straight field line coordinates, the safety factor q and the toroidal coordinate φ. The toroidal coordinate is time varying during the rigid rotation and can be written as
  with
with  . Given the
  , the poloidal and toroidal coordinates of a certain diagnostic
  and
and  , and the rotation frequency of the n = 2 perturbation field
  , one can map measurements of different diagnostics during the rigid rotation onto α. In this work α was given an offset of
  as compared to [36] in order to move the two zero crossings of the surface corrugation to
  and
and  . In order to verify the use of VMEC in this discharge, a comparison between the measured and predicted surface corrugation is shown in figure 7. The radial displacement
  of the plasma surface in the line of sight of the lithium beam [37] diagnostic is calculated by following the radially moving density profile at a constant value of
  . A correction to the fit is applied which takes into consideration the effect of the plasma control system moving the plasma in radial direction due to the modulated signal in the magnetic probes used for real time control during a rigid rotation of the RMP field (described in [35]). It shows a good agreement between the measured surface displacement by lithium beam measurements and the predicted surface corrugation by VMEC.

Figure 6. Time traces of the toroidal RMP orientation variation in shot #34548, showing the effective RMP coil current amplitude  and toroidal orientation of the upper row of coilsΦ0, the divertor shunt current
  , the electron density at the pedestal top
  , as well as the electron
  and ion
  temperatures close to the pedestal top.
Download figure:
Standard image High-resolution image
Figure 7. Time trace of the radial displacement of the density profile measured by the lithium beam diagnostic (grey dots), its fit (dashed orange line), its fit corrected for movements invoked by the plasma control system (solid orange line) and the VMEC prediction (solid blue) line during the rigid rotation in #34548.
Download figure:
Standard image High-resolution imageDensity fluctuations are measured by the O-mode reflectometry system with a perpendicular incidence angle and probing frequencies of  and
and  in the Ka- and K-bands, respectively. One advantage of O-mode reflectometry for this application is that the measurement location is tied to the O-mode cut-off layer which depends only on density, irrespective of the plasma deformation produced by the RMP field. Therefore, during the RMP field rotation the measurement position remains at a fixed position within the plasma, in this case the center of the ETB for the Ka-band, and the SOL for the K-band. The measurement of the Ka-band system on the LFS during both rotation periods is shown in figure 8 as a function of the helical field-line label α. The top panel shows the radial plasma surface displacement
  in the line-of-sight of the Ka-band measurement as predicted by VMEC. The middle panel and the bottom panel show the integrated power spectral density and the spectrogram of the reflectometry homodyne signal, respectively. Over a wide range of α the reflectometry signal stays approximately constant, however, in a window between roughly
  and
and  (
( in the second period) the PSD drops significantly by up to
  . The minimum is located at approximately
  –
– which is close to one of the zero crossings of the surface displacement with a small shift towards the maximum of the surface displacement. This phase within the surface corrugation where the broadband fluctuations are reduced will hereafter be referred to as the 'fluctuation gap'. In the K-band measurement the fluctuation gap is also present, but only in a very narrow range in α where the minimum is also observed in the Ka-band measurement, at
  –
– . Figure 9 shows spectra of the Ka-band measurement taken inside the fluctuation gap at
  (blue) and outside the fluctuation gap at
  (orange) for both rotation periods. The reduction of fluctuations can only be observed in the low frequency range up to about
  . Within this range, the magnitude of the reduction decreases with increasing frequency. At higher frequencies the spectra inside and outside the fluctuation gap overlap. On the HFS, such a toroidal asymmetry present in both rotation periods is not observed.

Figure 8. The radial displacement  of the separatrix intersecting with the beam path of the reflectometer, the measured integrated power spectral density PSD and its spectrogram for the Ka-band reflectometry system (
 probing frequency) on the LFS as a function of the helical field-line label α for both rotation periods of AUG #34548.
Download figure:
Standard image High-resolution image
Figure 9. Power spectral density profiles of the Ka-band reflectometry measurement during the first (solid) and second (dotted) rotation period. Profiles are taken within (blue) and outside (orange) the fluctuation gap.
Download figure:
Standard image High-resolution image4.2. Effect on transport
Turbulent transport perpendicular to the magnetic field arises from E × B-convection of turbulent eddies. This can be quantified experimentally if, in addition to the density fluctuations, perpendicular electrical field fluctuations can be measured, including the phase between the two quantities. Unfortunately, such a measurement is at present not available for the hot H-mode pedestal in ASDEX Upgrade. We therefore investigate the spatial and temporal correlations of the broadband density fluctuation in the ETB with other phenomena related to particle transport, i. e. (a) the formation of a density shoulder in the scrape-off-layer (SOL), and (b) particle fluxes into the divertor.
The appearance of a density shoulder, i. e. a radial region with an elevated flat density plateau in the near SOL, can be attributed to field-aligned plasma filaments ('blobs') which quickly travel radially outward and lead to increasing perpendicular transport [38]. Here, we use the lithium beam diagnostic, with a sightline located slightly above the midplane at the LFS, which measures the SOL density profile with high spatial accuracy and an integration time of ∼1 ms that averages over filament events.
On the left plot of figure 10, edge electron density profiles are shown for four different times (or values of the field line label α) during each of the two RMP rotation periods in shot #34548. Line colors correspond to the values of α marked up in the right plot, which shows the electron density at fixed flux radius  (dashed line in left plot) as a function of the α.

Figure 10. Left: electron density profiles measured by the lithium beam diagnostic for different α within the two rotation periods of #34548. The profiles are shifted such as to match each other at the separatrix equal to  . The dashed line refers to
  which is assumed to be the center of the density shoulder. The dotted line refers to
  which is assumed to be the end of the density shoulder. Right: electron density tracked at
  (dashed line on the left) for both rotation periods. Dots refer to the first, squares to the second rotation period. The colored data refers to the profiles shown on the left.
Download figure:
Standard image High-resolution imageThe plasma density is essentially independent of α on flux surfaces in the confined plasma ( ) and the density profiles converge in the far SOL (
 ). At radii in between, there is a clear formation of a density shoulder, for
  and
and  . The shoulder height drops significantly in the range of α = 0.4–
 , which overlaps well with the location of the fluctuation gap at α = 0.25–
 (see previous section). We therefore conclude that the toroidally localized density shoulder is linked to the edge turbulence that we detect as density fluctuations in the gradient region at the same toroidal positions. The increased density in the near SOL can only be caused by an increased radial efflux from the confined plasma, as competing flows along the magnetic field drain plasma from filaments and reduce the SOL density. This suggests that the plasma edge turbulence associated with the observed broadband density fluctuations during RMP application causes radial transport across the ETB.
The second indication for particle transport comes from Langmuir probes mounted on the outer divertor which allow for local measurements of density fluctuations. From top to bottom, figure 11 shows the toroidal phase Φ0 of the MP field, the divertor shunt current as well as the electron density and temperature measured by one of the divertor Langmuir probes. In the ELMy phase before  , ELMs can be recognized in the Langmuir probe measurements as large spikes in ne
and Te
which originate from the transient ELM particle and energy bursts arriving in the divertor. Transient transport can still be observed during the ELM suppression time interval (between the two dashed lines). During the two rotation periods of the RMP field between t = 3 and
, ELMs can be recognized in the Langmuir probe measurements as large spikes in ne
and Te
which originate from the transient ELM particle and energy bursts arriving in the divertor. Transient transport can still be observed during the ELM suppression time interval (between the two dashed lines). During the two rotation periods of the RMP field between t = 3 and  the density and temperature peaks in the divertor vary in amplitude. Phases with increased or reduced amplitude occur in both rotation periods at the same phase Φ0 (top panel).

Figure 11. Time traces of the toroidal orientation of the upper row of coils  , the divertor shunt current
  as well as the electron density and temperature measured by Langmuir probe 8ua7 in #34548. ELMs are suppressed in between the two dashed lines.
Download figure:
Standard image High-resolution imageFigure 13 shows spectrograms of the electron density measured by four radially separated Langmuir probes (8ua4, 8ua6, 8ua8, 8ua9) located at the same toroidal angle in the outer divertor with increasing distance from the strike point (see figure 12). In the spectrograms plotted as a function of time broadband fluctuations can be observed as well as fluctuation gaps during the rigid rotation. As compared to the reflectometer, the Langmuir probe measurement has a smaller bandwidth of  . Therefore, the full frequency range of the broadband fluctuations observed in the ETB (up to ∼150 kHz) can not be covered, but existence or disappearance of fluctuations are well observed. Despite all probes being located in a narrow toroidal angle range, the fluctuation gap appears in each probe at different times. This effect can be explained by tracing the field lines starting at the various Langmuir probe locations up stream until the horizontal plane of the reflectometry measurement is reached. Here the field line tracing is based on the reconstruction of the magnetic force equilibrium for #34548 and the vacuum perturbation field. Since the small RMP field does not add significantly to the rotational transform, and the plasma beta in the SOL is small, the plasma response to the RMP can be neglected for this calculation. As shown in figure 14, the field lines originating from different probes intersect with the plane of the reflectometry measurement at significantly different toroidal angles. Hence, if particle transport through the ETB into the scrape-off layer is toroidally asymmetric at this plane, the asymmetry will be seen in each Langmuir probe shifted in time during the rigid rotation. If the data is mapped again onto the helical field line label (right column of figure 13) the fluctuation gaps align very well and appear at roughly the same α as the flucutation gap observed in the ETB via reflectometry (compare to figure 8). For sake of readability we only showed spectrograms for four different probes, but the fluctuation gaps are observed in all probes that are shown in figure 12 and align with the observed trends as well. The only exception is probe 8ua1 which is located in the private flux region and is hence not connected to the horizontal plane of the reflectometry measurement. Furthermore, while the fluctuation amplitude is comparable for 8ua2 to 8ua8, a significant drop of the fluctuation amplitude can be observed from probe 8ua8 to 8ua9. The flux surface intersecting with probe 8ua9 is at
  and as shown in figure 10, this agrees with the outer boundary of the density shoulder in the SOL.

Figure 12. Poloidal cross-section showing the locations of the divertor Langmuir probes.
Download figure:
Standard image High-resolution image
Figure 13. Spectrograms of the electron density measured by Langmuir probes on the outer divertor in #34548 as a function of time (left) and α (right).
Download figure:
Standard image High-resolution image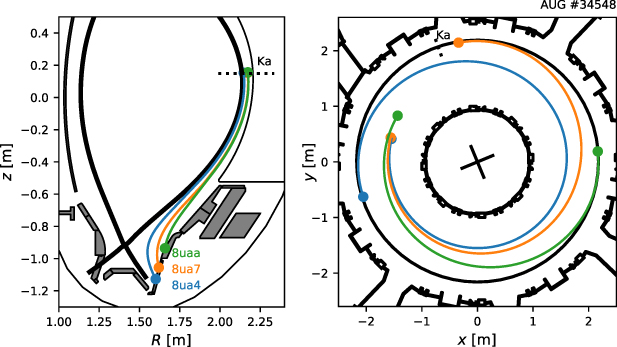
Figure 14. Poloidal cross-section (left) and top-down view (right) showing the field line tracing from 3 exemplary divertor Langmuir probes to the horizontal plane of the perpendicular reflectometry Ka-band antenna.
Download figure:
Standard image High-resolution image4.3. Toroidal asymmetry of plasma parameters
In addition to the non-axisymmetric fluctuations described above, several plasma parameters show characteristic non-axisymmetry which may have some bearing on the turbulence drive mechanism.
For shot #34548, we present and discuss measurements of the inverse gradient lengths of electron density and ion temperature as well as the radial electric field. Since the temperature measurements from Thomson scattering and ECE in the steep gradient region are less reliable, we do not include an analysis of variation in the electron temperature gradient. The density and temperature gradients pointing inwards are here defined positive.
4.3.1. Electron density and ion temperature.
On the left side of figure 15, contour plots of the inverse gradient length  are shown for the electron density as a function of the radial position R and the helical field line label α during both rotation periods. Here, the dashed black line indicates the separatrix location which is assumed to be at constant density
  . Inside the fluctuation gap at around α = 0.4–
 , a local maximum of
  is located just outside the separatrix (bright green/yellow area around
  ). Since the density shoulder is absent in this toroidal region, the density gradient is steeper in those profiles at the foot of the pedestal resulting in the observed maximum of
  . Furthermore, outside the fluctuation gap where strong broadband density fluctuations prevail,
  is smaller at the pedestal (dark blue area around
  ) possibly resulting due to the increased radial particle transport in this toroidal region. On the right side of figure 15, profiles of
  are plotted for cases inside (blue) and outside (orange) the fluctuation gap together with the ELM filtered profile from a reference discharge (grey) without the RMP field (#33 998 at t = 2.8–
 ). Due to the absence of the density pump-out effect, the electron density in the reference discharge is about 3 times higher as compared to the ELM suppressed discharge. The inverse density gradient length in the reference discharge is comparable to the inverse density gradient length measured during the rigid rotation in ELM suppression or can even exceed it when compared to profiles outside the fluctuation gap (orange). Inside the fluctuation gap (blue),
  is about 1.4 times larger than the reference case.

Figure 15. Left: contour plot of the inverse gradient length of the electron density (lithium beam) as a function of the radial position R and helical field line label α during both rotation periods in #34548. Here, α is always calculated just inside the separatrix. Right: comparison of profiles inside (blue) and outside (orange) the fluctuation gap to the reference case without RMPs (grey) of shot #33 998 at t = 2.8– .
.
Download figure:
Standard image High-resolution imageAs seen in contour plots of the ion temperature on the left side of figure 16, the maximum of  is located as well around α = 0.4–
 inside the fluctuation gap (bright yellow area). A comparison of profiles inside (blue) and outside (orange) the fluctuation gap to the reference case without RMPs (grey) is shown on the right side of figure 16. As opposed to the electron density, for the case of the ion temperature the inverse gradient length is increased throughout the whole surface corrugation pattern at least slightly as compared to the no-RMP reference and at its maximum is increased by a factor of roughly 2.5.
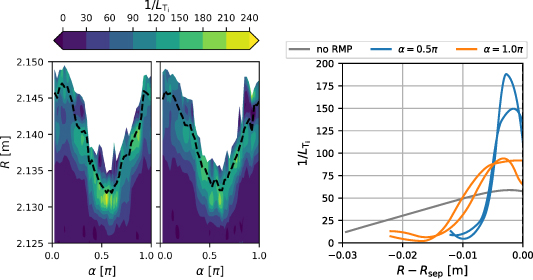
Figure 16. Left: contour plot of the inverse gradient length of the ion temperature (CXRS) as a function of the radial position R and helical field line label α during both rotation periods in #34548. Here, α is always calculated just inside the separatrix. In the white area no measurements are available. Right: comparison of profiles inside (blue) and outside (orange) the fluctuation gap to the reference case without RMPs (grey) of shot #33 998 at t = 2.8– .
.
Download figure:
Standard image High-resolution imageHigh absolute inverse gradient lengths of temperature are thought to destabilize turbulent transport, however, here we find the highest inverse gradient lengths for the ion temperature in the α range of the fluctuation gap where the density fluctuations disappear. A more natural interpretation of this observation is that the broadband turbulence produces additional radial particle and heat flux which lead to a flattening of the density and ion temperature profiles outside the fluctuation gap.
4.3.2. Radial electric field.
The radial electrical field at the plasma edge is determined from the radial force balance of impurity ions i (i is  in this case):
with the toroidal rotation  , poloidal rotation
  and pressure p of boron
  measured by Charge Exchange Recombination Spectroscopy (CXRS) [39] as well as the radial coordinate r, elementary charge e, ion charge Z, toroidal
  and poloidal
  magnetic field. Figure 17(a) shows contours of the radial electric field
  as a function of major radius R and field line label α. Since the ion temperature gradient contributes significantly to
  , the strongest
  well is located at the same α range as the extremum of the inverse ion temperature gradient length (see figure 16), which also coincides with the toroidal position of the fluctuation gap. At α ≈ 0.45–
 a maximum depth of the
  well of nearly
  is reached, which is 3 times larger than in the reference case without RMPs. In figure 17(b) two
  profiles outside (
 , blue) and inside (
 , orange) the fluctuation gap are shown, and in figure 17(c) the corresponding
  shear (
 [40]) profiles are plotted. Not only is the
  well deeper in the region of the fluctuation gap, but also narrower. This in combination leads to a strongly increased positive and negative
  shear on the outside and the inside of the
  well, respectively.
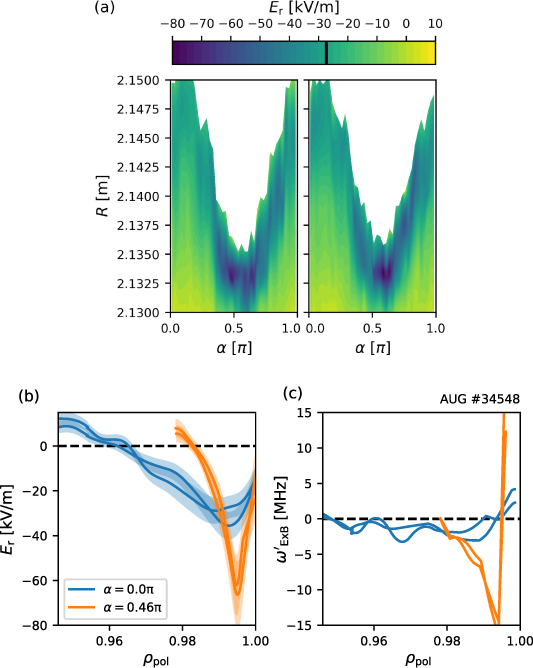
Figure 17. (a) Contour plots of the radial electric field  measured by CXRS in #34548 during both rotation periods as a function of the radial position R and the helical field line label α. Here, α is always calculated just inside the separatrix. The black marker in the colorbar refers to the
  well minimum in the reference discharge #33 998 without RMPs at t = 2.8–
 . In the white area no measurements are available. (b)
  and (c)
  shear profiles outside (blue) and inside (orange) the fluctuation gap.
Download figure:
Standard image High-resolution image4.3.3. Turbulence drift velocity.
We now compare the E × B drift velocity  obtained from the CXRS analysis with the perpendicular velocity
  of turbulent structures, as measured by the Doppler shift of microwaves diffracted at the corrugated cut-off layer with oblique incidence ('Doppler reflectometry', DRFL). As explained in [41],
  can be interpreted as the Galileian superposition of the E × B drift velocity with a phase velocity
  of a drift mode in the
  reference frame. Since the phase velocity is often negligible, DRFL is often used to obtain an estimate of the
  profile. When the phase velocity contributes significantly to
  , a comparison between CXRS and DRFL can be used to estimate a phase velocity, however, with large uncertainty. Figure 18 shows the
  profiles as measured by CXRS (blue) and approximated by
  from DRFL (orange) at two different phases α within the surface corrugation. For the evaluation of the DRFL measurement during the rigid rotation we used density profiles at the same α to calculate the backscattering location and we used poloidal cross-sections of the 3D equilibrium in order to calculate the probed wave number. In the case of
  both measurements show good agreement especially in the
  well (minimum). On the other hand, the case of
  shows a strong discrepancy between
  and
and  , especially in the depth of the
  well.
well.

Figure 18. Radial profiles of the radial electric field measured by CXRS (blue) and DRFL (orange) in #34548. Profiles are compared for for  (left) and
  (right). The vertical and horizontal dashed lines indicate the separatrix and
  , respectively.
Download figure:
Standard image High-resolution imageWhile the  profile (as measured by CXRS) still shows the pronounced deep minimum with steep flanks, the
  profile measured by DRFL shows a very flat minimum over a broad radial range,
  . The minimum of the CXRS
  profiles is tracked during both rotation periods and plotted against α in figure 19(a) (blue). For the same radial positions as the
  minima measured by CXRS also
  measured by DRFL is plotted (orange). One can see that they agree only in a small region within the surface corrugation at around
  and differ at all other values of α. Following [41], this can be attributed to a finite phase velocity of the turbulence within the plasma frame (which moves with
  ). In figure 19(b) a phase velocity
  at the same radial positions is plotted (orange) against field line label α. For comparison, we overlay half the main ion diamagnetic velocity
  (blue), evaluated using the CXRS Ti
measurement. According to our measurement, the turbulence propagates in the ion diamagnetic drift direction with a significant phase velocity of up to
(blue), evaluated using the CXRS Ti
measurement. According to our measurement, the turbulence propagates in the ion diamagnetic drift direction with a significant phase velocity of up to  . Roughly, it amounts to about
  of the ion diamagnetic velocity and varies in the same way, except for the region around
  where it vanishes. The backscattering of the microwave probing beam may be due to complex fluctuation structures resulting from the applied RMP field and not just linear flows. Therefore, a derived phase velocity might not be interpreted as the phase velocity of a simple turbulent structure. Nevertheless, the rotation direction of the underlying turbulent structures in ion direction with a substantial velocity is still identified.
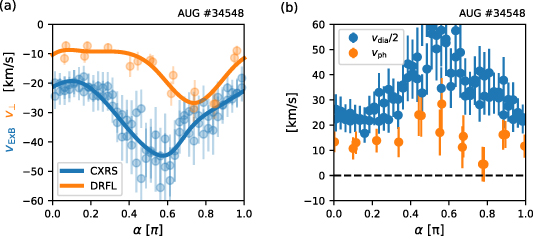
Figure 19. (a) Comparison between the minima of the ExB velocity  profiles (blue) and the perpendicular velocity
  (orange) at the radial position of the
  minimum tracked during the two rotation periods in #34548 as a function of the helical field line label α. (b) Calculated phase velocity
  and half the ion diamagnetic velocity
  at the same radial position.
Download figure:
Standard image High-resolution image4.4. Summary (broadband fluctuation)
Broadband density fluctuations are observed in the ETB during ELM suppression at moderate RMP field amplitude. A toroidal scan of these fluctuations reveals a region of reduced density fluctuations at one zero crossing of the surface displacement induced by the RMP field, dubbed the 'fluctuation gap'. Two specific observations point at the relevance of the broadband mode for radial transport: (a) the appearance of a density shoulder in the near SOL, at all toroidal positions of the broadband mode, i. e. everywhere outside of the fluctuation gap, and (b) the observation of correlated particle and energy fluxes along field lines in the divertor, again with the exception of the fluctuation gap. Hence, the broadband density fluctuations are contributing to the density pump-out induced by the RMP field. The fluctuation gap region is also special in that the  well in the H-mode ETB is deepest there and a turbulence phase velocity (in ion diamagnetic direction, as obtained from
  measurements by Doppler reflectometry) has a maximum.
5. QCM
5.1. Localization
The QCM is present in the ETB region when the applied perturbation field amplitude exceeds a certain critical value. The radial localization of the QCM in the ETB is determined by reflectometry measurements in stationary ELM suppression phases at maximum RMP field amplitude and  . In order to cover most of the ETB region, varying probing frequencies were used in discharges #35310 (2.9–
 ), #35943 (3.3–
 ) and #36514 (3.0–
 ). These discharges all utilize the same scenario in terms of toroidal field, plasma current, shaping and heating just as described in section 2. The electron density profiles of those phases are plotted in figure 20, with QCM observations coded by symbol color. Again, red color indicates that the QCM was not observed while green color indicates that the QCM was observed at that position. From these measurements the QCM is localized in the steep density gradient region in the ETB up to the pedestal top. It is not observed in the far SOL where the density profile is flatter. This observation indicates that the drive of the QCM may be related to the steep gradient in the ETB.

Figure 20. Electron density  profiles from three different ELM suppression discharges #35310, #35943 and #36514 as a function of the normalized poloidal flux coordinate
  . The dots mark the reflectometry measurement positions. Green (red) indicates that the QCM was (not) observed.
Download figure:
Standard image High-resolution imageFurthermore, the QCM is not only localized in radial direction, but also in the toroidal direction. In order to investigate the toroidal localization of the QCM, the RMP field is rotated in toroidal direction. ASDEX Upgrade has eight RMP coils in each of the two poloidally separated toroidal arrays. The large n = 2 RMP field amplitude required for the QCM is obtained if all coils are used at or near their maximum coil current, and the coil current polarity alternating after every two coils. This however means that the maximum RMP field amplitude can be achieved at only four discrete toroidal orientations separated by  phase within the n = 2 perturbation field. These four orientations are scanned in the ELM suppression discharge #35862 shown in figure 21. When the RMP field is rotated to the next orientation, the RMP field amplitude drops and slowly recovers leaving 400–
 long stationary phases for each orientation. In each of these phases, the ELMs are fully suppressed and the electron density becomes stationary again. However, in the
  orientation the electron density saturates at a slightly higher value as compared to the other orientations. For each of those four highlighted phases, the power spectral density of the reflectometry measurement taken radially at the center of the ETB is plotted with the respective color in figure 22. The QCM can only be observed at the orientation
  (red color). However, due to the finite step width of Φ0 in this experiment, and due to an unnoticed polarity reversal in one of the sixteen RMP coils at the time of this experiment (#35310, 35521, 35862, 35943, 36514) which pollutes the RMP spectrum, we cannot determine more precisely the localization with respect to the plasma surface corrugation pattern. This will be further discussed in section 6.
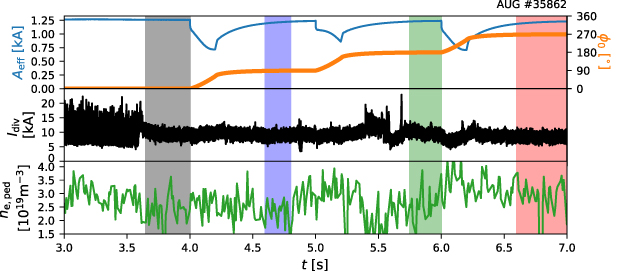
Figure 21. Time traces of discharge #35862 showing the effective RMP coil current amplitude  , the toroidal orientation of the row of coils Φ0, the divertor shunt current measurement
  and the electron density at the pedestal top
  . The colored and shaded time periods are the reference for figure 22.
Download figure:
Standard image High-resolution image
Figure 22. Power spectral density profiles of the reflectometry measurement in the center of the ETB region. The colors refer to the four different orientations scanned in figure 21.
Download figure:
Standard image High-resolution image5.2. Effect on transport
In order to investigate whether the QCM is causing radial particle transport, the RMP coil current amplitude  is modulated sinusoidally during ELM suppression in shot #35521 (see blue line in the top panel of figure 23). Here, the field modulation is performed with a frequency of
  and—accounting for the image currents in the PSL—the peak-to-peak current modulation amplitude is roughly
  . During the RMP amplitude modulation, the spectrum of the reflectometry measurement in the center of the ETB (top panel) shows transitions back and forth between states with broadband density fluctuations and with QCM. The QCM is centered around 40–
 (encircled in the figure, and not to be confused with a simultaneously occurring core tearing mode at around 20–
 ). During the RMP amplitude modulation also the electron density is modulated as seen in the middle panel. Here, the dark gray shaded time periods mark the phases in which the QCM can be observed and the light gray regions indicate the temporal uncertainty of these phases. The electron density reacts non-linearly to the RMP amplitude modulation. At high RMP amplitude, when the QCM is present, the density is low and varies little in time. When the QCM is lost due to decreasing amplitude the density starts to rise sharply, and decreases only after the RMP amplitude is raised again. This behavior indicates that the QCM participates in producing outward directed particle transport. The bottom panel of figure 23 shows density fluctuations measured at the outer divertor by an exemplary Langmuir probe. Even though none of the available Langmuir probe measurements (bandwidth
  ) is fast enough to capture the peak frequency of the QCM and none of the probes is connected via a field-line to the line of sight of the reflectometer, an increase of the lower frequency spectrum can be seen every time the QCM is present in several probes. This observation supports the role of the QCM for particle transport into the divertor.
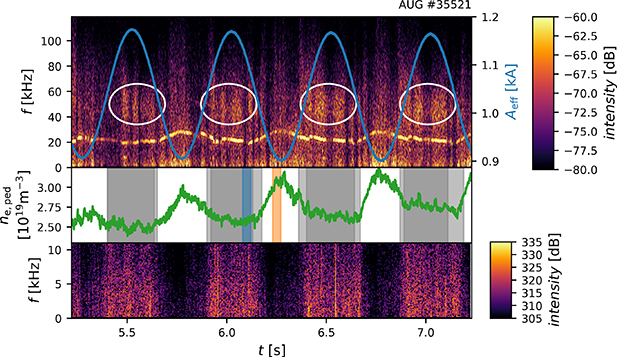
Figure 23. Spectrogram of the reflectometry measurement in the ETB (top) with a probing frequency of  overlayed by the modulated effective MP coil current amplitude. Here, the QCM is encircled in white. In the time trace of the electron density at the pedestal top
  (middle) the dark gray shading marks the time periods in which the QCM is present. The light gray region indicates its temporal uncertainty. The spectrogram shown in the bottom panel is taken from the density measurement of the divertor Langmuir probe 8ua9.
Download figure:
Standard image High-resolution image5.3. Summary (QCM)
If, in ELM suppression, the RMP field amplitude exceeds a threshold, the observed edge turbulence changes character and assumes a narrower bandwidth, so that it can be termed a 'quasi-coherent' mode. This mode is localized radially within the ETB and toroidally within the surface corrugation induced by the MP field. Simultaneously with the appearance of the QCM, a second pump-out occurs with the effect of decreasing the density further. Furthermore, density fluctuations measured on the outer divertor increase in presence of the QCM and the pedestal density increases when the mode disappears. Both observations indicate that the QCM is causing turbulent radial particle transport at least contributing to the'second density pump-out'.
6. Discussion
We have shown evidence of toroidally asymmetric broadband density fluctuations causing radial transport during ELM suppression below a critical threshold of the magnetic perturbation field. One question left is which micro-instabilities cause these observed density fluctuations. In [42, 43], overviews over micro-instabilities are given as well as descriptions of their properties. A summary of those is shown in table 1. In ELM suppression, a significant discrepancy between the E × B rotation velocity measured by CXRS and the perpendicular velocity of turbulent structures measured by Doppler reflectometry are observed. These measurements indicate that the turbulent structures are rotating in the ion diamagnetic direction, in the plasma frame, which is the case for KBMs and ITG modes. While the turbulence phase velocity is smaller than the ion diamagnetic velocity, we can observe that both velocities vary in a similar way as the RMP field is rotated. Furthermore, the toroidally asymmetric fluctuations are only observed on the low-field side of the plasma which is typical for ballooning-type modes. In ELM suppression, the inverse normalized ion temperature gradient length is increased by a factor of up to 3 over the inverse normalized electron density gradient length. These observations favor micro-instabilities driven by the ion temperature gradient such as KBMs and ITG modes.
Table 1. Overview of the characteristics of micro-instabilities including the kinetic ballooning mode (KBM), micro tearing mode (MTM), electron (ETB) and ion (ITG) temperature gradient modes and trapped electron mode (TEM). Included is the drive (by which gradient), propagation direction (electron or ion drift direction), frequency (as compared to the electron or ion diamagnetic frequency  ), spatial scale (wave number in poloidal direction times
  ), poloidal parity (tearing or ballooning) and ratio of the ion to electron temperature heat conductivity
  ). This data is taken from [42, 43].
| Mode | KBM | MTM | ETG | ITG | TEM |
|---|---|---|---|---|---|
| Drive |

|

|

|

|
 , , 
|
| Direction | i | e | e | i | e |
| Frequency |

|

|

|

| |
| Scale |

|

|

|

|

|
| Parity | ball. | tear. | ball. | ball. | ball. |

| ≈ 1 |

|

| ≈ 1–4 | |
As used here, Doppler reflectometry is sensitive to turbulence of the scale  –1.5 as calculated by TORBEAM [44]. This is in the range of ITG modes (
 ). However, also large scale turbulence such as expected from KBMs (
 ) can transfer energy into smaller, detectable scales.
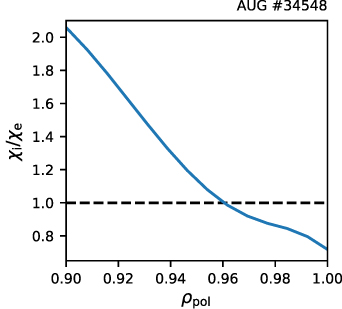
The ratio of ion and electron heat conductivity shown in figure 24 (calculated from power balance using the ASTRA code [45]) in the region of the  well is about 1 or slightly below, which is about the expectation for KBM type turbulence.
Figure 24. Radial profile of the ratio of ion  to electron
  heat conductivity as calculated from power balance.
Download figure:
Standard image High-resolution image
These observations suggest that the micro-instabilities leading to the observed broadband turbulence and associated enhanced transport across the ETB at moderate RMP amplitude could be KBMs or ITG modes.
We have shown that above a critical threshold of the magnetic perturbation amplitude, a QCM appears which leads to a second pump-out reducing the electron density even further. What should be emphasized is that the QCM clearly appears at the onset of the second density pump-out effect and can, therefore, not be considered as a consequence of the profile changes due to the density pump-out effect. The exact toroidal localization of the QCM within the plasma surface corrugation is not possible (a) because the QCM appears above a certain threshold of the applied RMP field amplitude, which can not be achieved with a rigidly rotating field, and (b) due to the wrong wiring of one of the MP coils at the time of the experiment which leads to an additional significant n = 1 RMP field overlapping the n = 2 field. However, assuming that the n = 2 perturbation field dominates the plasma surface corrugation, than the toroidal phase in which the QCM appears is equivalent to the phase of the turbulence gap and the phase at which a localized ballooning mode was identified during ELM mitigation in [36] indicating that the QCM might be a ballooning type mode. This works highlights the importance of 3D geometry on ballooning stability and identifies a minimum of the local magnetic shear (field-line torsion) at this point as the critical geometrical parameter that governs ballooning stability.
In analogy to ballooning stability, the local magnetic geometry can also govern helical localization of micro-instabilities, a question which is being treated by gyrokinetic models for stellarators (see e. g. [46]). We note that both the broadband fluctuation and the QCM described here depend on the application of the RMP field in ASDEX Upgrade and disappear on a short time scale of ms when the RMP field is removed. Furthermore, it is commonly observed during ELM suppression in ASDEX Upgrade that the electron density is non-stationary when operating at a reduced RMP field amplitude without the QCM. This leads to a loss of ELM suppression once the density exceeds the empirical threshold for ELM suppression. On the other hand, discharges with high RMP field amplitude and the presence of the QCM typically exhibit a stationary electron density.
These observations highlight the importance of RMP-induced transport for achieving ELM suppression: the additional transport in the ETB and close to the pedestal top due to magnetic perturbations (the pump-out effect) reduces the pedestal density and pressure such that the plasma is kept stable against ELMs. Future work has to investigate how known access criteria for ELM suppression such as windows of the edge safety factor  [47] or plasma rotation [48, 49] affect edge transport.
Another open question is the assessment of the relative importance of turbulent transport in comparison with competing transport mechanisms, especially neoclassical transport of the plasma edge with magnetic perturbations [21], possibly in presence of magnetic islands [19] or an edge ergodized layer [15], a topic for which more experimental and theoretical work is needed.
7. Conclusion
We describe turbulence phenomena which appear during the suppression of edge-localized modes with magnetic perturbations in experiments at ASDEX Upgrade. Below a critical threshold of the magnetic perturbation field, broadband density fluctuations are present in the ETB during ELM suppression. These fluctuations have a toroidal asymmetry revealing a region within the plasma surface corrugation at which the fluctuations are suppressed, possibly due to E × B shearing—this region is dubbed the 'fluctuation gap'. A connection between the density fluctuations outside the fluctuation gap and density fluctuations measured in the outer divertor was found proving that radially outward directed particle transport can be associated with the observed fluctuations in the ETB. Therefore, turbulent transport plays a role for the 'density pump-out' effect commonly observed during ELM suppression. Measurements of the phase velocity of the turbulent structures indicate that turbulent structures propagate fast (with several 10 km s−1 in the  plasma frame) in the ion diamagnetic direction. Based on our observations, we note that kinetic-ballooning modes or ion-temperature gradient modes might be candidates for the underlying micro-instability.
Furthermore, above a critical threshold of the magnetic perturbation field strength, a quasi-coherent appears in the ETB close to the pedestal top during the transition from ELMy to ELM suppression. The QCM is correlated with a second density pump-out. Similar to the broadband density fluctuations, the QCM is toroidally localized within the plasma surface corrugation. The exact toroidal localization of the QCM has not yet been successful, however, there are indications it is probably located at the position of the fluctuation gap.
Our findings emphasize the importance of RMP-enhanced radial transport, the 'pump-out' effect, for ELM suppression, as it can be used to control the edge pedestal density and pressure just below the values at which ELMs appear, and thus allows to maintain a stationary ELM-free H-mode plasma edge.
Acknowledgments
This work has been carried out within the framework of the EUROfusion Consortium and has received funding from the European Union's Horizon 2020 research and innovation programme under Grant Agreement No. 633053. The views and opinions expressed herein do not necessarily reflect those of the European Commission.