


Abstract
Toward real-time wall conditioning, impurity powder dropping experiments with boron powder were performed in the 22nd experimental campaign of the Large Helical Device. To examine the deposition and desorption process of boron, we focus on boron hydride (BH) molecules which presumably populate near plasma-facing components. We performed spatially-resolved spectroscopic measurements of emission by boron ions and BH molecules. From the measurement, we found that BH and B+ were concentrated on the divertor viewing chord, which suggest boron deposition in the divertor region. By comparing Hγ emissions with and without boron injection, neutral hydrogen shows uniform reduction in the SOL region, whereas less reduction of neutral hydrogen is confirmed in the divertor region. Although emissions from BH and B+ increased linearly, emissions by B0 and B4+ became constant after the middle of the discharge. Continuous reduction of carbon density in the core plasma was confirmed even after B0 and B4+ became constant. The results may show reduction of hydrogen recycling and facilitation of impurity gettering by boron in the divertor region and thus effective real-time wall conditioning.
Export citation and abstract BibTeX RIS

Original content from this work may be used under the terms of the Creative Commons Attribution 4.0 licence. Any further distribution of this work must maintain attribution to the author(s) and the title of the work, journal citation and DOI.
1. Introduction
Wall conditioning [1] is essential for controlling hydrogen recycling and the amount of intrinsic impurities to achieve high performance plasmas in magnetically-confined fusion devices. A conventional technique, boronization, is conducting glow discharge to evaporate borane gases and coating the chamber walls with boron.
To realize real-time wall conditioning without handling toxic borane gases, a multi-species impurity powder dropper (IPD) [2] was developed in the Princeton Plasma Physics Laboratory, and installed in the ASDEX-upgrade [3], the DIII-D tokamak [4], the EAST [5], the KSTAR [6], the Wendelstein 7-X [7] and the Large Helical Device (LHD) [8]. Its powder feeder uses a piezo-electric actuator to vibrate a trough, to advance horizontally a layer of powder off the end, and to fall into a drop tube and fall directly into the plasma gravitationally. The system allows us to control the injection timing and the amount of impurities, and the improvement of plasma confinement is confirmed [7, 9, 10]. The preceding studies mainly focused on the reaction of the core to scrape-off-layer (SOL) plasmas, and the measured information of plasma-surface interaction was limited to post-discharge analyses of samples. Bortolon et al [4] performed surface analyses by the DiMES and MiMES systems in the DIII-D tokamak after IPD experiments. They confirmed reduced wall fueling, recycling and impurity content, as well as formation of a B-C layer on graphite samples exposed during boron injection. Lunsford et al [11] summarized temporal variations of emissions from boron and intrinsic impurities from the main plasma between shots in the LHD. They also investigated the building up of boron layers by inserting stainless steel samples at a relevant position on the first wall, and compared the boron coating by the IPD with a standard B2H6 boronization. Their post-discharge analyses revealed the difference between the two methods of the composite depth profile of the boron and the impurity layers. In addition to these sample analyses, it is important to monitor the behavior of boron near the plasma-facing component (PFC) during powder dropping to confirm the wall coating effect by the IPD.
Spectroscopic measurement is a powerful tool to monitor populations of atoms and molecules. Emission from boron hydride (BH) molecules have been often observed after fresh boronization [12–17]. On the other hand, the chemical processes of BH have not been investigated extensively in fusion devices, compared to carbon hydride (CH) molecules, of which flux represents the erosion of carbon walls and divertors [12, 13, 15–17]. If BH behaves similarly to CH, we expect that BH molecules are formed near the surface of the PFC on which boron density is high. In addition, BH is thermodynamically unstable and formation of BH from atoms is an endothermic process [18]. BH molecules will be formed less in the gas phase, but B–H bonds are formed more on the walls. B–H bonds on the surface will desorb into the gas phase via BHn , and dissociate quickly. Therefore, BH molecular spectroscopy can be a good diagnostic for real time monitoring of the deposition and desorption processes near the wall surface, as CH molecular spectroscopy is.
In addition to the population of atoms and molecules, the positions of boron deposition on the PFC in the vessel is also essential for evaluating the effectiveness of wall conditioning. From the viewpoint of reduction of intrinsic impurities, boron coating onto divertor tiles is efficient, since the impurities are transported from the divertor and limiters into the main plasmas via the magnetic field. Regarding hydrogen recycling, hydrogen is absorbed into the first wall and divertor plates. The distribution of hydrogen is very complicated, since it depends on physical parameters of the plasmas and the surface, wall structure, wall materials, and so on. Shoji et al [19, 20] investigated boron transport supplied by the IPD using a three dimensional plasma fluid and the kinetic neutral edge transport Monte Carlo code (EMC3-EIRENE), coupled with a dust transport simulation code and a three-dimensional simulation by the Monte-Carlo impurity transport and plasma surface interaction code (ERO2.0) for LHD plasmas. They predicted trajectories of dropped granules into the plasma, and identified regions of high plasma flux and neutral particle density in the inboard side divertor of the torus. Effenberg et al [21] also performed an EMC3-EIRENE simulation to examine where the boron ions are transported and deposited from the location of powder injection and how uniformly impurity source can cover the PFC for the DIII-D. They showed that the distribution of boron can be controlled by appropriately tailoring the density of the plasma, and the boron density and divertor fluxes show an even distribution in the case of low collisionality. Effenberg et al [22] measured distribution of B II emission by a camera with a band-pass filter during DIII-D experiments with boron powder injection. They observed B II emission concentrated in a layer close to the PFCs, which is consistent with the temperature dependency of the cooling potentials calculated under non-coronal equilibrium conditions. These numerical and experimental studies provide how dropped boron is transported in the plasmas. In order to know experimentally where boron is deposited as a result of transport, we need spatially-resolved spectroscopic measurements of BH molecules with a field of view that covers the first wall and divertor plates.
In this study, we performed a spatially-resolved spectroscopic measurement of a BH molecular band during operation of the IPD in the LHD for the first time, which enabled us to examine where the dropped boron deposited, and how much boron was desorbed/sputtered during discharges. Since we can also measure hydrogen and intrinsic impurity emissions at the same time, these experiments allow us to discuss the effects of hydrogen recycling and impurity reduction. This paper consists of the following structures: in section 2, we overview the experimental conditions. In section 3, the results of spectroscopic measurements are summarized. In section 4, we focus on the spatial distribution of the BH emission and examine the deposition region of boron. In section 5, time evolutions of boron emissions are examined and the amount of desorbed boron from the PFC is investigated. Finally in section 6, we discuss the effectiveness of wall conditioning, based on the measured results.
2. Summary of experiments
The LHD [23, 24] is a superconducting heliotron/stellarator type device, which consists of helical and poloidal coils for forming helically twisted magnetic field configurations without toroidal current. The magnetic field lines were bundled into four divertor legs [25], and the divertor configuration was formed intrinsically. Electron temperature distribution was monitored by a Thomson scattering measurement [26]. Electron density distribution was calibrated by a far-infrared interferometer measurement [27] after spatial distribution was obtained by the Thomson scattering measurement. Radiation power was measured by bolometers [28]. Fourteen sets of Langmuir probe arrays (20ch) were placed on the divertor plates, and they measured plasma parameters at the divertors with a time resolution of 2 ms [29, 30]. To supply fueling gas, gas puff systems were installed and the amount of injecting gas was controlled by piezo valves [31]. A charge exchange spectroscopy (CXS) measurement at C VI 529.05 nm was performed to obtain radial profiles of temperature, density and rotation velocities of fully ionized carbon (C6+) [32, 33].
The experiments in this study were performed in the 22nd LHD experimental campaign. To illustrate the effects of boron powder to the main plasma and PFC, we examined two neighboring shots, #169625 and #169626, in which boron powder was injected or not injected, respectively. We show the summary of the discharges in figure 1. During the experiments, the operating radial position of the magnetic field, Rax, and the toroidal magnetic field, Bt, were 3.6 m, and 2.75 T, respectively, and the direction of the toroidal magnetic field was counter-clockwise. The heating pattern of the two discharges were the same as shown in figure 1(a). Electron cyclotron resonance heating (ECH) was performed as the ignition of the plasma during t = 3.2–3.4 s, and three beam lines of neutral beam injection (NBI#1–#3) heating were used to sustain the plasma from t = 3.3 s for five seconds. One beam line of neutral beam (NBI#4) was used for the CXS, and the beam flux was modulated with a period of 240 ms. The species of the operating gas and the beam particle was hydrogen. Electron density was kept between 1.8–2.2 m−3 at the magnetic axis during the discharges by a gas-puff feedback control. The control voltages of the piezo valves for the gas puff system are shown in figure 1(b). The figure suggests that the resulting amount of injected gas between the two discharges were almost the same.
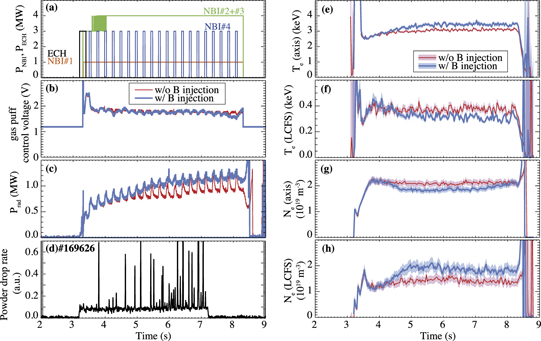
Figure 1. Shot summary of experiments in this study. (a) Heating power by NBI (red, green, and blue) and ECH (black) for shots #169625 and #169626. (b) Control voltage of piezo valves of gas puff system at ports 5.5L (blue and red). (c) Radiation power. (d) Drop rate of boron powder measured by flow meter for shot #169626. (e) Electron temperature at magnetic axis of confined plasma. (f) Electron temperature at LCFS of confined plasma. (g) Electron density at magnetic axis of confined plasma. (h) Electron density at LCFS of confined plasma. In (b), (c) and (e)–(h), thin red and thick blue show data of #169625 (without boron injection) and #169626 (with boron injection), respectively, and light-colored regions show errors in data.
Download figure:
Standard image High-resolution imageThe IPD system in the LHD [8] was installed at an upper port of the LHD, indicated in figure 2(a). As introduced in section 1, the IPD has a capability to control as well as monitor the dropped powder. Based on the setting voltage, the powder is dropped into the plasmas by vibrating the powder reservoir by piezo blades [2]. An accelerometer measures the amplitude of the vibration of the powder reservoirs. A flow meter consists of a collimated beam of visible light crossing a guide tube and a light detector, and it measures the injection rate by the attenuation of the visible light. The injection rate measured by the flow meter during the experiments with boron injection (#169626) is shown in figure 1(d). As shown in the figure, powder was dropped between t = 3.2–7.2 s. In the experiment the size of each boron particle was about 150 μm. The estimated injection rate from the accelerometer during the experiment was about 30 mg s−1. It takes about one second for boron powder to reach the plasma [8], and the numerical study of transport and erosion processes [19] suggests that powder is ablated around the last closed flux surface (LCFS). In figure 1(c), we can see that radiation power started to depart between these discharges from t ∼ 4.5 s, which is 1.3 s after the powder started to drop. Evolutions of electron temperature and density at the magnetic axis and the LCFS are shown in figures 1(e)–(h). By comparing between discharges with and without boron injection, the electron temperature and density were increased and decreased about 10%, respectively, at the magnetic axis. At the LCFS, the electron temperature decreased about 25%, and the electron density increased about 30%. These temperature and density behaviors can be a signature of improved confinement, as discussed in Nespoli et al [10].
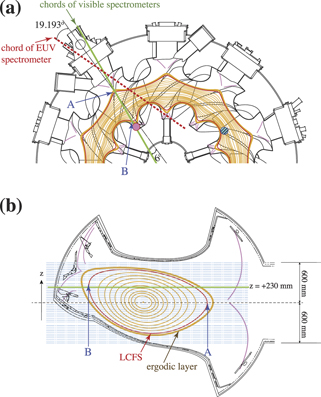
Figure 2. Line of sight of visible spectrometers. (a) Half equatorial cross section of LHD. Solid green line shows lines of sight of two visible spectrometers. Dotted red line shows line of sight of EUV spectrometer. Positions of powder dropper (blue circle, hatched) and Langmuir probe array examined in this study (pink circle) also shown. (b) Plane of chords of visible spectrometers. Light-blue dot-dashed lines indicate lines of sight of the 1.33 mVis spectrometer. Divertor viewing chord is shown by thicker green line. Black dotted line shows plane of magnetic axis. In (a) and (b), thin orange curves are magnetic flux surfaces; red curves show LCFS; thick orange curves show ergodic layer; pink curves show divertor legs under equilibrium condition of Rax = 3.6 m and β = 0.22%. A and B indicate outer and inner edges of LCFS in plane of chords of spectrometers.
Download figure:
Standard image High-resolution image3. Overview of the spectroscopic measurements
In this study, we analyze data obtained by two visible spectrometers, 1.33 mVis [34] and 50 cmVis [35], and one extreme ultraviolet (EUV) spectrometer, EUV short [36]. 1.33 mVis is a Czerny–Turner-type spectrometer (McPherson model 209) with a focal length of 1.33 m. It was equipped with a 1800 line/mm grating, and the width of the entrance slit was 30 μm. It was connected to 44 optical fibers with a diameter of the core of 100 μm. It covered a wavelength range of 430.82–435.70 nm at the same time, and spectral sampling at the detector was 4.78 pm per pixel. 50 cmVis is a Czerny–Turner-type spectrometer (Chromex 500is) with a focal length of 50 cm. It was equipped with a 100 line/mm grating, and the width of the entrance slit was 50 μm. It was connected to 40 optical fibers with a diameter of the core of 100 μm. It covered a wavelength range of 300–800 nm at the same time, and spectral sampling on the detector was 0.52 nm per pixel. In both visible measurements the chords were aligned with an interval of 26 mm. Rays into exits of the all fibers were collimated, and the field of view of each chord was 30 mm. The time resolution of the visible spectrometers was 200 ms. The fiber arrays of 1.33 mVis and 50 cmVis were placed in parallel at a distance of 23 mm. The lines of sight of the 1.33 mVis spectrometers are shown in figure 2(b). To relate the viewing chords to the structure in the device, we define Z coordinate as vertically upward, and its origin is on the plane of the magnetic axis, as shown in figure 2(b).
EUV short is a flat-field grazing spectrometer. It covered a spectral range of 0.65–6.08 nm at the same time, and spectral sampling spanned 2.9–7.7 pm per pixel depending on the wavelength. The detector was operated at 'full binning mode', in which the signals perpendicular to the dispersion were integrated. Although there was no spatial resolution, this operation mode reduced the noise and allowed us to measure as high a time resolution as 5 ms. In this paper, we integrate 50 ms to further reduce noise. The detailed setup was the same as the experiments described in Oishi et al (2021) [37]. We also show the viewing regions of the spectrometers projected to the equatorial plane in figure 2(a).
Here we overview the observed spectra. Examples of obtained spectra by each spectrometer in the discharges without boron injection (#169625) and with boron injection (#169626) are shown in figure 3. In the figure we averaged over all the chords in each spectrometer and over time between t = 5–7 s, i.e., 2–4 s after the start of boron injection into the discharge #169626. In the figure, we labeled identified emission lines. The wavelengths of the identified emission lines from atoms and ions are confirmed by the Atomic Spectra Database of the National Institute of Standards and Technology [38]. Regarding the EUV spectra, the emission lines were also confirmed and discussed in Oishi et al (2021) [37]. The wavelengths of BH molecules are identified by the molecular constants summarized by Herzberg [39] and Huber and Herzberg [40]. In the Q-branch of the (0, 0) band of the electronic transition A1Π–X1Σ+, the band head is located at 433.17 nm, and lines formed by the level J = 1–17 overlapped between 433.17–433.27 nm. As we see in the figure, boron emissions were strongly enhanced in the discharge with boron injection (#169626), and lines emitted by other elements such as hydrogen, oxygen and carbon were reduced in both visible and EUV ranges. Note that Hα intensities were saturated in the 50 cmVis measurements, and the difference of Hα between the discharges shows less significant in figure 3.
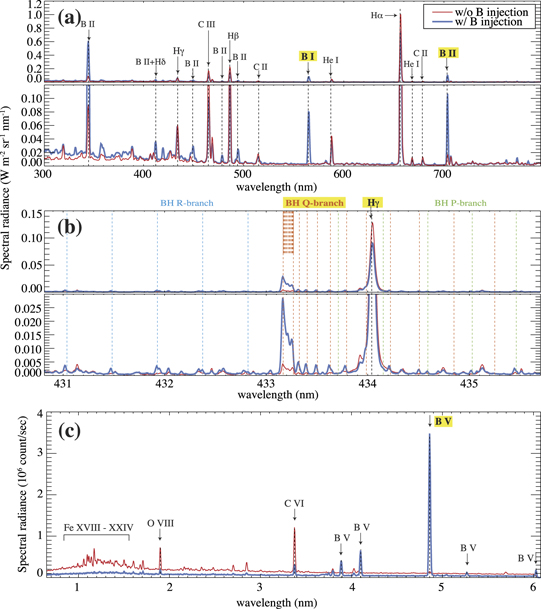
Figure 3. Examples of spatially-averaged spectra obtained during t = 5–7 s in discharges without boron injection (#169625; thin red) and with boron injection (#169626; thick blue). (a) Spectra obtained by 50 cmVis. Top and bottom panels show different radiance scales. (b) Spectra obtained by 1.33 mVis. Calculated BH wavelengths of (0, 0) band of P-branch (green), Q-branch (orange), and R-branch (light blue) indicated by dotted lines. Note that 17 lines overlapped between 433.17 and 433.27 nm and not all lines indicated in the figure. Top and bottom panels show different radiance scales. (c) Spectra obtained by EUV short. Labels in bold font highlighted by yellow are emission lines focused on in this paper.
Download figure:
Standard image High-resolution imageIn the following sections we analyze spatial distribution and temporal evolution of line emissions. We focus on the emission lines; B I 563.3 nm and B II 703.2 nm obtained by 50 cmVis, Hγ 434.0 nm and BH 433.2 nm by 1.33 mVis, and B V 4.86 nm by EUV short. The ionization potentials of B0, B+ and B4+ are 8.30, 25.2 and 340 eV, respectively [38]. The dissociation energy and ionization potential of BH are 3.42 eV and 9.77 eV, respectively [40]. Thus, we can roughly say that B I and B II are formed in the divertor and outer scrape-off layer regions, whereas B V is formed around the inner SOL and edge regions. Photometric calibrations were performed for visible data but not for EUV data. The line intensities of B I, B II, and Hγ are derived by a single Gaussian fitting, whereas those of the BH A1Π–X1Σ+ band and B V are derived by a summation of spectral radiance in some pixels of the detectors, of which corresponding wavelength ranges are 433.06–433.29 nm and 4.4–5.2 nm, respectively. The continuum emissions were subtracted from the intensities.
4. Spatial distribution of boron ions and BH molecules
In order to examine densities of atoms and molecules in the plasma near the PFC, we investigate the spatial distribution of line emissions obtained by the visible spectrometers, as shown in figure 4. From the figure during the boron injection, we can see that B I and Hγ were emitted diffusely, whereas emissions of B II and BH showed a peaked profile in space. By comparing figure 2, the position of the peaks correspond to the chords that were viewing the inboard closed divertor at around z = +230 mm. In figure 4, the spatial distributions and temporal evolutions of BH and B II in the discharge with boron injection resemble each other. To quantify how much behaviors of these emissions resemble, we calculate a cross-correlation coefficient, ρ, between the two dimensional images of BH emission, IBH(z, t), and B II emission, IB II(z, t), by the following formula;
where  and
and  are averages of IBH(z, t) and IB II(z, t), respectively, over z and t. The calculated cross-correlation coefficient is 99%. Thus, if we assume that BH molecules are formed close to the wall, B+ ions can achieve high density at the same region where BH is populated. The dissociation energy of BH is low compared to the electron temperature of the typical divertor plasma, and this assumption for BH molecules is reasonable. In addition, formation of B+ near PFC is consistent with the results observed by Effenberg et al [22].
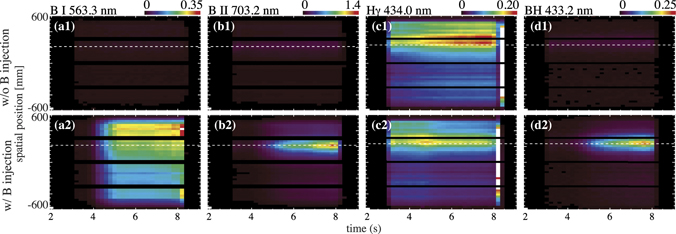
Figure 4. Spatial distribution and temporal evolution of (a) B I, (b) B II, (c) Hγ, and (d) BH. (a1)–(d1) Show intensities in W m−2 sr−1 in #169625. (a2)–(d2) Show intensities in W m−2 sr−1 in #169626. Continuum intensity is subtracted in each figure. White dotted lines show position of ch 31 and ch 28 in 1.33 mVis and 50 cmVis, respectively.
Download figure:
Standard image High-resolution imageHere we show the distribution of BH, B I, B II during the discharge with boron injection in figure 5(a) as well as Hγ intensities of the two discharges and the intensity ratio between the discharges in figure 5(b). In both figures, we pick up the distribution at t = 6.0 s, at which boron powder was being injected and interacting with plasmas. Hγ emitted diffusely from the main plasma as discussed, and the reduction of the Hγ emission to 60% is confirmed in the discharge with boron injection, except for the region around the divertor viewing chord. Around the divertor viewing chord, a peaked profile in the ratio of Hγ emissions is confirmed. The flat profile of the intensity ratio in Z < 0 mm suggests that the density of neutral hydrogen reduced uniformly around the SOL plasma and that a weaker reduction of neutral hydrogen occurred in the divertor region.

Figure 5. Observed emission distributions of BH (solid black), B I (dotted red), B II (dashed blue) at t = 6.0 s. Observed emission distributions of Hγ during shot without boron injection (#169625; thin red) and with boron injection (#169626; thick blue) at t = 6.0 s. Intensities are normalized by maximum of Hγ intensity during shot without boron injection. Ratio of Hγ intensities between two discharges with and without boron injection at t = 6.0 s shown as black curve. Vertical black dotted line and green dot-dashed line indicate position of magnetic axis (z = 0) and divertor viewing chord of 1.33 mVis (z = 234 mm), respectively.
Download figure:
Standard image High-resolution image5. Evolution of boron ions and BH molecules in gas phase
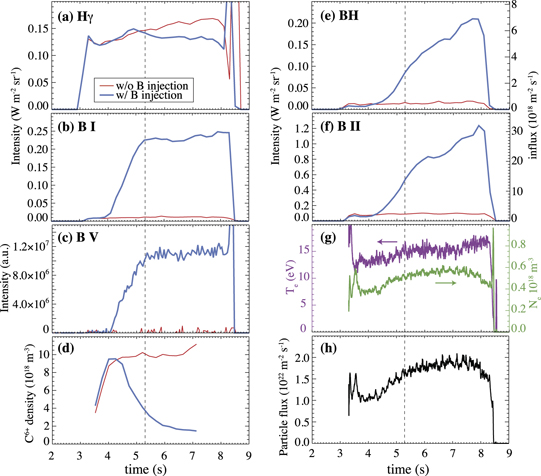
To understand the evolution of boron deposition and desorption on the divertor plate, we focus on the temporal evolution at the chord which observes the inboard divertor during boron injection. In figure 6, we pick up the intensity evolution at the divertor viewing chords in 1.33 mVis and 50 cmVis as well as spatially integrated B V intensity obtained by EUV short. We also show the evolution of C6+ density on the magnetic axis measured by the CXS and those of the electron temperature and density, and particle flux on the divertor plate, measured by the Langmuir probe array. In the data taken by the Langmuir probe array, we take a running mean of ten frames and averaged over all 20 channels to reduce the noise. The intensity of Hγ peaked at t = 4.9 s and after that it gradually decreased about 15% until the end of the discharge. The intensities of all boron lines started to increase from t = 4.2 s, at which boron powder presumably reached the plasma. At the same time, the C6+ density started to decrease and it continued decreasing until the end of the measurement at t = 7.15 s. As discussed in the previous sections, intensities B II 703.2 nm and BH 433.22 nm showed the same tendency of the temporal evolution as well, and they continued increasing until the end of the discharge. B I and B V flattened at t = 5.3 s, at which the electron density at the LCFS also flattened in figure 1(h). According to measurements by the Langmuir probe array, the electron density, temperature, and particle flux on the divertor plate increased to 20% after t = 5.2 s, and the temporal evolutions do not correlate with either BH or B I. We can assume that the sputtering yield does not change significantly after t = 5.2 s. Thus, the increase of BH and B II intensities suggests an increase of boron density on the divertor plate due to boron powder injection.
Figure 6. Temporal evolutions of intensities of (a) Hγ, (b) B I 563.3, (c) B V, (d) C6+ density on magnetic axis measured by CXS, (e) BH, (f) and B II in discharges without boron injection (#169625; thin red) and with boron injection (#169626; thick blue), (g) Te and Ne on divertor, and (h) particle flux onto divertor. (a), (b), (e) and (f) Are data in divertor viewing chords marked in figure 4. Influxes of BH and B II also shown in right axes. Vertical dashed lines show t = 5.3 s, after which flattening structure appeared in evolutions of B I and B V.
Download figure:
Standard image High-resolution image
Although passive spectroscopy cannot quantify the deposition amount on the PFC directly, we can estimate the particle flux of BH and B+ near the PFC. In this study, we adopt a simple model of collisional excitation and ionization/dissociation processes under the collisional-radiative excitation equilibrium assumption. By using an inverse photon coefficient [41], S/XB, we can directly relate the intensity of line emission to an influx of ions by Γ = (4πλ/hc)(S/XB)I, where Γ is an influx to the ion state, λ is the wavelength of the observing photon, h is the Planck constant, c is the light speed, S is the ionization rate, X is the excitation rate to the upper level of the examined transition from the ground state, B is the branching ratio, and I is the observed intensity in an energy unit. In cases of molecules, S is replaced by D, the dissociation rate. In this study, S/XB of B II 703.2 nm is derived by solving the rate equation in the ADAS with the collision strength belike_nrb03#b1.dat and the ionization rate dere07#b.dat. Under the collisional-radiative excitation equilibrium approximation at Te = 15 eV and Ne = 5 × 10¹⁷ m−3, [S/XB]B II is 0.582. Regarding the transition rate of BH, the data is limited. A D/XB of the BD A1Π–X1Σ+ transition was shown as 1.2 under a condition of divertor plasmas of Te = 15 eV and Ne = 1 × 10¹⁹ m−3 [12, 18]. Assuming that the electronic transition rates do not change much between BH and BD and that D/XB does not depend much on the electron density between 1017–1019 m−3, we adopt this value as [D/XB]BH to estimate the influx. Under these fixed S(D)/XB, time-dependent influxes of BH and B+ are derived, as shown in figures 6(e) and (f). Compared with the particle flux obtained by the Langmuir probe array, fluxes of BH and B+ into the divertor plasma are 10−4 and 10−3 times the particle flux into the divertor plate, respectively.
6. Discussions
In this study, we successfully utilize the BH molecular spectroscopy for the real-time boronization and observe distribution and evolution of boron deposition/desorption for the first time. Here we summarize the experimental results. We performed visible and EUV spectroscopic measurements during boron IPD experiments in the LHD, and compared two discharges in which the difference in conditions was with and without boron powder injection. We confirmed that B I, B II, B V and BH line emissions were enhanced after boron injection, whereas hydrogen and other impurity line emissions were reduced. Spatial distribution of the boron emission shows that B I emitted from the SOL plasmas, whereas the emission of B II and BH was localized in the divertor viewing chord. Temporal evolutions of the line emissions show that boron emissions started to increase after about 1 s of the boron powder injection (t ∼ 4.0 s). B I and B V became almost constant from t = 5.3 s, whereas B II and BH continued increasing until the end of the discharge. Under a collisional-radiative excitation equilibrium approximation, the particle fluxes of BH and B+ into the divertor plasma were ∼(1–7) × 1018 and ∼(1–3) × 1019 m−2 s−1, respectively, whereas particle flux into the divertor plate was derived as ∼(1–2) × 1022 m−2 s−1 from the Langmuir probe array.
Intensities of BH lines have a strong correlation with the boron density on the PFC [42]. In Shoji et al [19], they predicted distribution of boron flux on PFC by a numerical study of transport in the LHD configuration, and identified the high flux in the inboard divertor region. The spatial distribution of the BH intensity suggests that injected boron powder was transported and covered especially on the divertor plate, and the observed results agree well with the distribution of boron flux calculated by Shoji et al. The temporal evolution of BH intensity also shows that the deposition amount increased linearly depending on the total injected amount of boron powder. The injection rate of the boron powder was  mg s−1 =
  atoms s−1, whereas desorption rates of BH and B+ were
  and
and  particles s−1, respectively, by assuming area of the deposition region as a few m2 in the entire device. These simple estimates suggest that about 10% of injected boron covered onto the divertor, although the estimated boron flux can contain desorbed, re-deposited and re-desorbed particles. In addition, desorption of BH at the divertor has a minor contribution to boron and hydrogen release, which is also discussed by BD emission after fresh boronization at a limiter [13]. The obtained influx of BH in this study is comparable to that of a divertor plasma in the ASDEX-U after conventional boronization [18]. Therefore, the deposition amount of boron by the IPD is a similar value as by conventional boronization, and that by the IPD, especially effective at the divertor region.
Why the B I emission is not concentrated on the divertor region but is distributed so widely may be speculated on by the less emissivity in the divertor region and the transport and recombination processes in the gas phase. If we assume influx of B0 in the divertor region as the similar value of that of B+, i.e., 3.0 ×10¹⁹ m−2 s−1, the intensity of B I 563.3 nm is estimated to be 7.1 × 10⁻⁴ W m−2 sr−1. Here we take the same procedure described in section 5 and refer the collision strength and ionization rate of B I in the ADAS by jj#b0.dat and dere07#b.dat, respectively. The estimated intensity in the divertor region is ∼0.3% of the measured intensity, and thus negligible compared to the emission from the main plasma. On the other hand, B+ ions after injection and sputtering will be populated in the main plasma by being transported along the magnetic field, and the formation of B0 is expected by recombination from B+ in the outer stochastic layer.
From the viewpoint of reduction of neutral hydrogen and impurities, the measured results may represent reduction of hydrogen recycling and facilitation of impurity gettering on the divertor plate. Spatial distribution of Hγ suggests uniform reduction of neutral hydrogen around the SOL region. On the other hand in the divertor plasma, the reduction is weaker compared with the SOL region. This result suggests that the source of the hydrogen desorption is located around the divertor region. Regarding the temporal evolution, a decrease of the carbon density itself is reasonable by considering the constant electron density in the main plasma in figures 1(g) and (h) during increasing boron density. However in the measurement, the carbon emission continues decreasing, even after the flattering of B I and B V emissions. The flattering of B I, and B V intensities suggests that the amounts of boron injection and boron exhaust are balanced in the main plasma. Thus, the decrease of carbon, especially after the flattering of B I and B V emissions, may represent that the source of the carbon particles is blocked, i.e. impurity gettering on the divertor plate. A long-term impurity reduction and effectiveness for hydrogen recycling during IPD experiments were already reported by Bortolon et al [4] and Lunsford et al [11]. Our study also confirms the real-time reduction of hydrogen recycling and of impurities by boron powder dropping, by validating the deposition region.
We should note that the values of the particle flux by the spectroscopic measurements in this study are a rough estimation. In the current situation, BH molecular data are not sufficient for detailed analyses of the quantitative estimation of the molecular processes. An estimation with higher precision requires detailed examination of chemical/population kinetics, chemical sputtering processes as well as molecular data of each transition, and such fundamental data should be prepared in the future.
Acknowledgments
The authors would like to thank the LHD experimental team for supporting the experiments. This work was conducted within the framework of the NIFS/PPPL International Collaboration and it is supported by the US DOE under Contract No. DE-AC02-09CH11466 with Princeton University. The data that support the findings of this study are available upon reasonable request from the authors.