


Abstract
The role of the divertor configuration and divertor plasma physics on the L–H transition is poorly understood, leading to large uncertainties in predicting the L–H power threshold in future devices. This contribution reports on edge perpendicular plasma flow measurements by Doppler backscattering in JET L–H transition experiments with the outer divertor strike-point at different positions: horizontal target (HT), vertical target (VT), and in the corner configuration (between the HT and VTs). The edge perpendicular flow was found to be significantly affected by changes in the divertor configuration in the region inside the separatrix. Our results do not show evidence for the existence of a critical edge flow shear needed to achieve H-mode for different divertor configurations, with a larger shear observed for the VT configuration. No significant change in the shear flow and in the density fluctuation level is measured preceding the L–H transition in the region just inside the separatrix. The dynamics of the L–H transitions are also influenced by the divertor configuration with divertor oscillations (DOs) observed only in the HT configuration. Interestingly, DOs are associated with marked changes in the edge perpendicular flow around the separatrix.
Export citation and abstract BibTeX RIS

Original content from this work may be used under the terms of the Creative Commons Attribution 4.0 licence. Any further distribution of this work must maintain attribution to the author(s) and the title of the work, journal citation and DOI.
1. Introduction
The current extrapolations for the ITER L–H power threshold are based on a widely used multi-machine scaling law [1]. However, parameters not included in the scaling law, such as the divertor configuration, cause a considerable scatter. Studies in different devices (e.g. DIII-D [2], C-MOD [3], MAST [4] and JET [5–12]) have shown that the divertor configuration can vary the L–H power threshold, PLH, by up to a factor of two and may therefore have a large impact on future devices. In particular, large uncertainties still exist on how to extrapolate PLH to ITER with a divertor design featuring deep, baffled vertical targets (VTs) [13].
Modifications in the divertor configuration are often associated with changes in the lower triangularity, distance between the X-point and the strike-points, location of the strike-points and their distance to the pump throat. These in turn may result in a large number of modifications that are difficult to distinguish, including the connection length, scrape-off layer (SOL) flows, pumping efficiency and recycling.
The shear in the perpendicular plasma flow, v⊥, driven by a radial electric field, Er, is considered to be essential for the edge turbulence suppression (e.g. [14, 15]). Measurements of v⊥ at the plasma edge are therefore required to better understand the turbulence suppression process associated with the L–H transition. A threshold in the E × B flow minimum was found in ASDEX Upgrade for the H-mode onset [16], suggesting the existence of a critical flow shear to achieve H-mode. At JET, a fairly constant value of the diamagnetic term was also reported across the range of parameters explored [5]. The observation that changes in the boundary conditions resulting from the divertor configuration modify the H-mode power threshold suggests that the SOL physics and in particular the outer shear layer may be relevant for the L–H transition. In this context, the determination of the v⊥ profile at the midplane is of particular relevance, including the SOL region that is directly linked with the divertor conditions.
EDGE2D-EIRENE simulations of JET L-mode plasmas showed a significant difference between Er profiles across the separatrix in two divertor configurations (outer strike point on the horizontal target, HT, and VT) [17]. A large positive Er spike in the near SOL was seen for HT configuration, leading to a very large E × B shear across the separatrix. No such Er feature was seen for the VT configuration, where the H-mode power threshold was found to be twice as high as in the HT configuration [17]. Considering that a critical E × B shear flow may be required to achieve the L–H transition, depending on the divertor configuration different input power levels could be necessary to reach such critical shear. The possible existence of a critical flow shear to achieve H-mode is addressed in this paper resorting to edge v⊥ measurements obtained by Doppler backscattering (DBS) in JET experiments with different outer divertor strike-point positions.
2. Description of the experiment
Several L–H transition experiments have been performed on JET to investigate the importance of parameters such as divertor geometry, plasma current and isotopic mass (e.g. [5–12, 18–20]). Here we report on JET L–H transition experiments with the outer divertor strike-point at different positions: tile 5 of the HT; VT; and in the corner (CC) configuration (between the horizontal and VTs close to the cyropump opening). Figure 1 shows the magnetic equilibria in the divertor region for the three shapes. The main plasma shape has been kept roughly similar with the three shapes having a similar elongation and surface area. However, apart from variations in the location of the strike-points, the configurations under consideration also have very different pumping characteristics, X-point height and lower triangularity. The pumping efficiency is best in CC, while the X-point height is similar for CC and HT, but higher for VT. The lower triangularity is substantially higher for HT configuration, δl HT = 0.37, than for CC and VT configurations, δl CC = 0.26 and δl VT = 0.24 respectively. As reported before (e.g. [11]), after subtracting the core radiation, VT and CC configurations have similar L–H power threshold in the high density branch, which is roughly a factor of two larger than in HT. Perpendicular velocity measurements by DBS are available at JET for L–H transition experiments in HT, CC and VT configurations at 3 T/2.5 MA using NBI heating in the co-current direction. Measurements are also available at 2.4 T/2 MA with ICRH heating but only for VT and HT configurations.

Figure 1. Magnetic equilibria in the divertor region for three shapes with the outer divertor strike-point at different positions: HT (black); VT (red); and corner, CC (blue).
Download figure:
Standard image High-resolution imageDBS is a microwave diagnostic that measures radially localized propagation velocity and fluctuation level of intermediate wavenumber turbulent density structures. Motion of the density turbulence near the cutoff layer induces a Doppler frequency shift (fD) in the backscattered signal given by fD = v⊥ k⊥/2π, where v⊥ = vE×B + vphase is the perpendicular velocity of the turbulence moving in the plasma, k⊥ is the perpendicular wavenumber and vphase is the phase velocity of the fluctuations. For the edge plasma, the E × B velocity term generally dominates (e.g. [21]) and the radial electric field can be obtained from DBS by neglecting the phase velocity. The scattering wavenumber of the density fluctuations is determined via ray tracing [22]. For the data presented here the probed k⊥ around the pedestal region is ∼5.5 cm−1 for discharges in HT, k⊥ ≈ 5 cm−1 in CC and k⊥ ≈ 3 cm−1 in VT.
DBS measurements in this work were obtained with the W-band (75–110 GHz) and V-band (50–75 GHz) channels of the JET X-mode correlation reflectometer [23, 24]. The radial location of the measurements is controlled by the pre-programmed launch frequency pattern. Measurements are localized using an electron density radial profile averaged over the DBS sweep time (≈300 ms) obtained with the profile reflectometry system. The JET correlation reflectometer was used recently to characterize the edge v⊥ at the L–H transition [19], where further details of the diagnostic and analysis methods can be found.
Figure 2 shows, as an example, the temporal evolution across the L–H transition of the line-averaged density, NBI heating power and Dα emission at the inner divertor target for a representative discharge in CC configuration. As illustrated, L–H transitions are typically induced by ramping up the input power, keeping the plasma density roughly constant. The time of the L–H transition is indicated by the black vertical solid line and the last full sweep of the DBS probing frequency before the L–H transition indicated by the red vertical dashed lines. The profiles shown for VT configuration at 3 T/2.5 MA (figures 3 and 5) were obtained differently. To improve the quality of the measurements, the experiment used longer (typically 3 s) NBI power steps and then the NBI power scanned from discharge to discharge while keeping the plasma density constant. This approach is particularly useful to study the evolution of the perpendicular velocity and density fluctuation level along the heating ramp as presented in figure 5.
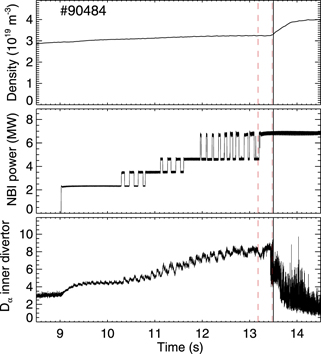
Figure 2. Temporal evolution across the L–H transition of the line-integrated density, NBI heating power and Dα emission at the inner target for discharge #90484 at 3 T, 2.5 MA in CC configuration. The time of the L–H transition is indicated by the black vertical line and the last full sweep of the DBS probing frequency before the L–H transition indicated by the red vertical dashed lines.
Download figure:
Standard image High-resolution image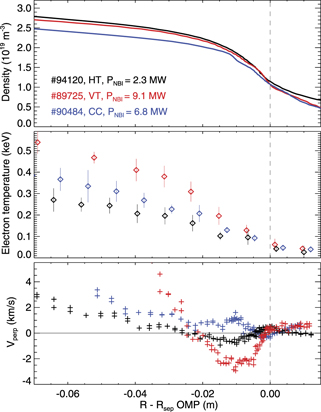
Figure 3. Radial profiles of electron density, electron temperature (both averaged over 300 ms) and mean perpendicular velocity at the L–H transition for different divertor configuration in NBI heated plasmas at 3 T, 2.5 MA. The line-averaged density and the NBI power are as follows: #94120 ( = 3.3 × 10¹⁹ m−3, PNBI ∼ 2.3 MW), #89725 (
 = 3.5 × 10¹⁹ m−3, PNBI ∼ 9.1 MW), #90484 (
 = 3.3 × 10¹⁹ m−3, PNBI ∼ 6.8 MW). A positive v⊥ corresponds to the ion diamagnetic drift direction.
Download figure:
Standard image High-resolution image3. Edge perpendicular velocity at the L–H transition
The perpendicular velocity measured by DBS has been analysed at the L–H transition for discharges in HT, CC and VT configuration at 3 T/2.5 MA using NBI heating. Representative discharges with matching line-averaged electron density,  ≈ 3.4 × 10¹⁹ m−3, were selected for our study corresponding to the high density branch in the different configurations. Figure 3 presents the v⊥ radial profile for the different divertor configurations together with the radial profiles of the electron density obtained with the profile reflectometry system and of the electron temperature measured by the high resolution Thomson scattering. Measurements are taken in the last full sweep of the DBS probing frequency before the L–H transition. Transition dithers are observed before a clear L–H transition for the discharge in HT configuration leading to modulations in the edge v⊥ profile. As stationary periods are required to obtain a consistent v⊥ profile, data is taken before such events in this case, corresponding to PNBI = 2.3 MW, while a sustained L–H transition occurs at PNBI = 3.6 MW. Interestingly, higher SOL densities are seen for the HT configuration, which may be related with the different recycling conditions. As illustrated in figure 3, a deeper v⊥ well is measured at the L–H transition for the VT configuration, v⊥ ≈ −2.5 km s−1, which is significantly deeper than for HT, v⊥ ≈ −0.75 km s−1. Furthermore, the v⊥ profile for CC does not show a well (v⊥ ≈ 1 km s−1 at the expected well location). A possible explanation could be that the main ion rotation in CC configuration is compensating the negative contribution of the diamagnetic term in the radial force balance equation making the E × B velocity positive. It is clear that no critical edge shear flow exists, as the v⊥ radial gradient varies significantly with divertor configuration. The edge v⊥ and its shear are significantly larger for the VT configuration across most of the probed region but particularly just inside the separatrix where the edge transport barrier is formed.
The variation in PLH with divertor configuration suggests that changes in the SOL may influence the L–H transition and in particular the outer shear (just inside the separatrix). The SOL parameters at the midplane are expected to be modified by the different divertor conditions, leading to changes in the perpendicular flow near the separatrix. However, the v⊥ profile in the SOL exhibits modest differences across the configurations analysed here, with changes observed mainly in the confined region. The impact of the divertor configuration in v⊥ is therefore not limited to the SOL as would be expected in case of resulting directly from changes in the divertor region.
The diamagnetic term in the radial force balance equation was previously reported to be similar at the L–H transition in plasma conditions where PLH varies substantially (e.g. when comparing L–H transitions in hydrogen and deuterium [12, 16] or when varying the density [16, 19]). The observed variations in PLH could be explained by differences in the edge temperature or density profiles such that more power would be required to reach the same kinetic profiles. However, this is not the case when changing the divertor configuration [6, 8]. The density profiles in the confined region are roughly similar at the L–H transition between the divertor configurations, but the electron temperature is significantly higher for the VT configuration than for HT. As illustrated in figure 3, the electron temperature before the L–H transition at the location where the pedestal top forms is almost twice as high for VT than for HT configuration due to the significantly lower PLH in the latter, with the value for CC roughly in the middle of the other two. This may lead to differences in the contribution of the diamagnetic term to the edge perpendicular flow between VT, CC and HT but cannot explain the striking changes measured by DBS between the VT and CC configurations at the expected well location and in particular the positive v⊥ observed for CC.
The edge toroidal rotation induced by the NBI torque also does not appear to be the main justification for our observations as no correlation is seen between v⊥ at the expected well location and PLH for the different divertor configurations (PLH VT > PLH CC > PLH HT while at the well location v⊥ CC > v⊥ HT > v⊥ VT).
To further clarify the possible effect of the external torque induced by NBI on the L–H transition, ICRH only heated discharges at 2.4 T, 2 MA are now analysed. Figure 4 presents the radial profile of the electron density and mean perpendicular velocity at the L–H transition for VT and HT configurations with a line-averaged density of  ≈ 3.4 × 10¹⁹ m−3, corresponding to the high density branch. Note that no minimum in PLH was found for VT within the explored density range at 2.4 T. Unfortunately, no DBS data is available for the CC configuration at 2.4 T with ICRH heating. Divertor oscillations (DOs) are observed before the L–H transition for the discharge in HT configuration leading to modulations in the edge v⊥ profile and are described in section 5. Measurements are performed before such events in this case corresponding to PICRH = 2.6 MW while the L–H transition occurs at PICRH = 3 MW. Again, the depth of the v⊥ well is substantially larger for VT configuration, v⊥ ≈ −3 km s−1, than for HT, v⊥ ≈ −1.3 km s−1. The v⊥ radial profile for the VT configuration at PICRH = 2.6 MW (corresponding to the input power used in the HT configuration) is also shown in figure 4, revealing that even at the same input power a significant difference is seen in the v⊥ radial profile between VT and HT. Our results indicate that also in the absence of external torque, no critical shear flow is seen at the L–H transition, with a larger edge outer flow shear measured for the VT configuration.

Figure 4. Radial profiles of electron density and mean perpendicular velocity at the L–H transition for VT and HT configurations in ICRH heated plasmas at 2.4 T, 2 MA. The profile for the VT configuration at PICRH = 2.6 MW and the depth of the diamagnetic term estimated from the electron kinetic profiles are also shown. The line-averaged density and the ICRH power are as follows: #94117 ( = 3.4 × 10¹⁹ m−3, PICRH ∼ 2.6 MW), #94118 (
 = 3.5 × 10¹⁹ m−3, PICRH ∼ 6.3 MW).
Download figure:
Standard image High-resolution imageSince edge charge exchange recombination spectroscopy data is not available for the dataset used here, the edge ion pressure and ion rotation profiles cannot be estimated. The diamagnetic contribution, v⊥,dia was estimated from the electron kinetic profiles assuming Ti = Te, which is the case for JET plasmas near the pedestal top region [5]. The minimum in v⊥,dia and its radial position are shown in figure 4. A larger contribution is seen for VT, v⊥,dia VT ≈ −4.6 km s−1, than for HT, v⊥,dia HT ≈ −3.3 km s−1. The higher PLH in VT configuration leads to a larger edge Te radial gradient and translates into a deeper v⊥,dia well. Interestingly, the minimum in v⊥,dia and in the measured v⊥ are not located at the same radial position. The steep edge density gradient region (essentially defining the position of the v⊥,dia minimum for these L-mode plasmas) is located radially further out than the location of the measured v⊥ minimum. This is also the case for the 3 T NBI heated plasmas (see figure 3), with the v⊥ well located radially further inside than the steep edge density gradient region (sharpest density gradient located at R − Rsep ≈ −0.5 cm).
As illustrated in figure 4, at the same ICRH power, the minimum in v⊥,dia is similar for VT and HT plasmas. However, clear differences are seen in the measured v⊥. This may indicate that the main ion rotation has a relevant contribution to the perpendicular flow. Another possibility is that the assumption of Ti = Te does not hold up to the separatrix. However, the positive v⊥ measured at the expected well location in CC configuration (see figure 3) suggests the existence a strong toroidal rotation in the edge. Previous measurements at JET showed that the toroidal flow contributes significantly to the radial force balance equation in the well region near the L–H transition [5]. The dependence of the main ion rotation on the divertor configuration cannot be attributed alone to the torque induced by NBI as differences in v⊥ dependent on the divertor configuration are also seen in ICRH heated plasmas. A possibility is that the edge toroidal rotation is directly modified by the interaction with neutrals, for instance due to differences in the charge-exchange friction with edge neutrals as a consequence of configuration induced changes in the main chamber neutral density. This hypothesis would be consistent with JET observation reported in [25], showing a stronger pedestal toroidal velocity for the CC configuration than for VT and HT, as well as a lower neutral pressure in the main chamber. Unfortunately, we do not have measurements of edge rotation to confirm if these observations also hold for the dataset studied here. Experiments on C-MOD with varying magnetic separatrix topologies have also shown that the H-mode power threshold correlates with the toroidal rotation velocity of the L-mode plasma [26].
Recent v⊥ measurements at the L–H transition by DBS for different line-averaged densities have found a density dependent v⊥ well (v⊥ well becoming deeper with increasing line-averaged electron density) possibly explained by the existence of an edge toroidal flow mainly relevant at low density [19]. The dependence of v⊥ on the divertor configuration may also be explained by the existence of an edge toroidal flow. Our results suggest that the toroidal rotation just inside the separatrix gives an important contribution to the radial force balance equation, in addition to the pressure gradient term of the main ion species. This appears to be particularly relevant for the CC, where no well is seen (positive v⊥ at the expected well location). The results presented here on the influence of the divertor configuration give further experimental evidence that no critical value of v⊥ or v⊥ shear is seen at the L–H transition, complementing the recent observations reported in [19] on the effect of the line-averaged density.
The dependence of the edge toroidal flow on the divertor configurations could also be due to changes in the SOL flow resulting from the different boundary conditions driving modifications further inside in the confined region as suggested in [26]. However, this is likely not the case for our experiment as modest differences are seen in the measured SOL v⊥ across divertor configurations.
4. Evolution along the heating ramp
This section focuses on the characterization of edge perpendicular flow evolution when approaching the L–H transition for different divertor configurations aiming at understanding its role in triggering the transition. The temporal evolution of the mean perpendicular velocity radial profiles is presented in figure 5 for selected periods along the NBI power ramp up to the L–H transition for VT and CC configurations. The v⊥ profile for HT configuration (not shown) displays a modest temporal evolution as a consequence of the low PLH and note that the evolution of the v⊥ profile approaching the L–H transition for HT configuration was studied in [19] for both the low and high density branch.
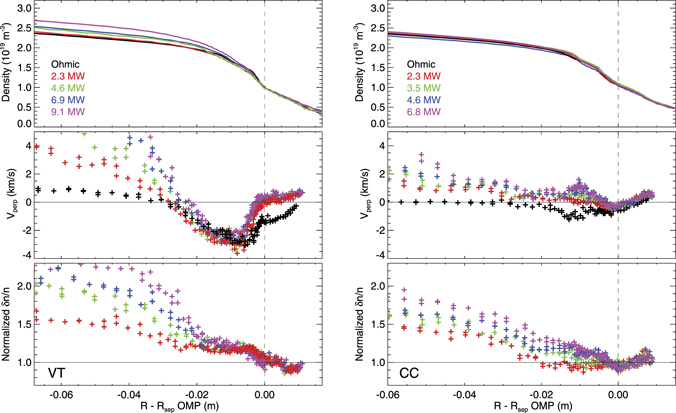
Figure 5. Radial profiles of density, mean perpendicular velocity and density fluctuation level (normalized to the profile in the ohmic phase) at different NBI power levels for VT (#89722, #89723 and #89725, left) and CC (#90484, right) configurations at 3 T, 2.5 MA. The L–H transition occurs at PNBI ∼ 9.1 MW for VT and at PNBI ∼ 6.8 MW for CC.
Download figure:
Standard image High-resolution imageAs the NBI heating is applied, v⊥ in the confined region tends to increase due to the NBI torque but then shows a small evolution with the NBI power up to the transition in the region where the transport barrier is formed. Interestingly, no significant changes of the perpendicular flow are observed along the power ramp at the bottom of the well for VT, which is very broad in this case. For the CC configuration, no significant evolution is seen across the edge and SOL above PNBI = 3.5 MW, while for VT a small increase is seen in inner shear when approaching the transition, which is likely due to changes in the toroidal rotation profile induced by the NBI torque. The SOL v⊥ is also observed to increase when the NBI power is applied for VT, which is consistent with the expected variation of the divertor conditions (increase in the divertor target electron temperature radial gradient with input power).
The observations reported above show that the H-mode access is not exclusively defined by the mean v⊥ profile. Other explanations may involve the possible influence of turbulence driven flows, such as zonal flows and geodesic acoustic modes, in triggering the L–H transition (e.g. [27–29]). The L–H transition is expected to be triggered when the edge shearing rate is of the order of the growth rate of the L-mode edge turbulence, which may depend on the divertor configuration. Therefore, to understand the L–H transition, apart from estimating the flow shear, it is also required to characterize the edge turbulence.
The density fluctuation level was estimated from the JET DBS measurements for the different divertor configurations. Note that we can only estimate variations of the density fluctuation level with respect to reference measurements as the diagnostic is not absolutely calibrated. The temporal evolution of the density fluctuation level normalized to the profile in the ohmic phase is also shown in figure 5 for different NBI power levels. At the L–H transition, the density fluctuation levels inside the density pedestal (R − Rsep ⩽ −2 cm) is larger than in the ohmic phase by a factor of 1.5–2 for the CC configuration and 2–3 for the VT configurations. However, in the region just inside the separatrix (−2 < R − Rsep < 0 cm), the increase is modest (∼20%). For the CC configuration, the turbulence levels in the steep density gradient region and near the pedestal top are slightly reduced (∼10%) when the NBI power is applied but then ohmic values are recovered and exceeded later on along the heating power ramp. In the SOL, a reduction in the density fluctuation level is observed at some locations when the NBI power is applied, with the turbulence levels not varying significantly throughout the power ramp. In summary, no significant change in the shear flow and in the density fluctuation level is measured preceding the L–H transition in the region just inside the separatrix, where the transport barrier is formed. However, for the diagnostic settings used here, the temporal resolution of the measurements is ∼300 ms for each probing frequency. Therefore, the possibility that changes occur near the transition in a time scale below 300 ms cannot be excluded.
5. Divertor oscillations
The dynamics of the L–H transition are also influenced by the divertor configuration. DOs, are commonly observed before the L–H transition in the high density branch in the HT configuration, but not in the VT and CC configurations. It has been reported before (e.g. [9, 30]) that DOs appear at medium to high densities when the heating power is close to the L–H transition threshold. DOs are characterized by Dα emission oscillations in phase opposition at the inner and outer divertor with a repetition rate in the order of few tens of Hz. This is illustrated in figure 6 (left panels, #94126) showing the typical behaviour of a discharge with DOs at JET. In this case, DOs are followed by dithering L–H transitions with frequency around 130 Hz. The temporal resolution of the measurements for the diagnostic settings used in this experiment (≈300 ms) limits the study of such fast dynamics near the transition. Fortunately, in discharge #94115 DOs had a long period with a change from low to high inner divertor Dα emission phase at t ≈ 10.88 s (figure 6, right panels), allowing for the characterization of the edge v⊥ in each of the DO states (low and high inner divertor Dα emission).
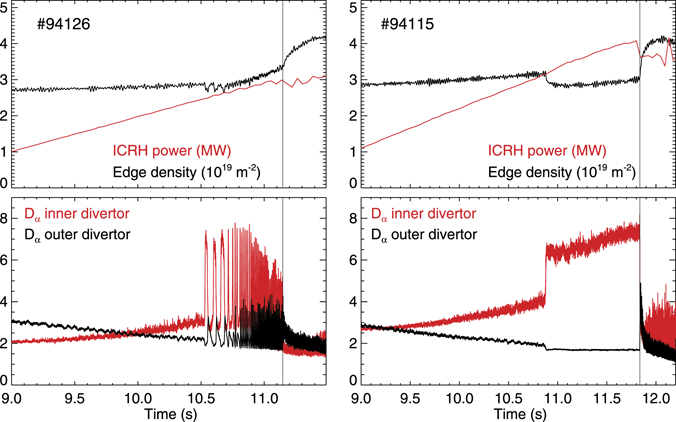
Figure 6. Temporal evolution of line-integrated edge density, heating power and Dα emission at the inner and outer target for discharges #94126 and #94115 at 2.4 T, 2 MA. The time of the L–H transition is indicated by the vertical line.
Download figure:
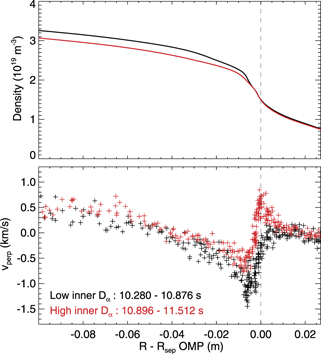
Standard image High-resolution imageFigure 7 presents the radial profile of the electron density and mean perpendicular velocity in the low and high inner divertor Dα emission phases of the DO for discharge #94115. Apart from the modulation in the divertor parameters, DOs also induce changes in the edge electron density as illustrated in figures 6 and 7. Interestingly, DOs are associated with marked changes in the v⊥ around the separatrix with profiles in the high inner divertor Dα emission phase exhibiting a peak near the separatrix. The fact that the transition is typically observed to occur in the high inner divertor Dα emission phase of the DOs indicates that they could play a role in triggering the L–H transition as suggested in [9].
Figure 7. Radial profiles of electron density and mean perpendicular velocity in the in low and high inner divertor Dα emission phases of the DOs for the ICRH heated discharge #94115 at 2.4 T, 2 MA.
Download figure:
Standard image High-resolution image
A large positive Er spike near the separatrix was seen in modelling results, depending on divertor conditions [17]. Modelling showed a large positive Er spike in the near SOL for HT configuration (similar to the HT configuration used here), leading to a very large E × B shear across the separatrix, where the H-mode power threshold is lower, while no such Er feature was seen for the VT configuration, where the H-mode power threshold is much higher than in the HT configuration. However, our results show that v⊥ in the near SOL is not larger for HT than for VT (see figures 3 and 4). For the 3 T discharge, no DOs are observed just before the L–H transition in HT configuration (#94120) and no marked positive v⊥ peak is measured in the near SOL (see figure 3). The HT discharge at 2.4 T (#94117) exhibits DOs with the profiles shown in figure 4 obtained before such events. Again no evidence for a positive v⊥ peak in the near SOL is found for this configuration before the DOs.
Although no evidence was found for the existence of a positive v⊥ peak in the near SOL before the DOs, the observation of such a peak during the DOs preceding the L–H transition suggests that they could play a role in triggering the L–H transition in the HT configuration. A systematic study of the v⊥ profile evolution during the DOs as the L–H transition is approached should be performed. While the temporal resolution of the measurements limits the study of the fast dynamics near the transition, methods such as conditional averaging may prove to be appropriate.
6. Summary
The perpendicular plasma flow measured by DBS at the outer midplane is significantly affected in the region inside the separatrix by the change of divertor configuration. However, it is surprising that the divertor configuration, which has a strong effect on the divertor physics and on the L–H power threshold, has a modest effect on the SOL perpendicular flow. Our results do not show evidence for the existence of a critical edge flow shear needed to achieve H-mode for different divertor configurations. Differences in the edge kinetic profiles are observed at the L–H transition with a larger contribution from the diamagnetic term seen for VT configuration due to its higher PLH. However, the dependence of the H-mode access on the divertor configurations cannot be explained by the kinetic profiles in the region where the pedestal forms. The observations reported here suggest that the toroidal rotation just inside the separatrix may give an important contribution to the radial force balance equation.
Our data clearly indicates that changes in the boundary conditions due to the divertor configuration can impose strong modifications in the edge perpendicular flow. The findings presented here, together with recent observations reported in [19] and summarized above, suggest that the perpendicular plasma flow profile measured by DBS is influenced by the edge rotation velocity, which depends on plasma parameters such as the line-averaged density [19] and on the boundary conditions such as the magnetic topology.
No significant variation in the edge perpendicular velocity and in the density fluctuation level is observed along the power ramp preceding the L–H transition in the region just inside the separatrix, where the transport barrier is formed. Finally, it is shown that the dynamics of the L–H transitions are also influenced by the divertor configuration with DOs commonly observed in the HT configuration, but not in the VT and CC configurations. Interestingly, the high inner divertor Dα emission phase of the DOs exhibits a positive v⊥ peak near the separatrix that may play a role in triggering the L–H transition.
Acknowledgments
This work has been carried out within the framework of the EUROfusion Consortium, funded by the European Union via the Euratom Research and Training Programme (Grant Agreement No. 101052200—EUROfusion). Views and opinions expressed are however those of the author(s) only and do not necessarily reflect those of the European Union or the European Commission. Neither the European Union nor the European Commission can be held responsible for them. IST activities also received financial support from 'Fundação para a Ciência e Tecnologia' through projects UIDB/50010/2020 and UIDP/50010/2020.