


Abstract
Nitrogen seeded detachment has been achieved in the tokamak a configuration variable (TCV) in alternative divertor configurations (ADCs), namely X-divertor and X-point target, with and without baffles in H-mode plasmas with high core confinement. Both ADCs show a remarkable reduction in the inter-ELM particle and heat fluxes to the target compared to the standard divertor configuration. 95%–98% of the inter-ELM peak heat flux to the target is mitigated as a synergetic effect of ADCs, baffling, and nitrogen seeded detachment. The effect of divertor geometry and baffles on core-divertor compatibility is investigated in detail. The power balance in these experiments is also investigated to explore the physics behind the observed reduction in heat fluxes in the ADCs.
Export citation and abstract BibTeX RIS

Original content from this work may be used under the terms of the Creative Commons Attribution 4.0 licence. Any further distribution of this work must maintain attribution to the author(s) and the title of the work, journal citation and DOI.
1. Introduction
High particle and heat fluxes deposited in a narrow region at the divertor target challenges the operation of future tokamaks like ITER and DEMO [1, 2]. If unmitigated, target heat fluxes would easily exceed material limits of ∼10 MW m−2 [3]. Detached divertor operation [4–6], where a large fraction of the divertor power is dissipated through impurity radiation, plasma–neutral interactions, and volumetric recombination, is the key to steady-state plasma exhaust in future tokamaks. The detachment process typically sets in at target plasma temperatures below ∼5 eV [7–9] and results in a reduction of target heat flux, temperature, and ion flux which is important to reduce target erosion [10]. Detachment can be attained by increasing separatrix density [7, 12–14] or by impurity seeding [11, 15, 16]. The latter is predicted to be necessary in a reactor, due to confinement degradation at high upstream density [17] and the Greenwald density limit [18]. It is usually found that divertor detachment degrades the plasma confinement, as the detachment front cools the core plasma through degrading the H-mode pedestal [16, 19–22]. To avoid core degradation, ITER plans to operate with a partially detached divertor [23, 24], where only the portion of the strike point close to the separatrix is detached [19].
Minimizing any adverse impact on the core confinement while improving the detached operation regime is challenging but crucial in obtaining reliable power exhaust solutions for future reactors. Recent DIII-D experiments, demonstrating fully detached divertor plasmas sustained with high core confinement [25], were a step forward towards this goal. Despite a degraded pedestal associated with divertor detachment, improved core-edge integration was attained by a self-organized plasma state with a low pedestal and a strong ITB, which improved the core confinement [25]. In AUG, real-time control of the X-point radiator with nitrogen seeding facilitated fully detached operation [26] with ∼95% dissipation of the total power entering the divertor. An ELM-suppressed regime was also observed at a certain height of the radiator above the X-point, with minimal reduction of confinement, combining key requirements for a reactor.
Nevertheless, in DEMO, the exhausted thermal power from the main plasma to the scrape-off layer (SOL) is expected to be 150–300 MW, that is about 1.5–3 times higher than predicted in ITER (∼100 MW) [27]. Achieving detached H-mode operation in DEMO will thus be considerably more challenging than for ITER [28, 29]. Intense impurity seeding levels are expected to achieve the radiated power fraction of ∼95% needed to reach detachment in such conditions, which may be seriously detrimental to the core plasma. In addition, the first wall in DEMO will be considerably more fragile than in ITER due to the tritium breeding structures [30]. A reliable heat exhaust solution for future reactors like DEMO may require alternative divertor concepts that cannot be tested in the conventional divertor used for ITER [31, 32]. Exploration and assessment of alternative concepts, in parallel and with reference to the conventional divertor program in ITER, is needed to ensure the timely progress in exhaust solutions for DEMO and future reactors [28, 32]. Alternative concepts include alternative divertor configurations (ADCs) employing complex divertor geometries [31, 33–35] and/or liquid metal divertor targets [36]. Increasing divertor baffling also offers cooler divertor conditions and promotes access to detachment [37, 38]. ADCs aim to reduce the power and particle loads to the target by (i) increasing the volume of the radiative region in the SOL and divertor, thereby increasing the dissipated power, (ii) extending the wetted area by increased cross-field transport, e.g., through increased turbulence, and (iii) enhancing positional stability of the detachment front e.g., by flaring of the flux surfaces in front of the target. Amongst today's most promising ADCs are: the X-Divertor (XD) [39–41] with large poloidal flux expansion (fx ) at the outer strike point (OSP), the X-point target (XPT) [42] geometry with a secondary X-point near the target, resulting among others, to a large connection length (L||), the super-X divertor (SXD) with large total flux expansion [43], and the Snowflake divertor (SF) with an additional X-point close to the primary one [44, 45]. Unique shaping capabilities of TCV's generous poloidal magnetic field array, and wide divertor diagnostic coverage [46] makes it particularly suitable for exploring the behavior of a range of ADCs with an immediate comparison to a similarly shaped conventional single null (SN) configuration at a proof-of-principle level.
Divertor detachment has been studied in TCV in L-mode confinement, SN configurations [15, 47], and for several ADCs: the SF [44, 48], XD [34, 49], SXD [34], and XPT [34]. An increasingly pronounced roll-over in ion flux at the divertor targets, indicating deeper detachment, and lower peak parallel ion saturation currents as compared to SN were observed in XD configurations. However, the detachment threshold was not strongly affected by fx [34]. A reduced radiation region location sensitivity to line average density was also observed in the XD which is crucial for stronger detachment control. The decrease in the detachment threshold with increasing L|| in XPT, as predicted by models, was not observed in TCV [34]. SOLPS-ITER simulations for the SN and XD in DIII-D suggest that the XD achieves an order of magnitude higher carbon emissivity than the SN due to stronger non-coronal effects at smaller field angles [50]. These non-coronal effects are even higher at higher input power leading to lower detachment thresholds in XD, which has been also experimentally observed on DIII-D [41]. Detachment in ELMy and ELM-free H-mode in ADCs were also studied in TCV [51]. A ∼3–4 times reduction in peak electron temperature and a ∼2 times reduction in the total power load to the outer divertor between ELMs was observed with seeding, whereas the density profile remained broadly unaltered. The impurity emission front comparisons did not reveal any clear increase in divertor cooling in the XD. The back-transition of H-mode to L mode and a shorter H-mode phase caused by strong fueling and seeding were ascribed as the main obstacles in achieving higher divertor heat and particle flux mitigation in H-mode. The recent plasma exhaust (PEX) upgrades at TCV included new in-vessel divertor baffles [38], further diagnostic coverage and increased neutral beam heating capacity [52], improving the access to carry out proof-of-principle experiments of ADCs in H-mode. Models and experimental data from DIII-D indicate that increasing fx and flaring should work in tandem with divertor closure to achieve a lower detachment threshold [41]. Experiments with baffles in TCV have shown easier access to detachment in L-mode [38] as well as improved core performance at high divertor neutral pressures in H-mode [53]. The exploration and assessment of the combined effect of baffling and ADCs in stable detached ELMy H-mode plasmas is the next logical step in developing advanced exhaust solutions in TCV and is the focus of this paper. Such studies can provide information on configuration(s) with the most promising core-divertor integration for further testing in the divertor tokamak test facility (DTT), which is currently being designed to investigate alternative power exhaust solutions in DEMO-like conditions [54].
In this paper, we present results from N2 seeded detachment experiments achieved in long-legged ADCs, namely the XD and the XPT, and compare them with the SN in stationary ELMy H-mode plasmas with and without divertor baffles for different NBI power levels (PNBI). Here, the term ADCs will refer to both the XD and XPT. In particular, a ∼two-fold improvement in the inter-ELM heat and particle flux mitigation at the outer divertor with the same amount of seeding in the ADCs in comparison to the SN was achieved, while simultaneously maintaining high core confinement.
The rest of this paper is structured as follows: in section 2 an overview of the experiments and key diagnostics important for this study are described. In section 3, detachment with high core confinement in the baffled ADCs and SN is demonstrated. In section 4, the effect of geometry on target ion flux profiles and integral values in attached and detached phases are presented. In section 5, the effect of geometry on target heat flux profiles is discussed and compared with the effect of baffles. In section 6, the effect of geometry and baffles on the radiated power distribution is presented. In addition, the power balance in the ADCs and the SN is compared with the goal of explaining the physics behind the observed improvement in the exhaust performance of the ADCs. Finally, in section 7, the key results from these experiments are summarised and motivation for future experiments is discussed.
2. Experiment overview
These experiments are carried out at the TCV tokamak, which is a carbon walled, medium-sized tokamak (major radius, R0 = 0.88 m, minor radius, a = 0.25 m) with unique flexibility to vary the plasma shape, using 16 independently controlled poloidal field coils [46, 52, 55]. Figures 1(a)–(c), shows the poloidal magnetic geometry of the SN (in red), the XD (in blue), and the XPT (in green) along with radial profiles of their fx and L|| in (d) and (e) respectively. In this paper, the term SP2-XPT and SP4-XPT will be used to denote the OSP on the high field side and low field side of the XPT geometry respectively, as marked in figure 1(c). In the XPT, the distance between the two X-points mapped upstream (drX2) is less than 2 mm, i.e., much smaller than the heat flux decay length, λq (∼5 mm).
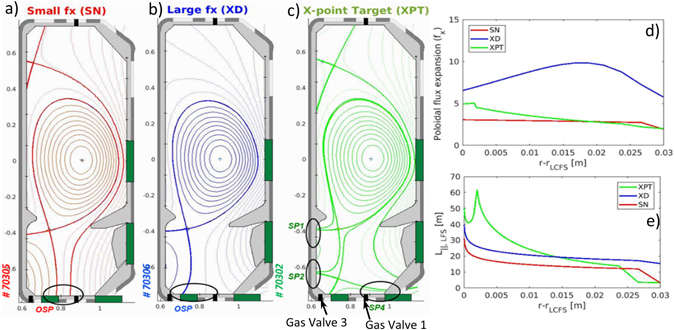
Figure 1. Plot showing poloidal magnetic geometry of (a) the SN (red), (b) the XD (blue), and (c) the XPT (green) and their radial profile of (d) fx and (e) L|| are plotted on the right top and bottom respectively.
Download figure:
Standard image High-resolution imageWe start from ELMy (type I) H-mode plasmas similar to those presented in [53] with a plasma current ( , toroidal magnetic field (
 , neutral beam heating power (PNBI) of 0.75 MW or 1.3 MW, q95 ∼ 5 and a Greenwald density fraction, fG ∼ 0.55. Plasmas in both ADCs and the SN were repeated with and without the polycrystalline graphite baffles recently installed in TCV. More specifically, the baffled discharges studied in this paper used short inner and long outer baffles [55]. The B0 direction is such that the ion grad B-drift is directed downwards, favorable for H-mode access. Ip is in the same direction. These are deuterium discharges, fuelled from gas valve 1 present at the bottom of the TCV vessel (see figure 1). Detachment is achieved by injecting a prescribed nitrogen gas (N2) pulse from gas valve 3, also situated at the bottom but at the high field side (figure 1c). These are piezo-electric gas valves with an integrated pressure sensor that provides calibrated flow rates into TCV [34]. Density (ne) and temperature (Te) profiles are obtained from Thomson scattering (TS) [56] viewing the plasma core and pedestal. The plasma parameters at the divertor targets are measured using an extensive array of wall-embedded Langmuir probes (LPs) [57, 58]. They are operated with a triangular voltage sweep, ranging from −120 V to +80 V, at a frequency of 990 Hz. Details on the LP analysis can be found in reference [57]. The newly installed RADCAM system with five camera modules containing gold foil bolometers with 120 line of sights have been used to estimate the radiated power and its spatial distribution [59]. MANTIS (Multispectral Advanced Narrowband Tokamak Imaging System) [60] captures images from the divertor region that are inverted using the CalCam package [61] to obtain 2D poloidal maps of the emissivity of the selected radiation lines. In this paper, we will focus on CIII (465.8 nm) line emissivity profiles. A 'CIII-front' can be defined as the position where the emissivity along the outer divertor leg decreases by 50% [34, 51].
3. Divertor detachment in high core confinement, baffled ADCs
Detached ELMy H-mode with high core confinement is achieved with N2 seeding in ADCs and SN geometries with and without baffles in TCV for a range of input powers. The H98 scaling factor is used to assess core performance [62]. It is defined as the ratio of the experimental confinement time (τE) and the ITER-98P(y, 2) confinement time scaling law ( ), given as

where I(MA) is the plasma current, B(T) is the toroidal magnetic field, n (1019 m−3) is the line averaged density, P(MW) the input power, R(m) the major radius, κ the plasma elongation, ɛ is the inverse aspect ratio, and M
 is the hydrogen isotope mass ratio. τE is calculated as
  , where Pin is the input power to the plasma and WMHD the stored plasma thermal energy. WMHD is calculated using electron and ion density and temperature profiles from Thomson spectroscopy and CXRS, respectively. The WMHD thus calculated has also been verified with WMHD obtained from a diamagnetic loop.
Figure 2 shows some major plasma parameters of high power (PNBI = 1.3 MW) baffled shots in ADC and SN geometry with high core confinement (H98 ⩾ 1) and stable detached divertor conditions that last for at least 0.4 s following the N2 injection. NBI starts at 0.8 s, pushing the plasma into H-mode and each geometry stays in a stable ELMy H-mode until the end of the NBI pulse at 1.8 s. A constant N2 seeding pulse is applied from 1.25 s until the end of discharge. Similar core (line-average) density is maintained in each geometry (figure 2(b)) with similar fueling conditions. Before seeding, high core confinement with H98 = 1–1.2 is obtained in each geometry, that decreases slightly following the N2 injection. H98 remains ≳1 till the end of the detached H-mode phase, indicating sustained high core confinement (figure 2(d)). Similar H98 factors and WMHD during attached and detached H-mode (figures 2(c) and (d)) in both the ADCs and the SN suggests a weak influence of geometry on core confinement. The inter-ELM peak ion flux at the OSP  obtained using LPs (figure 2(f)) sharply decreases after N2 injection in each geometry, indicating divertor detachment. Both ADCs exhibit 50%–70% lower
  in the attached, as well as detached phase, compared to the SN geometry, while, as noted already, maintaining similar core confinement. During the attached phase,
  in the XD and both active OSPs of the XPT (SP2-XPT, SP4-XPT) appear quite similar. The effect of seeding on the peak flux at SP4-XPT is weaker as compared to SP2-XPT and the XD, that exhibit the lowest particle fluxes in the detached phase. However, despite weaker detachment at SP4-XPT, its
  at is half of that in the SN. Detailed discussion on the effect of geometry and baffles on particle and heat fluxes at the target will be presented in section 4.
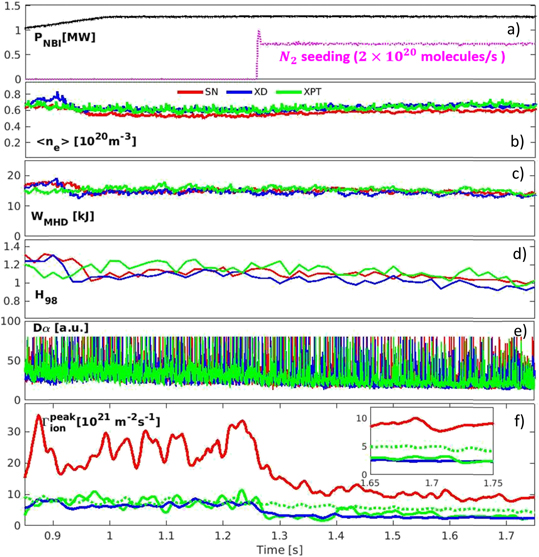
Figure 2. Plots showing time traces of (a) NBI power(black), N2 pulse (magenta), (b) line average density, (c) stored energy, (d) H98, (e) Dα line emission intensity and (f) peak parallel ion flux at OSP for SN (red), XD (blue) and XPT (green).
Download figure:
Standard image High-resolution image3.1. Effect of geometry on core/pedestal
The effect of divertor geometry on the pedestal profiles was probed by comparing the pedestal ne, Te and Pe profiles obtained from TS as presented in figures 3(a)–(c) in the attached and 3(d)–(f) in the detached phase. These profiles are obtained from the [0.3–0.9] fraction of the ELM cycle. Normalized poloidal flux, ρψ
=  , (where ψ is the poloidal flux and ψ0 and ψx1 its values at the magnetic axis and primary X-point, respectively) is used as the radial coordinate. Although the H98 factor and WMHD seem largely unaffected by the divertor geometry, the pedestal ne, Te and Pe profiles obtained during inter-ELM time windows show marginally higher
  and
and  in the ADCs, especially for the XPT compared to the SN in both the attached and detached phases.

Figure 3. Plots showing radial inter-ELM pedestal profiles of Te, ne and Pe in (a)–(c) attached and (d)–(f) detached phase, respectively.
Download figure:
Standard image High-resolution imageA minor degradation in the  is observed in the detached phase in all geometries, which is consistent with the H98 and WMHD trends discussed earlier. It is worth mentioning that although the H98 and WMHD slightly decrease following N2 seeding, the core density increases in all three geometries, as shown in figure 4(a).
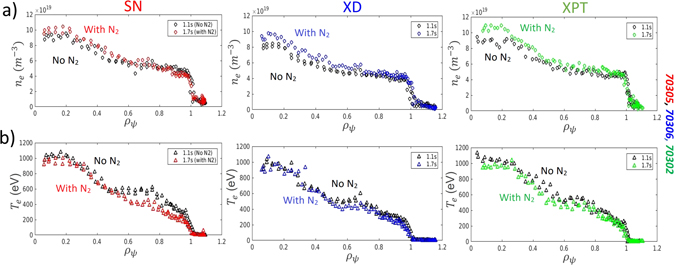
Figure 4. Plots showing radial profiles of (a) ne and (b) Te in SN, XD and XPT respectively. Black points show the attached, and coloured points show the detached phase. (Same shots as in figure 3).
Download figure:
Standard image High-resolution imageThe effect of geometry on core confinement and pedestal parameters in ADCs was further examined at lower power, PNBI = 0.75–1 MW, here again, with and without baffles, and showed similarly small dependencies. The ELM behaviour is another important aspect of H-mode plasmas, as it plays a significant role in the power balance. As we report upon the inter-ELM power and particle exhaust in the following sections, we shall also report on the ELM behaviour changes with the divertor geometry. Figure 5 shows the ELM frequency (fELM), energy lost per ELM ( and ELM power loss (PELM) for the 1.3 MW baffled shots presented in figures 1 and 2. dWELM is estimated as the difference in the stored energy, from a diamagnetic loop before and after an ELM following correction of any over-shoot in that measurement [51].

Figure 5. Plots showing the time evolution of the 20 points moving average of (a) fELM, (b) dWELM and (c) PELM in SN (red), XD (blue) and (c) XPT (green) in 1.3 MW plasmas with constant N2 seeding starting at 1.25 s, indicated by dotted black arrow.
Download figure:
Standard image High-resolution imagePELM is estimated as the product of the energy loss per ELM and the ELM frequency (PELM = fELM.dWELM). As indicated by figure 5, in the attached phase, fELM and PELM is not strongly affected by the divertor geometry, although fELM is somewhat lower and dWELM higher in the XPT. From the start of the seeding phase, fELM increases and dWELM decreases. By the end of the seeded phase, dWELM has decreased by 35%–40% in all geometries. Despite some variability in fELM and dWELM, PELM is similar in all the geometries, dropping by ∼30% due to seeding. Unlike AUG experiments [26], where an ELM-suppressed regime is observed at a certain height (∼10 cm) of the XPR above the X-point, discharges reported in this paper remain in an ELMy regime in all geometries. The decreasing dWELM and PELM and increasing ELM frequency indicate, however, a tendency towards a small ELM regime late in the detached H-mode phase.
3.2. Detachment in all geometries verified with MANTIS
Earlier detachment studies [15, 34, 51, 63] have shown that the CIII front is a good proxy for the position of the boundary of the cold radiative region along the divertor leg. The displacement of this CIII-front from the target to the X-point is indicative of divertor cooling, and, thereby, a marker for detachment. Figure 6(a) shows an inter-ELM MANTIS time frame captured during the attached phase in the SN geometry, where the CIII emission extends along the entire outer divertor leg in contrast to the detached phase, where the CIII front is very close to the X-point in between ELMs (see figure 6(b)). Figure 6(c) shows the temporal evolution of the inter-ELM poloidal distance of the CIII front to the primary X-point in 1.3 MW baffled ADCs and SN. A 25 ms median filter was used to obtain the inter-ELM CIII front of each geometry. During the attached phase, the CIII front sits closer to the primary X-point in the ADCs, compared to the SN, indicating colder divertor conditions in the ADCs. As the N2 seeding starts, the CIII front migrates further towards the X-point in each geometry. These results from MANTIS confirm detachment is obtained for the ADCs and the SN. An advantage of ADCs in terms of divertor cooling is also apparent in a facilitated detachment onset. It should be noted that the poloidal leg length of the outer divertor is different in each geometry. Therefore, the CIII front poloidal distance normalized w.r.t the total poloidal leg length (CIII frontNM) may be a more adequate parameter to compare. This is plotted in figure 6(d) for the ADCs and the SN in 1.3 MW baffled scenarios with a N2 seeding ramp. In the attached phase, CIII frontNM is closest to the X-point in the XD, followed by the XPT. In the SN discharge, the CIII frontNM is closer to the target. This indicates that between the two ADCs, the XD has a colder divertor in the attached phase.

Figure 6. Inter-ELM MANTIS time frame from the SN captured during (a) the attached phase and (b) detached phase. Plot showing temporal evolution of the inter-ELM (c) poloidal distance of CIII front to the primary X-point and (d) CIII front poloidal distance normalized w.r.t the total poloidal leg length in 1.3 MW baffled ADCs and SN.
Download figure:
Standard image High-resolution imageThe reduction in peak target ion flux with seeding (figure 2(f)) and the CIII front movement (figure 6) provide evidence of the achievement of a stable N2 seeded detached H-mode with high core confinement in the ADCs and the SN. Based on the inter-ELM peak electron temperatures from LPs at the outer target in the seeded phase (between 7–10 eV, not shown) and the heat flux reductions achieved with seeding as shown in section 5.2, according to [19], we classify the regime as partially detached. We also presented indications of colder divertor conditions (from CIII front measurements) and lower target peak ion fluxes (figure 2(f)) in the ADCs as compared to the SN. In the following sections, we further examine the LP data, quantifying the advantages of the ADCs over the SN in terms of the particle and heat fluxes on the divertor target.
4. Effect of geometry on target ion flux profiles
For a reliable interpretation of LP data, the inter-ELM data in swept mode is carefully extracted for each discharge, and then analysed to obtain target plasma parameters. The details on LPs in TCV and its data analysis are discussed in reference [57]. Figure 7 shows the radial profiles of the inter-ELM ion flux parallel to the magnetic field (Jsat) measured at the OSP as a function of ρψ
for the SN (figure 7(a)) and the ADCs (figures 7(b)–(d)) during the attached (black) and the detached phases (colored). In the attached H-mode phase, the XD, SP2-XPT and SP4-XPT exhibit substantially (<50%) lower  at the OSP in comparison with the SN. The
  in the XD and SP2-XPT are similar in magnitude, whereas the
  at the SP4-XPT is substantially lower. This advantage of ADC over the SN in terms of lower peak ion fluxes also persists into the detached phase. The effect of seeding at SP4-XPT appears weaker than for the SP2-XPT. This could be due to the proximity of SP2-XPT to the N2 seeding gas valve (valve3) that is poloidally farther for SP4-XPT. To elucidate any issue of poloidal asymmetry in detachment in the XPT, N2 seeding experiments with multiple poloidal gas valves are planned for future TCV experiments. They are expected to add further important details to the results presented here. Figure 8 show the integrated ion flux (Γion) at the OSP in the SN and the ADCs. The total Γion in the ADCs is lower than for the SN in both attached and detached phases. In all geometries, Γion gradually decreases with N2 seeding in the detached phase. It is worth noting that although Γion at SP2-XPT is much lower than SP4-XPT, the
  SP2-XPT is similar due to the more peaked profile. We have shown that both ADCs demonstrate a clear advantage over the SN with lower
  (figures 2(f) and 7) as well as lower Γion (figure 8) at the OSP in H-mode. However, for attached XPT plasmas, these desirably low
  at both SP2 and SP4 are limited to scenarios with extremely small distance between the two X-points mapped upstream, drX2 ∼ 1 mm, i.e. ∼20% of the (upstream) heat flux decay length λq
(∼5 mm), measured using IR in similar SN geometry. The drX2 is calculated with the help of the equilibrium reconstruction tool (LIUQE), as the radial distance (dr) between ρψ
of the second X-point and ρψ
of primary X-point at the outboard mid-plane. Figure 9(a) shows the time evolution of drX2 for two XPT discharges with different drX2 but similar core plasma parameters. Figures 9(b) and (c) show their corresponding geometries. In figures 9(d) and (e) we show the radial Jsat profile for SP2-XPT (magenta), SP4-XPT (blue) and compare them to the Jsat in the SN (grey) of the XPT discharges. As one might expect, the ratio of
at both SP2 and SP4 are limited to scenarios with extremely small distance between the two X-points mapped upstream, drX2 ∼ 1 mm, i.e. ∼20% of the (upstream) heat flux decay length λq
(∼5 mm), measured using IR in similar SN geometry. The drX2 is calculated with the help of the equilibrium reconstruction tool (LIUQE), as the radial distance (dr) between ρψ
of the second X-point and ρψ
of primary X-point at the outboard mid-plane. Figure 9(a) shows the time evolution of drX2 for two XPT discharges with different drX2 but similar core plasma parameters. Figures 9(b) and (c) show their corresponding geometries. In figures 9(d) and (e) we show the radial Jsat profile for SP2-XPT (magenta), SP4-XPT (blue) and compare them to the Jsat in the SN (grey) of the XPT discharges. As one might expect, the ratio of  at SP2 and SP4 in the XPT geometry strongly depends on the distance between the X-points. With high drX2 (5–7 mm),
  at SP2 is as high as in the SN and
  at SP4 is much lower (figure 9(d)). By carefully optimizing the drX2 (1–2 mm) a similar
  at SP2 and SP4, considerably lower than in the SN, was obtained.
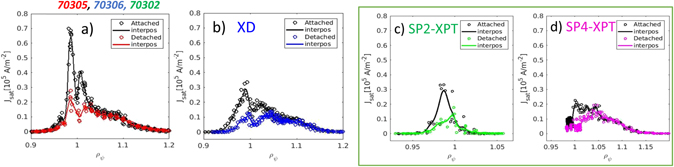
Figure 7. Plots showing the radial profiles of the inter-ELM ion current parallel to the magnetic field (Jsat) at the OSP vs ρψ for (a) SN, (b) XD, (c) SP2-XPT and, (d) SP4-XPT during the attached (black) and the detached phase (colored).
Download figure:
Standard image High-resolution image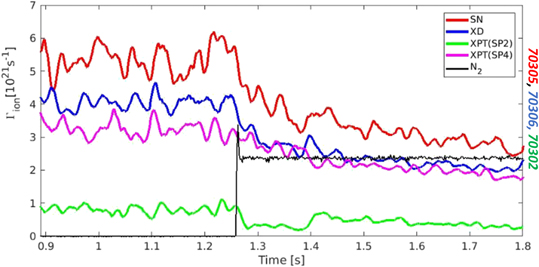
Figure 8. Plot showing time evolution of the integrated ion flux to the OSP in the SN (red), XD (Blue), SP2-XPT (green) and SP4-XPT (magenta).
Download figure:
Standard image High-resolution image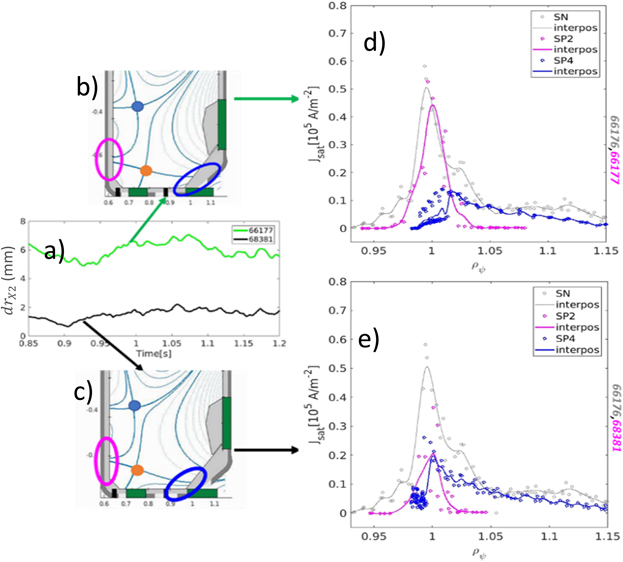
Figure 9. (a) Time evolution of drX2 for two XPT discharges with similar plasma parameters with high drX2 (green) and low drX2 (black). 2D equilibrium showing both X-points for XPT with (b) high drX2 and (c) low drX2. Radial Jsat profile of SP2-XPT (magenta), and SP4-XPT (blue) in (d) high drX2 and (e) low drX2 case, in comparison to the Jsat profile in the SN (grey).
Download figure:
Standard image High-resolution imageFrom lower parallel particle fluxes in the ADCs reported here, we can also expect lower parallel heat fluxes, discussed in the next section.
5. Improved heat flux mitigation in baffled ADCs
5.1. Effect of ADCs & baffles on target heat flux in attached H-mode
In addition to the CIII front measurements indicating colder divertor conditions in the ADCs (section 3.2) and lower peak parallel ion fluxes (section 4), we present more detailed and qualitative evidence from the LPs showing improved heat flux mitigation in ADCs. The inter-ELM parallel heat fluxes at the OSP (q||,OSP) is evaluated as  , where Epot is the potential energy carried by the incident ions (Epot = 13.6 + 2.2 = 15.8 eV [57, 58]) and, γ is the sheath heat transmission coefficient, usually taken to be γ =5 on TCV [57, 64]. Experiments were performed to compare the impact of divertor geometry (XD and XPT) and baffles on peak heat flux mitigation. We will first discuss the impact of ADCs and baffles in the attached H-mode phase in low power (PNBI = 0.75 MW) plasmas. Figure 10 shows the radial profiles of q||,OSP for the ADCs and the SN without baffles (top row) and with baffles (bottom row). We note that here, q||,OSP is shown rather than the perpendicular heat flux to the wall, to avoid effects related to varying the magnetic field incidence angles at the target.

Figure 10. Plots showing radial profile of q||,OSP in (a) unbaffled XPT, (b) unbaffled SN, (c) unbaffled XD, (d) baffled SN and (e) baffled XD in PNBI = 0.75 MW shots.
Download figure:
Standard image High-resolution imageAs expected from the Jsat profiles, the peak q||,OSP ( ) is highest in the unbaffled SN with
  . When increasing fx
(in unbaffled XD),
. When increasing fx
(in unbaffled XD),  is reduced by
  60% reaching 1.6 MW m−2. Conversely, with baffles (in baffled SN) one obtains
  40% lower
  , 2.5 MW m−2. As a cumulative impact of baffled and increased fx
,
, 2.5 MW m−2. As a cumulative impact of baffled and increased fx
,  85%
85%  mitigation was achieved, with
  . By adding a secondary X-point (unbaffled XPT), we could obtain
  75% lower
  at both SP2 and SP4, provided that drX2 ⩽1 mm.
  at SP2-XPT with high drX2 (⩾2 mm) was found to be up to two times higher, but still lower than the SN despite similar Jsat (see figure 8). For this XPT scenario, a baffled case with closely matched drX2 and core density is not available.
These findings show a clear reduction in the heat fluxes at the OSP individually by the ADCs and the baffles compared to the unbaffled SN in the attached phase. They also indicate that the impact of ADCs is stronger here than baffling in terms of the target heat flux reduction. When these two means are combined in the baffled XD, it leads to remarkably low  .
.
In this low NBI power baffled scenario, it was difficult to assess the effect of geometry in the detached phase due to very low  in SN and ADCs, which limits LP data interpretation. To examine the effect of geometry with baffles in the detached regime, a higher NBI power scenario was developed. In the following section, we look at target heat fluxes in these high-power (PNBI = 1.3 MW) baffled discharges in both attached and detached ADCs.
5.2. Effect of ADCs in high power, baffled, attached and detached H-mode
 is, as expected, higher in the high-power baffled SN plasmas (∼5 MW m−2) than the lower power baffled SN (
 . This facilitates a reliable comparison of the detached phases. Figure 11 plots the radial profiles of q||,OSP for the SN and the ADCs with baffles in the attached (black) and detached (color) phases.
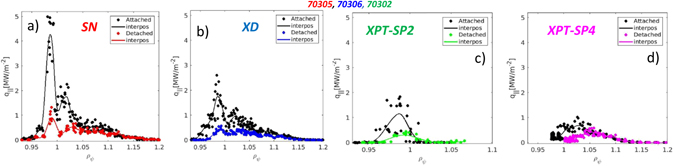
Figure 11. Plots showing radial profile of q||,OSP in baffled (a) SN, (b) XD (c) SP2-XPT and (d) SP4-XPT in PNBI = 1.3 MW shots.
Download figure:
Standard image High-resolution imageWhen attached, the  in the XD remains
  lower than in SN, whereas in the XPT,
  is
is  and
and  lower at the SP2 and SP4, respectively. This agrees with our findings at lower power. The difference in
  between SP2 and SP4 may be attributed to a slightly higher drX2 (2–3 mm) compared to drX2 (1–2 mm) in low-power XPT (figure 10(a)), where SP2 and SP4 show similar peak heat fluxes.
Next, we consider the heat flux mitigation with ADCs in the detached phase. Coloured profiles in figure 11 are taken from a stable detached time window (∼1.6 s) when the Jsat is at its minimum, the CIII front is at the X-point, and H98 ∼ 1. An almost 80% reduction in  is seen with detachment in the SN and the XD. Maximum reduction in the q||,OSP occurs close to the strike point for 0.95 < ρψ
< 1.05. The resulting
is seen with detachment in the SN and the XD. Maximum reduction in the q||,OSP occurs close to the strike point for 0.95 < ρψ
< 1.05. The resulting  in the XD is
  lower than in the SN in the detached phase. In the XPT,
  is reduced by ∼70% at SP2, but only by ∼40% at SP4. Nevertheless,
  at both SP2 and SP4 remains considerably lower (∼50%) than for the detached SN. Also, despite higher drXpt (∼3 mm) in detached phase,
  at SP2 and SP4 are similar. This may indicate that exhaust performance of detached XPT has weaker dependence on drXpt, unlike attached XPT (figure 9), but further experiments are needed to confirm this.
Overall, we find that the improved heat flux mitigation capabilities of ADCs persist in the detached ELMy H-mode regime. Remarkably lower  in detached H-mode ADCs, in addition to lower
  and Γion, while maintaining high core confinement (as discussed earlier), make both ADCs desirable candidates for detached H-mode operation in future tokamaks. While we see the improved heat flux mitigation at the OSP/OSPs in ADCs, it is also important to investigate the effect of ADCs at the inner strike-point (ISP), in case the missing heat-flux is not simply diverted to the ISP. This is addressed in the following section.
5.3. Heat fluxes at the ISP
Figure 12 shows the radial profiles of the inter-ELM parallel heat fluxes at the ISP ( for the SN and the ADCs with baffles in the attached (black) and detached (color) phase. These profiles are taken from the same shots and time windows as in figure 11. In the attached phase, the peak q||,ISP (
 is found to be over 2 times higher than at the OSP in the SN as well as the ADCs.
  in the ADCs remains lower than in the SN. The XPT exhibits the lowest
  , i.e., ∼50% lower than in the SN's attached phase. Earlier detachment experiments in L-mode indicated that the ISP is harder to detach in TCV [15], which is also the case here. With N2 seeding, the XD shows the highest (∼80%) reduction in
  , followed by the SN (∼65%). The weakest effect of N2 seeding is observed in the XPT with only a ∼50% reduction in the
  . Nonetheless, the
  in both ADCs remains lower than the SN, particularly in the XD. This evidence, again, reinforces the benefits of ADCs over SN.
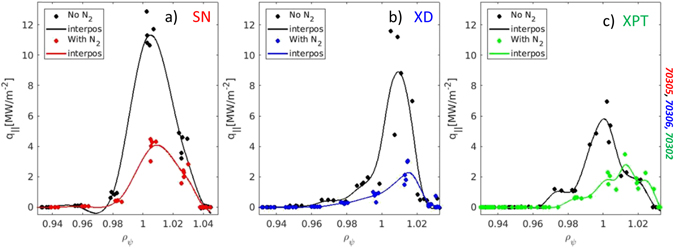
Figure 12. Plots showing radial profile of q||,ISP in baffled (a) SN, (b) XD, and (c) XPT before (black) and after N2 seeding (coloured) in PNBI = 1.3 MW shots.
Download figure:
Standard image High-resolution imageIt can be concluded from these results that the decrease in q||,OSP for ADCs is not related to a redirection of power to the ISP. The effect of ADCs on different power loss channels in attached and detached H-mode will be discussed in the following section.
6. Effect of geometry on power distribution
The main power loss channels in these H-mode plasmas, apart from the previously discussed inter-ELM target heat fluxes, are impurity and hydrogenic radiation and heat pulses from ELMs. To understand the underlying mechanism leading to improved target inter-ELM heat flux mitigation in the ADCs, power loss through different channels is studied and discussed in this section.
6.1. Radiated power distribution in different geometries
Radiation emission profiles are studied using the newly upgraded RADCAM system in TCV [59]. Figure 13 plots the 2D emissivity profiles (filtered to remove ELM times) for detached H-mode for the SN and the ADCs with high power (1.3 MW).

Figure 13. Plot showing 2D emissivity profiles from bolometry in baffled (a) SN, (b) XD, and (c) XPT in PNBI = 1.3 MW shots during the detached phase.
Download figure:
Standard image High-resolution imageA strong radiation region localized near the X-point in all the geometries suggests we are in, or close to, X-point radiator regimes, like those observed in impurity seeding experiments in AUG [26]. Throughout, radiation is peaked around the X-point during the H-mode. However, unlike the extreme X-point radiator regimes in AUG, ELMs are active in these discharges as noted earlier. These 2D profiles do not indicate any remarkable influence of the geometry on radiation. For a better comparison, the radiation from different regions in the vessel volume, namely core, divertor, and X-point (marked in figure 13(a)) were calculated by integrating their emissivity. Figure 14 shows the radiated power from these regions and the total radiation from the vessel volume. The total radiated power in the ADCs and the SN are quite similar in both the attached and detached H-mode phases. In the attached phase, the total radiated power (Prad) is ∼0.6 MW in all geometries. After the N2 seeding, Prad increases to ∼0.75–0.8 MW i.e. ∼77%–85% of the total power coupled to the plasma in these geometries. The radiated power in the core and the X-point region follow a similar trend. Before the N2 seeding, the radiated power from the X-point and the divertor regions are similar, ∼0.15 MW in ADCs and the SN. With N2 seeding, radiation from the divertor starts to decrease marginally whereas radiation from the X-point increases in all geometries. In the detached phase, the radiated power from the X-point is 40% higher than in the divertor region. However, no strong difference in radiated power nor its distribution is observed between the ADCs and the SN that could immediately explain the improved target heat flux mitigation in the ADCs. Similar results were also observed in the low power ADCs and SN. The effect of baffles on radiation in these discharges is similar to that reported in reference [38]. The baffled plasmas for all geometries exhibit higher radiated power as compared to the unbaffled plasma. Figure 15 shows the radiated power from the different regions of a baffled and an unbaffled XD plasma (0.75 MW). Increase in radiated power with baffles was observed in both ADCs and the SN. This is qualitatively consistent with the observed lower heat fluxes in the baffled scenarios.

Figure 14. Plots showing the time evolution of radiated power from (a) divertor, (b) X-point, (c) core, and (d) total vessel volume in SN (red), XD (blue) and XPT (green) in PNBI = 1.3 MW shots.
Download figure:
Standard image High-resolution image
Figure 15. Plots showing the time evolution of radiated power from (a) core, (b) X-point, (c) divertor, and (d) total vessel volume in unbaffled (blue) and baffled (orange) XD in PNBI = 0.75 MW shots.
Download figure:
Standard image High-resolution imageThe reason behind a reduced target heat flux in the ADCs compared to the SN could not be deduced from the radiated power analysis. An attempt to understand the power balance in the ADCs and the SN is made in the following section.
6.2. Power balance in SN and ADCs
The power balance in these H-mode plasmas can be written as: Pin ∼ Prad + Ptarget + PELM where Pin is the sum of ohmic and NBI power coupled to the plasma after accounting for beam duct and orbit losses, calculated using the ASTRA code [65]. Ptarget is the total inter-ELM power deposited on the divertor target and is calculated by integrating the inter-ELM heat flux across all the strike points, assuming toroidal symmetry [51]. Prad is the total radiated power and PELM is the power loss by the ELMs. Figure 16 shows the time evolution of Pin, Prad, Ptarget and PELM for the ADCs and the SN for the 1.3 MW baffled scenarios from figure 2. Both the ADCs and the SN have similar power distributions in terms of Pin, Prad and PELM in the attached and detached H-mode. We find PELM comparable to Ptarget for all geometries. The effect of divertor geometry is evident only in Ptarget. In the attached phase, Ptarget in the SN is ∼100 kW and ∼55 kW in the ADCs. With seeding, Ptarget in the SN decreases up to ∼45 kW and up to ∼25 kW in the ADCs. This highlights also that the effect of divertor geometry on the peak inter-ELM heat fluxes at the SPs is more pronounced (as discussed in section 5) than on the total power deposited at the SPs, particularly in the detached phase.
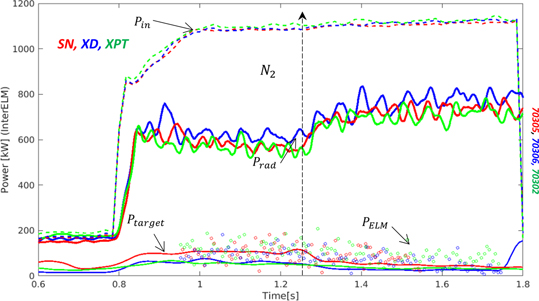
Figure 16. Plot showing power distribution in baffled SN (red), XD (blue) and XPT (green) in PNBI = 1.3 MW shots. The dashed arrow marks the start of seeded phase.
Download figure:
Standard image High-resolution imageThe radiated power fraction, ( in the detached phases in the ADCs and the SN is ∼65%–75%. The frad in these high confinement, partially detached, H-mode plasmas is lower compared to the frad ∼ 95% obtained in the ELM suppressed, fully detached, X-point radiator regime AUG [26] and in high confinement N2 seeded H-mode in Alcator C-mod [66]. The
  is ≲6% in the SN and ≲3% in the ADCs, which is comparable to the Ptarget/Pin ∼ 5% reported from Alcator C-mod [66]. The power deposited at the divertor target is, clearly, only a small fraction i.e., <10% of the total Prad and the absolute difference in Ptarget between geometries is relatively smaller, within the level of fluctuation, of the total Prad data. Nevertheless, the XD geometry exhibits slightly higher radiated power throughout the attached and the detached phases. Similar trends were also observed in lower power plasmas. This small but consistent difference in radiated power could explain, at least in part, the reduced target heat flux in the XD plasmas.
These results suggest that even in discharges with high radiated power fractions and radiation localised around the X-point, the divertor leg geometry still influences the target heat fluxes. The physics behind this heat flux reduction remains unclear. It might be due to the differences in radial transport in ADCs leading to the reduction in the peak heat fluxes. Power loss due to non-coronal processes, which are predicted to be enhanced in baffled XD, might also be responsible for this reduction [51]. Another possibility can be the difference in neutral losses, which can be enhanced in the XD [47].
7. Conclusions
High confinement, partially detached H-mode ADCs, namely X-divertor (XD) and XPT, with improved inter-ELM heat and particle flux mitigation at the outer target, have been achieved with N2 seeding at TCV. A detailed comparative study of many core and target parameters between the ADCs (XD and XPT) and the single-null (SN) has been presented in this paper.
The benefits of baffles, as reported in earlier experiments [38], are reproduced in all geometries. Compared to the baffled SN, a remarkable decrease in inter-ELM  (>50%) and
  is achieved in ADCs for both attached and detached phases, whilst maintaining high core confinement H98 ⩾ 1. Figure 17(a) shows the effect of baffles on the
  in SN and figure 17(b) shows the effect of ADC and detachment in a baffled scenario.

Figure 17. Plots showing radial profile of inter-ELM q||,OSP in (a) attached unbaffled (grey) and baffled SN (red) with PNBI = 0.75 MW, and (b) radial profile of q||,OSP in attached SN (red), attached (black) and detached (blue) XD with PNBI = 1.3 MW.
Download figure:
Standard image High-resolution imageCombining the results from these two experiments, we find that, compared to an unbaffled, attached SN, ∼95%–98% reduction in  is achieved as a synergistic effect of adding baffles, modifying the divertor geometry and impurity seeded detachment. We have obtained a distinctively low inter-ELM Ptarget/Pin ≲ 3% in these H-mode ADCs which is a desirable feature for future reactors. Figure 18 shows a simplified summary of the effect of adding baffles, modifying geometry and N2 seeded detachment, respectively. We have also shown that the reduction in
  is not a redistribution of q|| between outer and inner strike points in the ADCs, with the
  at the inner target also lower in the ADCs. The power distribution analysis indicates marginally higher radiated power in the XD, however, the physics behind the reduced particle/heat flux to the target in ADCs remains unclear. These results exhibit a promising potential of XD and XPT in future reactors motivating continued investigation of these geometries.

Figure18. Schematic summarising the effect of adding baffle, modifying divertor geometry and impurity seeded detachment on  .
.
Download figure:
Standard image High-resolution image
In future, we plan to expand the ADC experiments in TCV to higher power scenarios with combined NBI and ECRH heating. The advantages of ADCs will also be assessed in further operational regimes such as small ELM scenarios. Initial results from ADC experiments in such small-ELM regimes support the results in this paper. Experiments with increased poloidally and toroidally distributed impurity seeding uniformity (multiple gas injection points) in ADCs are also being developed, to seek optimisation of the impurity injection in TCV. With the help of these new gas injection points, we will also attempt to detach the inner strike point and study the effect of ADC on ISP detachment. Efforts are also continued to initiate numerical modelling of these ADCs in TCV, which is thought to be instrumental in understanding the underlying physics behind the improved exhaust performance of ADCs.
Acknowledgments
This work was supported in part by the Swiss National Science Foundation. This work has been carried out within the framework of the EUROfusion Consortium, funded by the European Union via the Euratom Research and Training Programme (Grant Agreement No. 101052200—EUROfusion). Views and opinions expressed are however those of the author(s) only and do not necessarily reflect those of the European Union or the European Commission. Neither the European Union nor the European Commission can be held responsible for them.