


Abstract
We have modelled self-consistently how to most efficiently fuel ITER hydrogen (H), helium (He) and deuterium–tritium (DT) plasmas with gas and/or pellets with the integrated core and 2D SOL/divertor suite of codes JINTRAC. This paper presents the first overview of full integrated simulations from core to divertor of ITER scenarios following their evolution from X-point formation, through L-mode, L–H transition, steady-state H-mode, H–L transition and current ramp-down. Our simulations respect all ITER operational limits, maintaining the target power loads below 10 MW m−2 by timely gas fuelling or Ne seeding. For the pre-fusion plasma operation (PFPO) phase our aim was to develop robust scenarios and our simulations show that commissioning and operation of the ITER neutral beam (NB) to full power should be possible in 15 MA/5.3 T L-mode H plasmas with pellet fuelling and 20 MW of ECRH. For He plasmas gas fuelling alone allows access to H-mode at 7.5 MA/2.65 T with 53–73 MW of additional heating, since after application of NB and during the L–H transition, the modelled density build-up quickly reduces the NB shine-through losses to acceptable levels. This should allow the characterisation of ITER H-mode plasmas and the demonstration of ELM control schemes in PFPO-2. In ITER DT plasmas we varied the fuelling and heating schemes to achieve a target fusion gain of Q = 10 and to exit the plasma from such conditions with acceptable divertor loads. The use of pellets in DT can provide a faster increase of the density in L-modes, but it is not essential for unrestricted NB operation due to the lower shine-through losses compared to H. During the H–L transition and current ramp-down, gas fuelling and Ne seeding are required to keep the divertor power loads under the engineering limits but accurate control over radiation is crucial to prevent the plasma becoming thermally unstable.
Export citation and abstract BibTeX RIS

Original content from this work may be used under the terms of the Creative Commons Attribution 4.0 licence. Any further distribution of this work must maintain attribution to the author(s) and the title of the work, journal citation and DOI.
1. Introduction
The ITER Research Plan [1] foresees a progression of plasma operational campaigns in hydrogen/helium, deuterium, and ultimately deuterium–tritium mixtures for the demonstration fusion power production. In the non-active operational phase (pre-fusion plasma operation) commissioning of the tokamak systems such as diagnostics, fuelling, heating and current drive systems, in vessel coils and plasma control systems will take place. Early operational experience and experimental results in hydrogen (H), helium (He), and then later in deuterium (D) will in addition give insights on approaches to optimise deuterium–tritium (DT) plasma scenarios. This is important to secure ITER's success in its primary objective of realising high fusion performance. The plasma density profile and its build-up are recognised to be very important in establishing the best route to achieve the target fusion gain, Q = 10, in ITER H-modes utilising the existing additional heating [1, 2].
In present tokamaks, gas puffing and recycling can effectively fuel the core plasma since neutral particles can pass through the relatively cool, sparse edge plasma. In contrast, the hotter and denser ITER edge plasma will be practically impenetrable to hydrogenic neutrals, which will not reach the separatrix the but will be ionised already in the far scrape-off-layer (SOL) [3–6]. Thus, pellet injection, although its deposition is rather peripheral in ITER, will be required to fuel the core plasma in ITER.
So far ITER integrated plasma simulation studies of fuelling and particle transport in ITER scenarios have been performed by introducing the sources from the scrape-off layer through boundary conditions/SOLPS parameterisations in core plasma modelling suites (e.g. [7–12]). Steady-state Q = 10 coupled core-edge transport calculations have also been carried out [13]. There has also been work focussed mainly on the magnetic evolution of the plasma where plasma transport was rudimentarily modelled without any coupling to the SOL/divertor plasma [14–16]. Here we here report for the first time on simulations including coupled core-edge transport calculations that follow the entire ITER plasma discharge evolution past the X-point formation for a wide range of ITER scenarios. This modelling approach allows us to study and optimize the fuelling of the plasma and to adjust the additional heating waveforms in H, He and DT plasmas to achieve the required stationary plasma conditions while avoiding operational limits, e.g. excessive neutral beam (NB) shine-through, excessive loads on the first wall panels and divertor power fluxes. In ITER the steady-state divertor power handing is limited to 10 MW m−2, although fast transients below 20 MW m−2 may be tolerated if their duration is short not to consume a sizeable lifetime of the ITER divertor due to recrystallisation causing mechanical fracture [17].
For non-active H and He plasmas we carried out L-mode simulations to identify robust scenarios for which the density is sufficiently high to commission and operate the NB at the highest beam voltages with acceptable first wall loads; namely a line-average density of 4.5 × 10¹⁹ m−3 in H and 3.0 × 10¹⁹ m−3 in He [18]. It is important to note that for fuelling of H plasmas both H gas fuelling and pellet fuelling are available. For He plasmas only gas fuelling can be used to fuel He; it is possible to inject H pellets, but this can lead to dilution and increase the density required to inject NB with acceptable shine-through loads on the first wall. In addition, the L–H power threshold also increases with the H dilution in He plasmas [19–22] and thus injecting H pellets into He plasmas can increase the required power to access H-mode beyond the capabilities in the initial phase of ITER operation, where H-mode plasmas are expected to be first explored.
In our simulations of 15 MA/5.3 T ITER baseline scenario plasmas with 50/50 DT composition, the main emphasis was the optimisation of the fuelling and impurity seeding to achieve high Q operational conditions with acceptable power loads to the first wall and divertor. This requires a sufficient density to inject the full power NB during the L-mode phase and an optimised fuelling scheme after the plasma enters the H-mode phase.
Previous studies have shown that an excessive density rise in the initial H-mode phase can decrease the core plasma temperature and prevent the fusion power build-up thus causing the return of the plasma to L-mode [23]. On the other hand, a too low plasma density in this phase can lead to the divertor power flux exceeding the design value of 10 MW m−2. Therefore our H-mode access simulations have optimised the fuelling rate and impurity seeding rates to reach a robust H-mode in the minimal amount of time with high fusion gain (Q ∼ 5) and this is then followed by a higher fuelling rate in which the plasma density increases to ∼85%–90% of the Greenwald limit at which Q = 10 is expected to be achieved in ITER. Extensive fuelling optimisation studies for the stationary phases of ITER DT H-modes over a range of plasma currents and toroidal fields are described in [24].
While the control of the density and divertor power fluxes through divertor radiation by impurity seeding in the access to high Q operation requires some optimisation, this is much more challenging for the exit phase of high Q operation. In this phase the plasma density decreases, which can lead to a significant increase of the divertor power fluxes with values in excess of 10 MW m−2. Thus, careful adjustment of both plasma fuelling (pellet and gas fuelling) and impurity (Ne) seeding is required in the exit phase to prevent excessive divertor power fluxes as well as the radiative collapse of the plasma solution due to uncurbed divertor radiation. This radiative collapse is reflected in our simulations by a numerical instability that corresponds to the experimental situation in which full plasma detachment takes place, possibly followed by a thermal instability such as a MARFE. Although in this paper we use the experimental terminology for this numerical instability, to speed up the simulations we have turned off part of the required physics (e.g. neutral–neutral collisions and some hydrogenic molecular processes) to model these physical phenomena in detail for ITER.
To model the above ITER plasma conditions and scenarios comprehensively and self-consistently, we have employed the integrated suite of core and SOL/divertor transport codes JINTRAC [25] developed at JET. This suite connects JETTO/SANCO [26, 27], a 1.5D core transport solver that includes impurities, with EDGE2D/EIRENE [28, 29], a 2D SOL/edge multi-fluid solver that comprises plasma interactions with the ITER Be wall and W divertor including atomic processes [30].
For simplicity, the only impurities that we have modelled are Be and Ne. At the time of writing, we are carrying out simulations including W, which will be presented in a future publication. We did not consider seeding N instead of Ne, even though the former seems to be a better divertor radiator in present experiments, since it can lead to tritiated ammonia formation, contributing to in-vessel tritium retention [31]. Indeed recent simulations show that N and Ne provide similar capabilities regarding divertor radiation in ITER due to the high plasma edge temperatures compared to present devices [32] and consequently Ne remains the preferred choice for ITER and in our simulations.
In the initial phase of our ITER JINTRAC simulation studies, we conducted a considerable benchmark between EDGE2D and SOLPS 4.3 [33], which showed that the SOL/divertor physics description was in agreement between the two codes [34] (see appendix
The outline of the paper is as follows: in section 2 we present the JINTRAC modelling suite and our modelling assumptions. Our ITER simulation results for the non-active phase are described in section 3 and the simulations of DT plasmas in section 4 with a summary and conclusions in section 5.
2. JINTRAC modelling assumptions
The simulations that we present here follow most of the time evolution of the ITER DT and He H-mode reference plasma scenarios from the initial L-mode at X-point formation at low current through the build-up to the stationary ELMy H-mode phase, including the L–H transition, the initial ELM-free H-mode and, finally, the stationary ELMy H-mode phase with controlled ELMs. For DT plasmas we have also studied the H–L transitions, with particular emphasis on keeping the divertor power load and divertor plasma temperature under control. Overall, the main emphasis of the simulations in He and DT has been on the fuelling requirements to achieve an appropriate plasma density and to control its evolution for: (1) the unrestricted use of the NB in L-mode plasmas to trigger the L–H transition; (2) reaching and sustaining ELMy H-mode conditions; and (3) for 15 MA DT plasmas, reaching a Greenwald density fraction of 85%, which is required to obtain Q = 10, the ultimate goal of ITER.
For H plasmas a set of dedicated studies was performed to evaluate the possibility of achieving the minimum density required for the unrestricted use of the ITER NB at highest injection energy (870 keV for H neutrals), in L-mode plasmas. This is important for the use of the NB system in the initial phases of ITER operation; the required density is 4.3 × 10¹⁹ m−3 for H plasmas, which is substantially larger than for DT (2.5 × 10¹⁹ m−3). Hence, these simulations have been carried out at constant values of field and current rather than for the whole plasma scenario as was done for the He and DT H-mode plasmas.
Contrary to existing tokamaks, the high recycling regime in ITER (i.e. a much larger divertor flux than the outflux from the core plasma) persists even at low separatrix densities and high divertor temperatures [35], due to the large divertor plasma dimensions which lead to a very efficient neutral ionisation. Hence, for most plasma conditions in ITER a clear majority of the recycled neutrals are ionised in the divertor plasma and, typically less than 1% of the total neutral recycling flux actually reaches, and is ionised in the core plasma [5]. This renders gas fuelling and the ensuing increased recycling very ineffective to fuel the core plasma and to increase the core plasma density. Indeed, core plasma fuelling is foreseen to be performed by the injection of pellets in ITER. This is modelled with the modules NGPS [36] in L-mode and HPI2 [37] in H-mode. Both models are integrated in JETTO and describe the ablation and deposition of the pellet mass. HPI2 also takes into account the post-ablation drift and the fast transport phenomena due to the ∇B drift of the ablation cloud. As shown in figure 1 the EDGE2D/EIRENE model includes a pump and stationary conditions are established when the pumped neutral flux is equal to the gas + pellet fuelling flux and NB particle source. The 2D grid used in EDGE2D was calculated by GRID2D using a ITER reference equilibrium [38] covering the whole plasma volume. This reference equilibrium was developed within an iterative approach of exchanging engineering and physics information obtained from the magnetic and kinetic plasma scenarios developed by using DINA [39] and CORSICA [40].

Figure 1. Poloidal magnetic flux (ψ) map of the MHD equilibrium for an ITER 15 MA/5.3 T plasma. Superimposed are the EDGE2D grid (blue), the ITER first wall (red) and the divertor target structure with dome, semi-transparent surfaces (blue) and pump (pink).
Download figure:
Standard image High-resolution imageIt should be noted that in the present work we have assumed that recycled neutrals can only cool the plasma and therefore do not contribute significantly to the recycling of energy in the SOL/divertor. This is a sound assumption for recycling on carbon or beryllium plasma facing materials, where fast reflections (from an ion returning as an atom) are less probable than thermal reflections (where the ion returns as part of a molecule). In addition, with a carbon wall the recycled power fluxes are also reduced by the formation of carbohydrate molecules and by the relatively high wall retention of hydrogenic species, which increases the power absorption of the wall. The lower retention in W walls and the small hydrogen to W mass ratio imply that fast reflections become more probable from a W wall, which increases the recycled energy flux. In appendix
In addition to the modelling of the fuelling of ITER plasmas and the control of the density evolution, our simulations have also addressed the control of divertor power loads. In ITER it is required to maintain the divertor peak power fluxes below their design limit of 10 MW m−2. For a range of plasma scenarios conditions (typically high power/high current plasmas) the achievement of this power flux level has necessitated the introduction of Ne into the plasma, which has been modelled by a gas puff in the outer divertor target region. The resulting Ne radiation in the SOL/divertor can be very effective in reducing the power flux at the target and decrease the divertor plasma temperature, which is important to limit W sputtering. The latter is not included in our simulations but an ion temperature of ∼5 eV at the location of maximum ion flux is taken as a proxy for significant W sputtering to take place.
For the lower power phases of the plasma scenarios (e.g. L-mode phases) we have frequently observed that injection of Ne was not required to achieve power fluxes under the ITER design limit; this could be achieved by increasing the edge plasma density by gas fuelling alone. On the other hand, in the phases where large SOL power fluxes occur together with a fast evolution of the edge plasma parameters (e.g. H-mode termination phases), it is extremely complex to adjust gas fuelling and Ne injection to maintain the divertor power flux under the design limit while avoiding a strong detachment of the divertor. This is due to the strong coupling between core and edge plasma (e.g. through the edge power flux that determines the level of confinement which, in turn, is affected by the increased core plasma radiation from the injected Ne). In this paper we present the first results of the control of the divertor power fluxes in such phases, which has been achieved by manually tuning the gas fuelling and Ne injection level by trial and error. A more systematic study of power flux control in H-mode termination phases in ITER scenarios requires appropriate feedback loops for gas puffing and Ne injection to be implemented in JINTRAC; this work is in progress and will be used for future ITER simulations.
The simulations presented here consider a single isotopic species in the SOL and divertor to represent D and T. At the separatrix the resulting ion density and neutral influx from EDGE2D is transferred to the core plasma model in JETTO as being composed of 50% D and 50% T. On the other hand, the total DT plasma particle outflux crossing the separatrix from JETTO is transformed into a single hydrogenic isotopic specie when transferred to EDGE2D. Successful core + SOL/divertor test simulations of JET DT plasmas have been carried out with a more recent version of EDGE2D, which can handle plasmas with two main hydrogenic species [42]. The results of this version will be benchmarked against JET hydrogen–deuterium experimental plasmas before it is used predictively for ITER.
For the simulations presented here we have developed a special version [5, 24] of the standard JETTO Bohm-gyro-Bohm transport model tuned to GLF23 [43], by including a collisionality dependent particle pinch, vpinch(ν*) = f(ν*) ⋅ 0.5Dr/a2, where D is the cross-field particle diffusivity, ν* is the normalized electron collisionality and  .The constant vth = 0.04 was obtained by matching GLF23 density predictions to BgB density predictions of ITER plasmas at different current and field. This pinch reproduces the density peaking observed in GLF23 associated with anomalous transport fluxes at low collisionalities. The transport of the impurities, Be sputtered from the main chamber wall and Ne from seeding to keep the divertor power fluxes acceptable are described by SANCO for the core plasma. JINTRAC assumes that the impurity transport can be described by the linear combination of neoclassical transport of the impurities plus anomalous transport which is assumed to be similar to that of the main ion species. We have used NCLASS [44] to calculate the neoclassical transport for all particle species (main ions and impurities).
As there is currently no simple model that accurately can describe the cross-field transport in the SOL, we have assumed in EDGE2D that the transport has a tanh decay from the separatrix values given by the core transport model assumptions, to the fixed values, D = 0.3 m2 s−1 and χe = χi = 1 m2 s−1 in the far SOL, frequently used in ITER SOL simulations. Additional effects from plasma drifts in the SOL/divertor have not been taking into account. If an edge transport barrier is present, the transport coefficients at the separatrix are extended 5 mm into the SOL. Moreover, simulations of JET L-mode plasmas in the high-recycling regime show that transport in this range, specifically flat profiles with χi,e = 0.5 m2 s−1, D⊥ = 0.15 m2 s−1, is needed in order to match the density and temperature at the outer midplane separatrix, and at the outer divertor target [45, 46]. The cross-field transport we have used is conservative with respect separatrix densities and onset of detachment, as simulations with lower transport, still within experimental observations in tokamaks, obtained higher core densities for the same gas rate and heating power, and were less prone to detachment [6].
Even if we have used ESCO, the internal fixed-boundary equilibrium solver in JETTO, to advance the core equilibrium in our modelling, we had to fix the poloidal shape of the EDGE2D grid for technical reasons. Consequently, in our current ramp-up and ramp-down simulations the plasma poloidal shape is assumed to remain unchanged and we have altered the pitch of the magnetic field in the SOL to reproduce the change in connection length associated with the changes to the poloidal field as the plasma current varies during these phases.
The auxiliary heating schemes in the ITER baseline are radio frequency (RF) heating by ECRH (electron cyclotron resonant heating) and ICRF (ion cyclotron radio frequency heating) and NB (neutral beam) injection, all of which are included in the modelling. We have applied PENCIL [47] to calculate the NB power deposition profiles in DT plasmas and ASCOT [48] for He plasmas to get accurate power deposition and beam shine-through.
ITER considers a range of ICRF heating schemes which range from He3 minority and second harmonic T at a toroidal field value of 5.3 T to H minority at 2.65 T for He plasmas. Although the module PION [49], included in JINTRAC, is, in principle, able to calculate the ICRF heating profiles, in the simulations presented here we have, for simplicity, adopted an ad-hoc Gaussian ICRF deposition profile centred on-axis with the power equally allocated to the ions and electrons; this is a good approximation for DT plasmas at 5.3 T while it overestimates slightly the core ion heating for H minority of He plasmas.
For ECRH heating we have also applied an ad-hoc Gaussian power deposition but this time centred at a normalised minor radius 0.2. The recent installation of GRAY [50] in JINTRAC will allow to calculate the ECRH heating and current drive self-consistently in future ITER studies. However, as the main aim of this study is to determine fuelling requirements for ITER scenarios and to investigate schemes for divertor power load control, the use of ad-hoc RF deposition profiles is an acceptable simplification.
In DT plasmas we took the α-particle heating into account by applying the Mako model [51, 52] since the additional heating it produces is essential for the 15 MA/5.3 T DT plasma to reach and sustain H-mode. Moreover, the He ash was modelled self-consistently in the core and SOL/divertor plasma and pumped out in the divertor.
Since at this time, no first-principle model exists that can correctly predict confinement transitions, we have relied on experimental observations and scaling laws to determine the power level at which the plasma accesses or exits the H-mode confinement regime in ITER scenarios. One such scaling law is the Martin L–H threshold scaling [53]

where PLH is the threshold power in MW, ne20 the line-average density in 1020 m−3, BT the magnetic field in T, and S the plasma surface area in m2. An L–H confinement transition is assumed to occur in our simulations when

where PLoss, the loss power crossing the separatrix is

and POHM is the ohmic power, Pabs is the absorbed power, W is the total plasma energy, Prad is the total radiated power and PFloss is the fast ion losses. Conversely an H–L transition occurs in the simulations when PLoss − PLH ⩽ 0.
The Martin scaling was derived for deuterium plasmas. Experimental observations in AUG, DIII-D, and JET [20–22] indicate that for He plasmas the L–H transition threshold is higher by a factor of 1.44 than in D plasmas, a factor which we have applied in our simulations of L–H transitions in He.
The edge transport barrier (ETB) width has been determined with the EPED1 model [54, 55] and we have assumed this value to remain fixed throughout the L–H and H–L transitions, i.e. whenever PLoss − PLH ⩾ 0. In addition, we allow the level of remaining anomalous transport within the ETB to depend on the surplus of heat flux through the separatrix, PLoss, compared to power threshold PLH so that when


where ΔLH defines the reduction of the anomalous transport with the edge power flow margin over the power threshold. To be consistent with JET experiments we have set ΔLH = 0.1 [56], which also allows for smoother transitions with less dithering between L- and H-mode.
Following the L–H transition the pressure in the ETB rises and the ballooning stability parameter  rises. When it gets to a specified value, αcrit, evaluated on the basis of edge ideal MHD stability with the codes MISHKA [57] and ELITE [58], we trigger the continuous ELM model [59]. This consists of an ad hoc elevation of transport in the ETB to maintain α = αcrit throughout the stationary phase of the ELMy H-mode. This is an approximation of the expected plasma behaviour of ITER ELMy H-modes where ELM energy losses need to be controlled to very small values through ELM suppression [60].
Lastly, we have applied the Kadomtsev model [61] to model the sawtooth reconnection. A sawtooth crash is prompted when the safety factor drops below unity at the magnetic axis. Although, a fixed minimum time (0.1 s) must have passed since the previous crash to avoid too frequent crashes destabilising the code. However, in most of our simulations sawtooth crashes normally occur much more infrequently than this.
3. JINTRAC simulations of the non-active phase of ITER operation (pre-fusion plasma operation)
We have concentrated our non-active fuelling modelling studies on the achievement of appropriate L-mode densities in H (4.3 × 10¹⁹ m−3) and He (2.7 × 10¹⁹ m−3) to permit unrestricted operation and commissioning of the NB over the whole range of injected hydrogen ion energy (500–870 keV) up to the highest values, and on the achievement of ELMy H-mode plasmas in He. Experimental evidence from several tokamaks for hydrogenic plasmas, such as JET [19], show that PLH ∝ 1/Aeff where Aeff is the effective atomic mass and, hence, the threshold power for hydrogen plasmas is expected to be significantly higher than for DT. For ITER this implies that H H-modes are improbable at heating powers below 100 MW at full current and field. Therefore, H-mode studies in the non-active phase are expected to take place at reduced currents and fields and most likely in He to take advantage of the reduced power threshold compared to H plasmas ( ). Predictions for 7.5 MA/2.65 T H-modes in ITER show that the ELMs could generate energy loads above the melting limits for the W divertor monoblock target and, hence, such plasmas provide highly relevant conditions for the understanding of H-mode plasma behaviour in ITER and for the commissioning and refinement of the ELM control system to demonstrate that ITER can achieve the required level of ELM control before the start of nuclear operations [1].
3.1. Hydrogen L-mode simulations of 15 MA/5.3 T plasmas
Our simulations of 10 MA and 15 MA hydrogen L-mode plasmas at 5.3 T foresee that fuelling with gas only will be insufficient to obtain the density of 4.3 × 10¹⁹ m−3 required for unrestricted NBI operation, even when the plasmas are heated with the maximum baseline level of 40 MW RF power. Indeed, for both currents we only reached line-average densities of up to ∼2.8–3.1 × 10¹⁹ m−3 for a gas rate between 2.5–3.0 × 10²² s−1 (figure 2). For higher gas fuelling rates the divertor strongly detaches, which could lead to the triggering of radiation instabilities such as a MARFE. Moreover, the separatrix density saturates and consequently the core density does not increase with gas fuelling beyond these rates.

Figure 2. Integrated modelling of an ITER 15 MA/5.3 T H L mode plasma with gas fuelling 3.0 × 10²² s−1 and 40 MW of ECRH (magenta); and pellet fuelling, 5.3 × 10²¹ particles/pellet at 3.3–4.0 Hz (corresponding to a fuelling rate of ∼1022 s−1), with gas fuelling 5.0 × 10²⁰ s−1 and 20 MW of ECRH (blue). Shown from top to bottom are line average density, on-axis ion temperature, outer target electron density, outer target electron temperature, max power flow to the outer target and the outer target ion temperature at the maximum ion flux. For the latter two signals data was only saved at the end of each simulation window, hence the discrete data points (apart from the last window of  in the pellet-fuelled simulation where we also got continuous data). Most of these discrete points do not capture the sawtooth crashes clearly visible in the on-axis ion temperature, except for the where there is a sharp increase in maximum heat load. It would be reasonable to assume that similar sharp spikes in the heat load to the targets exist for each sawtooth crash but are simply not captured. The pellet causes oscillations in the target temperatures rendering the outer target transiently detached (Te < 1 eV). The gaps in the time traces of
  and
and  were caused by memory restrictions in the simulations preventing all data from being saved.
Download figure:
Standard image High-resolution imageTo increase the density further, we have switched to dominant pellet fuelling by reducing the gas rate to a very low value of 5.0 × 10²⁰ s−1 and injecting pellets (90 mm3/5.3 × 1021 particles) into the plasma. By applying an initial pellet frequency of 3.3 Hz and then increase it to 4 Hz at 182.5 s, a 15 MA/5.3 T hydrogen L-mode plasma can reach a line-average density of ∼4.6 × 10¹⁹ m−3 even when it is heated by only 20 MW of ECRH (figure 2). To ensure that this plasma remains thermally stable the gas fuelling needs to be kept at very low values. As a rule of thumb, target temperatures less than 1 eV indicate a high level of detachment in our simulations and a likelihood of high recombination rates, the ionisation front creeping close to the x-point and thermal instability of the solution. For these pellet-fuelled hydrogen plasmas, the inner target temperature remains above 1 eV although the outer target temperature can momentarily decrease below this value due to the intermittent particle outflux from the plasma caused by the injected pellets. It is important to note that these simulations do not contain extrinsic impurities such as Ne seeding because the divertor power loads remained well under 10 MW m−2; the Be content was also very low in these simulations with Zeff ≈ 1 throughout the core and edge plasma.
3.2. Simulation of He H-mode scenarios at 7.5 MA/2.65 T
We have performed simulations of ITER helium H-mode plasma 7.5 MA/2.65 T scenarios including the plasma current ramp-up right after X-point formation and the access to stationary H-mode. The starting conditions correspond to a diverted He L-mode plasma at 3 MA/2.65 T with 20 MW ECRH heating and a volume-average electron density of 1.0 × 10¹⁹ m−3; the modelled ramp-rate is 200 kA s−1 leading to the 7.5 MA flat top current being reached 22.5 s after X-point formation. To model the current carrying equilibrium we rescaled the poloidal flux ψ with increasing current and adjusted correspondingly the edge field line pitch in the SOL while maintaining a constant plasma shape. The latter is also used as boundary condition for ESCO, which regularly updates the core equilibrium. We also considered different levels of gas puff to investigate the resulting increase in density. From the results of the simulations it is clear that the density ramp rate during the current ramp-up is exceptionally sensitive to the prescribed gas rate. If the rate is too high (>6 × 10²¹ s−1), it can cause early detachment of the divertor and thermal instability of the numerical solution, whereas if it is too low (<1 × 10²¹ 1 s−1), the density cannot be increased together with the plasma current as required for the later access to H-mode in this scenario. To ensure the achievement of the required density we have implemented a numerical feedback scheme in the JINTRAC suite to change the level gas puff to provide a density ramp at a given Greenwald fraction, which we have chosen to be ∼50%.
In the He current ramp-up simulation at about 236 s, the density has already almost risen to the target value that is modelled for steady-state L-mode plasmas at 7.5 MA/2.65 T (figure 3). Because the plasma current had gotten to no more than 5.5 MA, the simulation should be prolonged at a constant density with varying current to obtain the flat top plasma current value of 7.5 MA. However, at this core plasma density, current and ECRH power the inner divertor was nearly detached, so we could not increase the current and finish the simulation due to numerical instabilities. Future work will look at how to fine-tune the He fuelling rate to achieve a viable current ramp-up. Note that the steady-state He L-mode simulations at 7.5 MA/2.65 T with 20 MW of ECRH could only reach line-average densities of ∼2.1 × 10¹⁹ m−3 with a He gas fuelling rate of 7.0 × 10²¹ s−1 before the He radiation front in the divertor started to move to the X-point and render the divertor conditions unstable.
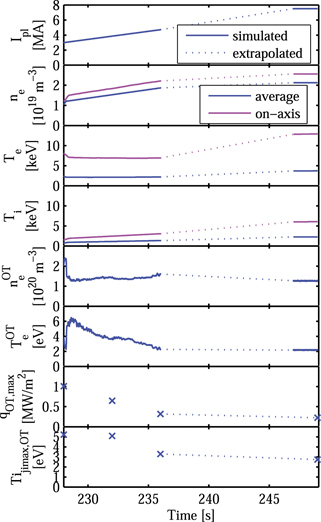
Figure 3. Simulation of a He plasma current ramp-up with 20 MW ECRH from X-point formation at 3 MA/2.65 T to flat-top current and field of 7.5 MA/2.65 T. Shown from top to bottom are plasma current, electron density, electron temperature, ion temperature, electron temperature and density at the outer target, maximum power flow to the outer target and the outer target ion temperature at the maximum ion flux. The first part of the solid (on-axis) and dashed (volume-average) lines shows the simulated ramp up to 5.5 MA, the second part shows the steady state target L-mode prior to NB injection at 7.5 MA. The dotted line shows the missing part of the simulation, which could not be completed as the inner divertor approached detachment.
Download figure:
Standard image High-resolution imageThis density is lower than the target feedback value for the current ramp at 7.5 MA; 50% of the Greenwald limit corresponds to ∼3.0 × 10¹⁹ m−3, which is similar to the required value for unrestricted NB operation (at full power of 33 MW) in He plasmas, which in turn is essential for H-mode access in these plasma conditions.
In order to determine if shine-through losses would be a problem in the H-mode access phase, we have modelled the L–H transition density rise after 33 MW NB power is injected in a 7.5 MA/2.65 T He plasma with 20 MW of ECRH heating and a line-average density of ∼2.1 × 10¹⁹ m−3. The NB deposition and shine-through losses ( ) have been evaluated with ASCOT and, as shown in figure 4, it is found that the plasma density increases rather quickly after the H-mode transition so that shine-through losses reduce from 20% to 3%–6% in about 5 s. We therefore expect that the resulting power fluxes on the first wall remain acceptable in this phase [18].
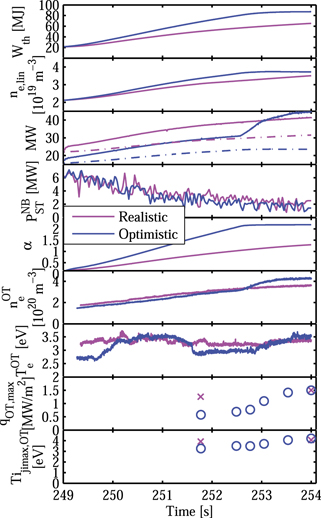
Figure 4. H-mode access for 7.5 MA/2.65 T He ITER plasma with 33 MW NB and 20 MW ECRH. Shown from top to bottom are core plasma energy, line average density, power crossing the separatrix (solid) vs L–H threshold power (dash-dot), neutral beam shine-through power, pedestal ballooning parameter α, outer target electron density and temperature, maximum power flow to the outer target and the outer target ion temperature at the maximum ion flux. With an optimistic assumption for the L–H power threshold (blue, assuming same threshold for D and He plasmas) the He plasma reaches the ELMy H-mode (ballooning parameter α = αcrit = 2.1) in ∼3.5 s after the NB has been turned on. As we have applied the continuous ELM model in JINTRAC, the pedestal pressure gets clamped at α = αcrit and the thermal energy content (Wth) and line-average density (nel) saturate. The case with a realistic L–H threshold (magenta, He H-mode threshold 1.4 times that of D plasmas) the plasma enters the H-mode but is still far from stationary ELMy H-mode conditions (α ≈ 1.4) at the end of the simulation time.
Download figure:
Standard image High-resolution imageTo test the sensitivity of H-mode access in He to threshold assumptions, we have performed simulations for two values of the L–H threshold in He; one optimistic assuming the same threshold for He and D plasmas as observed in ASDEX-Upgrade, and another more realistic, assuming that the He H-mode threshold is higher than that of D by a factor 1.4 as determined through experiments on JET, DIII-D, Alcator C-Mod, etc. As anticipated, the lesser L–H threshold in the optimistic case permits a swifter transition to ELMy H-mode (figure 4) with the edge stability ballooning parameter reaching α = αcrit = 2.1 in ∼3.5 s after switching on the NB. On the other hand, after 5 s the case with the a less optimistic threshold still remains in the ELM-free phase of the transition (α ≈ 1.4 < αcrit = 2.1) as the remnant anomalous transport remains too high to achieve significantly improved confinement. In this case a faster access to ELMy H-mode would require the use of the available 20 MW ICRH besides the 33 MW of NB and 20 MW of ECRH used in these simulations.
4. JINTRAC simulations of the ITER 15 MA/5.3 T Q = 10 baseline plasma scenario
The current ramp-up and ramp-down phases are important for the achievement of ITER fusion production goals. We have therefore performed full simulations of the Q = 10 baseline scenario from X-point formation in the current ramp-up to X-point to limiter transition in the current ramp-down. A full account of these simulations can be found in [62]. During the current ramp-up the plasma current is increased towards the target value for the high Q burning plasma phase. In the ramp-down phase the plasma must exit burning conditions and needs to be terminated in a controlled way while avoiding disruptions both when the termination can be performed over long timescales and when the timescales are shorter following, for instance, malfunctions of one or more ancillary systems (e.g. heating and current drive systems).
It has been observed that the SOL width varies strongly with plasma current in H-mode and likely in L-mode as well. In H-mode, our simulations capture this effect as the continuous ELM model determines the H-mode edge transport, which is tuned to stay at the MHD limit once the pressure (αcrit) is high enough. Therefore, the effective edge transport coefficients that extend 5 mm into the SOL in H-mode, scale inversely with Ip and thus so will the edge e-folding lengths [24]. These will be similarly affected in L-mode, as in this case the edge transport is dominated by the Bohm contribution, which is inversely proportional to the local magnetic field and thus also to the enclosed plasma current.
Our simulations of the baseline scenarios have been performed from early X-point formation at 3 MA/5.3 T at 10 s, which allows the application of auxiliary heating to lower the flux consumption in the ramp-up phase. The simulated current ramp-up rate of 200 kA s−1 leads to 15 MA being reached at 70 s (figure 5, left), which is well within the capabilities of the ITER poloidal field system. At this stage the additional heating is increased to trigger the H-mode transition which finally results in flat-top 15 MA/5.3 T ELMy H-mode plasma condition with a Greenwald density fraction of 85%, and a fusion gain of Q = 10. Our simulations have demonstrated that such a plasma scenario is indeed feasible within the physics basis and models included in the JINTRAC modelling suite (which has been compared to experiment) and without exceeding physics or design limits of the ITER components (e.g. divertor power fluxes). This has been demonstrated for both flat-top conditions corresponding to specific instants of the Q = 10 scenario as well as for the scenario as a whole, as illustrated in (figure 5).

Figure 5. JINTRAC modelling results of the current-ramp up and access to Q = 10 (left) for the DT ITER baseline scenario with L–H transition at 15 MA with 33 MW NB +20 MW ECRH. Slow (solid) and fast (dashed) density ramp after the transition show that a too fast density ramp-up prevents access to Q = 10 conditions. Current ramp-down and exit from Q =10 conditions (right) in the ITER DT baseline scenario with the H–L transition by switching of the additional heating at 15 MA (dashed) and at ∼10 MA (solid). Signals shown from top to bottom are plasma current, applied auxiliary power, Greenwald density fraction, ion temperature on-axis, fusion Q or power, maximum power flux to the outer target, total Ne concentration in the SOL and divertor, and the outer target ion temperature at the maximum ion flux.
Download figure:
Standard image High-resolution imageThe studies of the achievable density in ITER DT L-modes show that for a given input power, the core density builds up with the gas fuelling rate and then saturates [5, 6, 63], following the same qualitative trends as for H and He plasmas in section 3. If the gas rate is further increased, the divertor plasma enters a deeply detached state that leads to the thermal instability of the solution and the termination of the simulation. Our JINTRAC modelling suggests that in the current ramp-up of the Q = 10, a Greenwald density fraction of less than 35% can be anticipated with gas fuelling and merely 20 MW of RF heating [6, 63]. With more RF heating higher fractions can be achieved with gas fuelling only, especially at lower currents. Nevertheless, it is more effective to use pellet fuelling if higher densities are required during the ramp-up, in qualitative agreement with the H L-mode simulations in section 3. It is important to note, however, that during the DT phase the ITER NB will be operated in D at 1 MeV (for the full power of 33 MW) and that the density required for unrestricted NB operation in DT plasmas (∼2.2 × 10¹⁹ m−3) is much lower than for He and H so that at ∼35% of nGW, unrestricted NB operation is possible for currents above 8 MA. At present NB injection at such low levels of plasma currents is not considered in the Q = 10 scenario development. Still, if necessary, full NB power at lower currents would be feasible by dominant pellet fuelling as demonstrated in section 3.
Aligned with prior JINTRAC core-only predictions [23], our fully integrated core + SOL/divertor simulations indicate that the build-up of the fusion power, and corresponding α heating, is essential (on top of additional heating) to provide sufficient margin above the L–H threshold power in order to access quasi-stationary ELMy H-mode burning plasma conditions [63]. This requires a careful optimisation of the plasma fuelling in the H-mode access phase so that the core ion temperature can increase to values (>10 keV) at which DT fusion reaction rates are significant and can contribute to the total heating power. This leads to further improvement of the H-mode performance through the concomitant reduction of the transport in the ETB. This is illustrated in figure 5 (left) where two pellet fuelling rates are applied after the L–H transition in the ITER Q = 10 scenario. For the highest rate the plasma returns to L-mode after a brief, ELM-free phase following the H-mode transition because of the insufficient α heating and edge power flow.
In this Q = 10 scenario the divertor power loads remains under the 10 MW m−2 limit without utilising extrinsic impurity seeding (Ne) in the ELM-free phase up to Q ∼ 5. For higher Q phases and quasi-stationary conditions, Ne seeding is essential to maintain acceptable divertor power fluxes. Undeniably, the need to maintain sufficient divertor radiation to lower the divertor power flux to tolerable values introduces specific complications when considered together with core plasma fuelling with pellets and the associated particle flux transients.
It should be noted that even if we only show the total Ne concentration in the SOL and divertor in figure 5, the local Ne levels are determined by the SOL/divertor transport and, in general, increases towards the separatrix and higher densities is also seen at the inner divertor leg. In addition our simulations show that although Ne penetrates to the magnetic axis, the total core penetration of Ne remains low (<0.24%) in the current ramp-up simulations and therefore its associated radiation (<5 MW) does not adversely affect the quality of the H-mode or produced fusion power.
Our simulations of pellet fuelling of 15 MA/5.3 T ITER ELMy H-mode Q = 10 plasmas with acceptable divertor power fluxes, which requires a separatrix density ∼5.5 × 10¹⁹ m−3 and Ne seeding, show that the pellet size must be carefully optimised to achieve a fully integrated scenario (including fuelling, particle and power exhaust); pellets with a particle content larger than 5.5 × 10²¹ atoms lead to deep transient divertor detachment after pellet injection and the thermal collapse of the plasma solution [24, 63].
The current ramp-down is typically expected to be twice as long as the ramp-up phase. This is to allow for a slow exit from H-mode and ramp-down of the current, which ensures good vertical stability control (not included in simulations). At the beginning or during the current ramp-down phase the plasma exits the burning conditions. Throughout the ramp-down itself, the plasma current is reduced carefully to guarantee a controlled termination that avoids vertical stabilities and disruptions [64]. This is a complex phase as the control of vertical stability is linked to plasma shape and radial plasma position control. Consequently fast losses of plasma energy (such as during H–L transitions) that can trigger both large divertor power fluxes and radial inwards shifts of the plasma, might lead to the loss of vertical stability, if the limits of the vertical stabilisation systems in ITER are exceeded.
To study plasma behaviour in the ramp-down phase we have considered a current ramp-down evolution from 15 MA/5.3 T Q = 10 burning plasma to 3 MA/5.3 T in ∼90–120 s, depending on the plasma current at which the H–L transition takes place (figure 5, right). Our model of the ETB transport modification with a margin above the H-mode threshold (equation (5)) results in a period of ∼5 s in which the plasma energy decreases from H-mode values to L-mode values in the exit phase. This timescale agrees with present experiments [23, 65] and allows the sustainment of good radial position control in this phase.
On the other hand, power fluxes to the divertor can be very substantial in the initial phase of the H-mode termination. To avoid the divertor power fluxes to exceed the limit of 10 MW m−2 and W sputtering to significantly increase (W is not modelled in our simulations but an ion temperature of ∼5 eV at the location of maximum ion flux is taken as a proxy for significant W sputtering to take place), it is necessary to use Ne seeding.
In later, low power phases of the ramp down, where the edge power flow decreased, we had to carefully tune down or even turn off Ne seeding to ensure that the Ne level in the plasma is reduced by the pumping system sufficiently fast to avoid deep detachment of the divertor. In our modelling we did the tuning of plasma fuelling, Ne seeding, etc, by manual adjustment. Figure 5 (right) illustrates the results for two examples: a complete switch-off of the additional heating at the end of the 15 MA flat top; and for an H–L transition in the current ramp-down itself (at around 10 MA).
In conclusion, these simulations show that integrated scenarios for burn termination with stable plasma behaviour and acceptable divertor power fluxes can be obtained with the ITER heating & current drive and fuelling/impurity seeding systems. However, the ambition to progress further in the optimisation of this complex phase has prompted the development of more sophisticated divertor power load feedback control loops in the JINTRAC modelling suite. This will avoid the computationally intensive trial and error approach that we followed to achieve the results in figure 5.
5. Summary and conclusions
In this paper, we have presented integrated core-SOL/divertor transport modelling with JINTRAC of the non-active and nuclear phases of ITER plasma scenarios, as well as the first core-SOL/divertor simulations of He plasmas and of the full DT Q = 10 scenario including the current ramp-up/down diverted phases. In these studies of ITER plasmas, avoiding deep detachment was a primary consideration and indeed often the limiting factor in the our efforts to reach the desired densities.
We have demonstrated that pellet fuelling is the most efficient way to increase plasma density in L-mode plasmas and that it will be required to provide unrestricted NB operation in 15 MA/5.3 T hydrogen L-mode plasmas in order to avoid full divertor detachment. For He plasmas gas fuelling alone is sufficient to provide access to H-mode conditions at 7.5 MA/2.65 T by reducing the shine-through losses to operationally acceptable values through the associated density increase in the L–H transitions. Nevertheless, as the higher density also raises the L–H power threshold, reaching ELMy H-mode with only 33 MW NB and 20 MW ECRH is uncertain and will depend on the actual He L–H power threshold in ITER. For DT plasmas the use of pellet fuelling is less essential for unrestricted NB operation due to the lower NB shine-through losses in such conditions.
Only when using pellet fuelling, our results predict that, commissioning and operation of the ITER NB system to full power is possible in 15 MA/5.3 T L-mode hydrogen plasmas with 20 MW of ECRH. Similarly, He H-mode plasmas at 7.5 MA/2.65 T with an additional heating level of 53–73 MW can be achieved, which allows the characterisation of H-mode plasmas and the demonstration of ELM control schemes in the non-active phase before ITER DT operation.
Our integrated simulations demonstrate that access to high Q conditions in ITER DT plasmas requires an optimised build-up of the α heating after the L–H transition because the margin above the L–H threshold provided by the additional heating is moderate for high current 5.3 T DT plasmas in ITER. This optimised α heating build-up can be achieved by tuning the density rise through pellet fuelling with an initial low fuelling rate phase to allow the ion temperature to build up in the plasma to, typically Q ∼ 5, followed by a larger rate to provide the density rise to the quasi-stationary Q = 10 ELMy H-mode conditions with 85% of nGW.
For the high Q (typically Q > 5) transient and quasi-stationary phases to reach the Q = 10 scenario, Ne seeding is required to maintain the divertor power fluxes under the 10 MW m−2 limit. This introduces a complex interaction between power flux control, particle control and fuelling when pellets are used to fuel the plasma due to the intrinsic particle fluxes that they cause. Pellets beyond a given size can trigger transient deep divertor detachment leading to the thermal collapse of the solution. The physics is subtle, and fully integrated simulations are therefore required when considering fuelling optimisation of ITER high Q plasmas; individual optimisation of separate aspects of particle and power control may be misleading.
Our integrated JINTRAC simulations of the exit from burn in the Q = 10 scenario show that the flexibility of the ITER systems can provide conditions in which plasma position control can be maintained and power fluxes to the divertor remain under the acceptable limit. This involves careful optimisation of fuelling and impurity (Ne) seeding to ensure it provides the necessary divertor radiation in the phases with high edge power flow (initial phase of the H-mode termination) and that Ne content is sufficiently low in later phases of the termination when the edge power fluxes are lower (end of H-mode and L-mode phases).
While these initial simulations indicate that the flexibility of the ITER fuelling, heating and impurity seeding systems is appropriate to ensure a robust access to/exit from and sustainment of Q = 10 burning plasmas, the plan for a detailed optimisation of heating and fuelling for a wide range of ITER high Q scenarios have prompted new feedback loops to be implemented in JINTRAC to improve the productivity of the code by avoiding much of the trial and error that has been required to perform the present work.
Acknowledgments
The main author wants to thank Xavier Bonnin at ITER for valuable insights and remarks on the manuscript. JINTRAC was used under license agreement between Euratom and CCFE, Ref. Ares(2014)3576010—28/10/2014. The full SOLPS simulation data mentioned appendix B are obtainable from the public ITER IMAS database. This work was funded jointly by the RCUK Energy Programme (Grant No. EP/I501045) and by ITER Task Agreement C19TD51FE implemented by Fusion for Energy under Grant GRT-502. To obtain further information on the data and models underlying this paper, whose release may be subject to commercial restrictions, please contact . The views and opinions expressed do not necessarily reflect those of Fusion for Energy which is not liable for any use that may be made of the information contained herein. The views and opinions expressed herein do not necessarily reflect those of the ITER Organization or Fusion for Energy.
Appendix A.: Assumptions on energy recycling in the SOL/divertor and their impact on simulation results
A.1. Introduction
In this appendix, we explore how different modelling assumptions, with regards to the energy of the recycling neutrals in the SOL/divertor, affect the properties of the overall plasma simulations and, in particular the divertor plasma. JINTRAC has historically assumed that the plasma ion energy source from charge exchange always acts as a sink (i.e. charge exchange from reflected neutrals always cools the ions), because the fast wall reflection of energetic neutrals was considered to be negligible. This assumption is reasonable when the plasma facing components (PFCs) are made from low Z materials (like C or Be), but increased reflection of fast neutrals arises in the case of PFCs made from higher Z materials (like W). Reflection of energetic neutrals increases the plasma ion energy source, and charge exchange can become a source of ion heating in the SOL/divertor. All the ITER simulations in the main part of this paper were carried out using the original JINTRAC assumption that reflected neutrals only cool the plasma. In this appendix we repeat a few reference ITER simulations from the main paper, using an improved model in JINTRAC to allow for a positive heat source from reflected energetic neutrals. This demonstrates that the improved model has only a modest impact on the predicted ITER scenarios; to assess the worst possible cases we consider conditions with high ion divertor temperatures where the effect under study should be largest although these are not realistic for ITER operation with a W divertor because of excessive W sputtering due to high ion temperatures and divertor power fluxes exceeding 10 MW m−2 in some cases.
When an ion hits a PFC one of three processes can happen: (1) the particle and its energy are absorbed by the wall; (2) thermal reflection, i.e. the ion returns as a molecule with PFC temperature and a cosine angular distribution; or (3) fast reflection, i.e. the ion returns as an atom with a fraction of the impact energy and angular distribution calculated by the TRIM database [66, 67]. For absorption and thermal reflections all or most of the energy is absorbed by the wall material and it would be correct to assume that the thermally reflected molecules are colder than the plasma and that the ensuing charge exchange process would cool the ions. Under detached conditions molecular dissociation processes, which are included, may provide significant heating due to the formation of Franck–Condon atoms [37]. Moreover, absorption and thermal reflection processes are the most likely ones in absorbing materials with an atomic mass close the plasma fuel species, such as carbon. In beryllium, a material with much lower fuel retention than carbon [68, 69] but also lower mass, thermal reflections dominate as well. The fuel retention in tungsten is also very low, but the much higher atomic mass promotes fast reflections where, on average, ∼50% of the impact energy [66, 67] returns to the plasma via highly energetic atoms. These may heat the ions through charge exchange processes and thus keep the divertor plasma hotter and reduce the likelihood of full detachment.
A.2. L-mode comparisons for ITER H plasmas
In this case we study the effect of the different modelling assumption of energy recycling as described in appendix A.1 on a pellet-fuelled 10 MA/5.3 T pure hydrogen plasma with 20 MW of ECRH. To ensure acceptable divertor power fluxes, gas is fuelled at a rate of 5.0 × 10²⁰ s−1 besides the fuelling by pellets (90 mm3/5.3 × 1021 particles), which we inject at a frequency of 4 Hz.
Figure A.1 shows that the volume-averaged core ion density and on-axis ion temperature are not affected by the divertor energy recycling assumptions but that there is a very minor effect on the outer-mid-plane (OMP) electron and ion densities and temperatures. This is supported by the nearly identical OMP profiles at the end of the simulation (figure A.2). Only at the divertor plates can we observe the impact of the different energy recycling assumptions. At the outer divertor (figure A.3) the densities and temperatures are somewhat higher for the correct W energy recycling assumptions, whereas at the inner divertor (figure A.4) we only see an increase in the target plasma temperatures. We have also obtained very similar results for pellet-fuelled (90 mm3/5.3 × 1021 particles, injection frequency 3.3–4 Hz) 15 MA/5.3 T pure hydrogen plasma simulations with 20 MW of ECRH and with a gas rate of 5.0 × 10²⁰ s−1. The main differences between the 10 and 15 MA cases are: (1) a slight increase of a few eV in the OMP ion temperature close to the plasma boundary for 15 MA; (2) a ∼0.1 × 10¹⁹ m−3 increase of both ion and electron OMP separatrix densities for 15 MA; and (3) a more pronounced increase in the inner target temperatures at 15 MA.

Figure A.1. Comparison of time traces with W-like (red, solid) and Be-like (blue, dashed) divertor energy assumptions for a 10 MA/5.3 T ITER hydrogen L-mode with 20 MW ECRH and no impurities. The applied gas rate was 5.0 × 10²⁰ s−1 and pellets (90 mm3/5.3 × 1021 particles) were injected with a frequency of 4 Hz. Sawtooth crashes are visible in the on-axis ion temperature time trace. Shown from top to bottom are volume-average core ion density, on-axis ion temperature, outer midplane (OMP) separatrix ion and electron temperatures and densities.
Download figure:
Standard image High-resolution image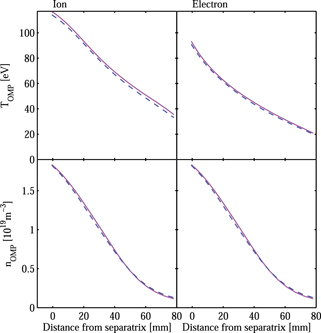
Figure A.2. Comparison of the outer-mid-plane SOL profiles at 188 s of ion (left) and electron (right) temperatures (top) and densities (bottom) with W-like (red, solid) and Be-like (blue, dashed) divertor energy recycling assumptions for a 10 MA/5.3 T ITER hydrogen L-mode with 20 MW ECRH and no impurities. The applied gas rate was 5.0 × 10 20 s−1 and pellets (90 mm3/5.3 × 1021 particles) were injected with a frequency of 4 Hz.
Download figure:
Standard image High-resolution image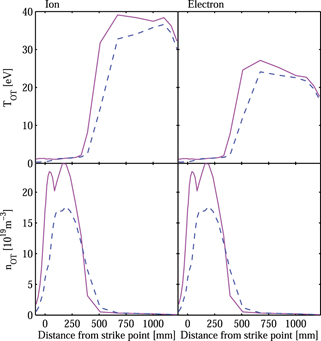
Figure A.3. Comparison of outer target profiles at 188 s of ion (left) and electron (right) temperatures (top) and densities (bottom) with W-like (red, solid) and Be-like (blue, dashed) divertor energy recycling assumptions for a 10 MA/5.3 T ITER hydrogen L-mode with 20 MW ECRH and no impurities. The applied gas rate was 5.0 × 10²⁰ s−1 and pellets (90 mm3/5.3 × 1021 particles) were injected with a frequency of 4 Hz.
Download figure:
Standard image High-resolution image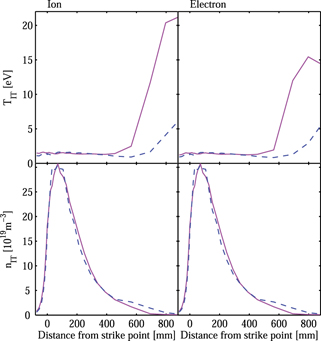
Figure A.4. Comparison of inner target profiles at 188 s of ion (left) and electron (right) temperatures (top) and densities (bottom) with W-like (red, solid) and Be-like (blue, dashed) divertor energy recycling assumptions for a 10 MA/5.3 T ITER hydrogen L-mode with 20 MW ECRH and no impurities. The applied gas rate was 5.0 × 10²⁰ s−1 and pellets (90 mm3/5.3 × 1021 particles) were injected with a frequency of 4 Hz.
Download figure:
Standard image High-resolution imageA.3. H-mode comparisons for ITER DT plasmas
In this section, we examine the impact of the energy-recycling modelling assumptions on a 15 MA/5.3 T DT H-mode with 33 MW of NB and 20 MW of ECRH heating. On top of a gas rate of 1.0 × 10²⁰ s−1 we simulate pellet fuelling (50/50 DT, 74 mm3/4.6 × 1021 particles) to achieve a target density of ∼1.0 × 10²⁰ m−3, as required for Q = 10 operation in ITER. JINTRAC automatically adjusted the frequency of the pellets to reach and maintain this target through appropriate feedback. These simulations also included impurities, Be sputtered from the main vessel wall and Ne from seeding (1.0 × 10²⁰ s−1) to reduce the divertor power fluxes, although the maximum power flux fluctuated between 5–30 MW m−2 at the outer target and between 5–15 MW m−2 at the inner target. Even if this case uses the latest assumptions for the ion energy source model, it should be noted that the power loads values quoted above are overestimated compared to the real values, since JINTRAC does not correct for the neutral reflected energy and this effect will decrease the power loads.
For the two different energy-recycling assumptions, the core time traces of the ion volume-average density and on-axis temperature are quite similar (figure A.5). This holds true for the time traces of the OMP separatrix temperatures as well. However, the OMP separatrix density with W-like energy recycling assumptions evolves with time whereas it remains rather stationary with Be-like energy recycling assumptions. This is likely due to a slight difference in the particle flux crossing the separatrix from the core into the SOL due to the higher energy of the recycled neutrals and increased core ionisation, which allows for a build-up of the OMP density in the W energy recycling assumptions case. This is also the cause of the different timings of the pellet injections as a pellet is not triggered unless the density goes below its target value by the feedback loop. Besides these small differences, the OMP SOL profiles are nearly identical (figure A.6). There are small variations (⩽10% at peak values) in the OT divertor profiles (figure A.7), while we can observe a more significant difference in the IT divertor ion temperature (∼30% at peak value) even if the other IT profiles differ by about 10% at peak values (figure A.8). It is important to remember that the plasmas modelled correspond to well attached conditions with minimal ionisation and recombination sources at the strike points (not shown). These plasma conditions are expected to show the largest differences in plasma behaviour due to the two different energy recycling assumptions.

Figure A.5. Comparison of time traces with W-like (red, solid) and Be-like (blue, dashed) divertor energy recycling assumptions for a 15 MA/5.3 T ITER DT H-mode with 53 MW auxiliary heating and including intrinsic and extrinsic impurities, Be and Ne, respectively. The applied gas rate was 1.0 × 10²² s−1 and pellets (50/50 DT, 72 mm3/4.2 × 1021 particles) were injected with an automatically adjusted frequency to achieve a line-average density of ∼1.0 × 10²⁰ m−3. Shown from top to bottom are volume-average core ion density, on-axis ion temperature, outer midplane (OMP) separatrix ion and electron temperatures and densities, and outer midplane particle flux crossing the separatrix.
Download figure:
Standard image High-resolution image
Figure A.6. Comparison of outer-mid-plane SOL profiles at 261.5 s of ion (left) and electron (right) temperatures (top) and densities (bottom) with W-like (red, solid) and Be-like (blue, dashed) divertor energy recycling assumptions for a 15 MA/5.3 T ITER DT H-mode with 53 MW auxiliary heating and including intrinsic and extrinsic impurities, Be and Ne, respectively. The applied gas rate was 1.0 × 10²² s−1 and pellets (50/50 DT, 72 mm3/4.2 × 1021 particles) were injected with an automatically adjusted frequency to achieve a line-average density of ∼1.0 × 10²⁰ m−3.
Download figure:
Standard image High-resolution image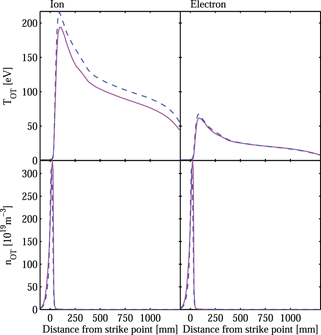
Figure A.7. Comparison of outer target profiles at 261.5 s of ion (left) and electron (right) temperatures (top) and densities (bottom) with W-like (red, solid) and Be-like (blue, dashed) divertor energy recycling assumptions for a 15 MA/5.3 T ITER DT H-mode with 53 MW auxiliary heating and including intrinsic and extrinsic impurities, Be and Ne, respectively. The applied gas rate was 1.0 × 10²² s−1 and pellets (50/50 DT, 72 mm3/4.2 × 1021 particles) were injected with an automatically adjusted frequency to achieve a line-average density of ∼1.0 × 10²⁰ m−3.
Download figure:
Standard image High-resolution image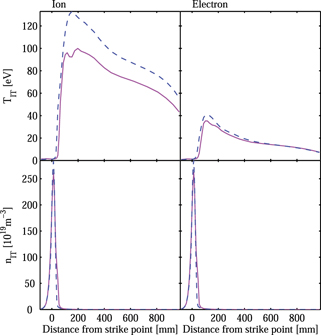
Figure A.8. Comparison of inner target profiles at 261.5 s of ion (left) and electron (right) temperatures (top) and densities (bottom) with W-like (red, solid) and Be-like (blue, dashed) divertor energy assumptions for a 15 MA/5.3 T ITER DT H-mode with 53 MW auxiliary heating and including intrinsic and extrinsic impurities, Be and Ne, respectively. The applied gas rate was 1.0 × 10²² s−1 and pellets (50/50 DT, 72 mm3/4.2 × 1021 particles) were injected with an automatically adjusted frequency to achieve a line-average density of ∼1.0 × 10²⁰ m−3.
Download figure:
Standard image High-resolution imageContrary to the L-mode case in appendix A.2, where the divertor target temperatures increased when switching from a Be to a W divertor, in H-mode the temperatures dropped slightly. The difference occurs as for the same upstream conditions, the divertor temperatures tend to increase with more energetic recycling of neutrals, as illustrated in the L-mode case. However, in the H-mode case shown here, this is not so apparently obvious, as the time history (figure A.5) shows a more marked impact on the upstream conditions. This arises as the heating of the divertor region triggers higher impurity seeding to control the target heat load, and this cooling effect trumps the effect of the higher recycling energy.
A.4. Conclusions
For ITER hydrogen and DT plasmas cases with a W divertor and Be main chamber wall, we have investigated the consequences of different assumptions on ion-energy recycling at the divertor and their effects on the SOL and divertor plasmas, through their impact on charge-exchange energy balance, and on the global plasma behaviour in general and divertor conditions in particular. As our simulations show for ITER plasmas, where ionisation lengths of recycling neutrals are much smaller than plasma dimensions, there is a negligible impact on the core plasma parameters and a minor impact on the SOL and divertor parameters. The minor effects associated with higher energy of the recycled ions on the W divertor target, lead to slightly increased divertor temperatures, thus requiring a higher separatrix density or impurity seeding level to achieve the conditions required for divertor detachment. On this basis we can conclude that the evaluation of the density range achievable with gas fuelling in ITER provided by our studies in the main part of this paper is a conservative lower estimate regarding the limitations imposed by divertor detachment. Inclusion of the proper (W-like with low Be surface deposition) energy recycling assumptions for the ITER divertor is likely to increase this range although, from the studies in this appendix, it appears that this increase will be small. A similar study with SOLPS-ITER, which explored the dependence of the ITER divertor plasma performance on neutral recycling assumptions for Be and W in detail, also came to this same conclusion [37].
Appendix B.: Comparisons between EDGE2D and SOLPS4.3
B.1. Introduction
Prior benchmarking work carried out for the JET plasma edge was between the fluid edge plasma code SOLPS5.0 and the fluid edge plasma code EDGE2D/NIMBUS [70]. However, in this appendix we compare simulation results for the plasma edge obtained by SOLPS4.3 used previously at ITER, and EDGE2D/EIRENE. We have used the latter in the fully integrated modelling of ITER plasmas in this paper.
For the comparison we did two density scans for hydrogen plasmas with different input powers of 20 MW and 40 MW. The density scan with 20 MW input power includes a higher density regime (beyond the recycling flux roll-over) whereas the 40 MW input power density scan stays below the roll-over [71]. In addition, we did one case for He plasma for a single outer midplane separatrix density at 40 MW input power.
The scope of the comparison is not a fully detailed benchmark between EDGE2D and SOLPS4.3 and was aimed at demonstrating the applicability of EDGE2D-EIRENE for ITER comparing the fuelling predictions of both codes. It is also expected, that the simulation results for the highest densities beyond the recycling flux roll-over will be different, due to different neutral models used for EDGE2D and SOLPS4.3 in the kinetic neutral Monte-Carlo code EIRENE. It should also be noted that in this comparison, plasma drifts were not included in either the SOLPS4.3 or EDGE2D simulations.
B.2. Grid generation and equilibrium
For the generation of the grid we used a 15 MA reference case, for which the equilibrium was provided by the ITER Organisation via a GEQDSK-File with a Ψ-map (poloidal magnetic flux) resolution of 65 × 129.
We did several improvements to the grid generation algorithm of the GRID2D code to provide an optimal starting point for the actual comparison between EDGE2D and SOLPS4.3. For instance, the algorithm in GRID2D to transform the metric coefficient Hρ [28] from an orthogonal grid to a non-orthogonal grid, which can represent the tilted target geometry, had some inaccuracies. These inaccuracies lead to oscillations in Hρ . We have now corrected the algorithm in GRID2D, which removes the oscillations in Hρ and thus from the simulated pressure profiles.
Another upgrade we did to the GRID2D algorithm is that it now produces a smooth transition between the compression in the private flux region and the SOL region. This avoids the formation of strongly distorted cells during the grid generation process for ITER, where GRID2D needs a stronger grid compression in the SOL region, to comply with the shoulder region of the inner and outer targets, than the maximum compression applicable for the private flux region.
Moreover, as part of the comparison we also implemented the grid used by SOLPS4.3 with an increased grid resolution around the first few cells at the inner and outer target.
Figure B.1 shows an example of the impact of the new grid generation algorithm on the simulation results obtained by EDGE2D using the Mach number profile around the outer target. With the old grid (figure B.1, left) there is a strong distortion of the Mach number profiles around the shoulder of the outer divertor target, which is not present with the new grid (figure B.1, right).

Figure B.1. 2D (vertical plasma position vs major radius) comparison of the Mach number profile obtained from the EDGE2D simulation using the old (left) and the new (right) grid generation algorithm in GRID2D.
Download figure:
Standard image High-resolution imageB.3. Vacuum vessel
Besides the equilibrium, to confine the neutral particles we defined a closed structure, consisting of the outline of the vacuum vessel and the plasma facing components (figure 1, red line). The divertor dome (figure 1, below the private region in green) is also included and the structural support of the dome was represented as semi-transparent surfaces (figure 1, blue lines) with a transparency of 0.5 from both sides. The pump is represented by a pumping surface (figure 1, pink line) between the dome support structures with an albedo of 0.9928.
The material for all surfaces is beryllium and different surface temperatures are assumed for different wall regions. The main chamber has in both codes a temperature of 580 K, but in the divertor region the temperatures are different. For the part of the divertor plates which is covered by the EDGE2D simulation domain, EDGE2D uses only one temperature, 1160 K, whereas SOLPS4.3 divides the divertor plates into two regions with 1160 K (around the strike point) and 812 K (divertor shoulder). Moreover, EDGE2D applies only one temperature for the private wall region, 812 K. In SOLPS4.3 the walls in the private region have two temperatures. The plasma-facing side of the dome is set to 812 K. The rest of the dome, as well as the support structure and the pump surface, are set to 512 K. We carried out some tests in EDGE2D where the temperature of the divertor plates was switched between 1160 K and 812 K, which showed only a minor impact on the results. Hence, we do not expect that these different divertor temperature definitions will have a significant impact on the comparison of simulation results.
B.4. EIRENE neutral model
EDGE2D has the ability to use two different neutral models within EIRENE. One, which is mimicking the neutral model of the previously used NIMBUS code and one that includes additional molecular processes such as molecular ions, which allows e.g. for channels such as molecular assisted recombination. The benefit of the reduced NIMBUS-like neutral model is that EDGE2D has a source linearisation scheme available for this model, which dramatically speeds up the simulations. The full EIRENE neutral model is identical to the one used by SOLPS4.3 but without neutral–neutral collisions. The following gives a short overview of the reactions include in both models.
The reduced NIMBUS-like neutral model:
- H + e → H+ + 2e (ref: ADAS scd)
- H + H+ → H+ + H (ref: HYDHEL 3.1.8)
- H2 + e → H + H + e (ref: HYDHEL 2.2.5)
- H2 + e → H + H+ + 2e (ref: HYDHEL 2.2.9)
- H2 + e → H + H+ + 2e (ref: HYDHEL 2.2.10)
- H+ + e → H (ref: ADAS acd)
Full EIRENE neutral model (Kotov2008 [30] without neutral–neutral collisions and opacity):
- H + e → H+ + 2e (ref: AMJUEL 2.1.5)
- H + H+ → H+ + H (ref: HYDHEL 3.1.8)
- H2 + e → H + H + e (ref: AMJUEL 2.2.5g)
- H2 + e → H2 + + 2e (ref: AMJUEL 2.2.9)
- H2 + e → H + H+ + 2e (ref: AMJUEL 2.2.10)
- H2 + H+ → H2 + H+ (ref: AMJUEL 0.3T)
- H2 + H+ → H + H2 + (ref: AMJUEL 3.2.3)
- H2 + + e → 2H+ + 2e (ref: AMJUEL 2.2.11)
- H2 + + e → H + H+ + e (ref: AMJUEL 2.2.12)
- H2 + + e → 2H (ref: AMJUEL 2.2.14)
- H+ + e → H (ref: AMJUEL 2.1.8)
For the simulations below, we have used the reduced NIMBUS-like neutral model for EIRENE in the EDGE2D simulations. It was demonstrated previously that the full EIRENE model is necessary in EDGE2D/Eirene to reproduce divertor detachment past roll-over [72] and this can explain the differences observed in the semi-detached high density (past roll-over) regimes between the SOLPS4.3 and EDGE2D simulations presented in this appendix. Moreover, the demonstration mentioned above was also the basis for making the Kotov 2008 list of reactions the default set for hydrogenic plasmas in SOLPS (all versions).
B.5. Development on EDGE2D and important settings
During the comparison process several switches in EDGE2D were identified to comply with settings used in the SOLPS4.3 simulations. Additionally, also some differences in the model equations of EDGE2D and SOLPS4.3 were identified and implemented in the EDGE2D code. A summary of these extensions and important settings in EDGE2D are summarised below.
- The heat flux limiter for electrons was set to 0.2 and for ions it was switched off.
- Perpendicular transport coefficients are constant with values D = 0.3 m2 s−1 and χe = χi = 1 m2 s−1.
- The compressional terms (related to work done by the electric field) were switched on in the energy balances to comply with the settings from SOLPS4.3.
- In EDGE2D the possibility to define semi-transparent surfaces below the dome structure was implemented.
- Different surface temperatures at the target, dome and main chamber were implemented in EDGE2D (previously only one wall temperature was possible).
- As SOLPS4.x solves a total energy equation while EDGE2D/EIRENE (and later SOLPS versions) solves an internal energy equation [73], neutral source terms related to kinetic energy (−(Smom*Vpar − 0.5*mi*Vpar 2*Sion)) had to be added in the ion temperature equation of EDGE2D.
- Heating due to radial and parallel viscosity was included in the ion temperature equation of EDGE2D.
- A B2-like viscosity limiter can now be used in place of the usual EDGE2D viscosity limiter. By default EDGE2D limits the viscous stress πi for positive dV||/dθ by 0.4pi and negative dV||/dθ by 2.0pi.
Of these modifications to EDGE2D/EIRENE the last one in the list, the B2-like viscosity limiter had the biggest impact on the results. On the other hand when SOLPS5.0 was benchmarked against EDGE2D/NIMBUS, the main difference was found to be the physics assumptions for the ion flux limiters. When the same assumptions were made, the remaining discrepancies between the two codes were small.
B.6. Development on EDGE2D for He plasmas and important settings
EDGE2D was originally set up to run with only one hydrogenic species as the main plasma component. This implied that He plasma simulations needed to be run through the impurity code branch of EDGE2D. We therefore prepared EDGE2D to run with an impurity as a majority species. At the same time, we extended EDGE2D to allow for hydrogenic species as impurities. This was mainly done to test the recent He developments, but as a side effect, it is now possible for EDGE2D to resolve the equations for D and T separately in the SOL/divertor, rather than having to combine them into one species with an average mass of 2.5 AMU to be evolved in the main plasma channel.
The impurity branch of EDGE2D lacked several processes that we had to add in order for it to correctly model a main plasma species:
- Volume recombination
- Charge exchange processes, in particular, He − He+ and He − He++
To maintain consistency between EDGE2D and SOLPS4.3, the elastic processes used for He in SOLPS4.3/EIRENE are now also applied in EDGE2D/EIRENE.
To verify that the main and the impurity branch of EDGE2D were equivalent, we carried out tests with 10% H and 90% D mixtures where the minority and majority species were switched between fuel and impurity species in EDGE2D. The code showed identical behaviour in both configurations, including the time evolution. We are hence confident the He modifications in EDGE2D are correctly implemented.
B.7. Simulation results for 20 MW H density scan
For the following simulations and those in appendices B.8 and B.11, we use the settings described in appendix B.5 together with the reduced NIMBUS-like neutral model in EIRENE shown in appendix B.4. For the density scan with 20 MW input power we use the outer midplane (OMP) separatrix density obtained from the SOLPS4.3 simulations (table B.1) to control the EDGE2D OMP separatrix density to the same value, using a control puff.
Table B.1. Outer midplane separatrix density and reference run numbers for the SOLPS and EDGE2D simulations of the 20 MW H density scan.
| nOMP,sep (m−3) | SOLPS simulation | EDGE2D simulation |
|---|---|---|
| 0.573 × 10¹⁹ | IDS #102292 | 10140 |
| 0.923 × 10¹⁹ | IDS #102294 | 10141 |
| 1.234 × 10¹⁹ | IDS #102296 | 10142 |
| 1.326 × 10¹⁹ | IDS #102297 | 10143 |
| 1.767 × 10¹⁹ | IDS #102299 | 10144 |
| 2.065 × 10¹⁹ | IDS #102308 | 10145 |
For the 20 MW H density scans (figures B.2–B.5) show that both codes produce similar results apart from the two highest densities (nOMP,sep = 1.767 × 10¹⁹ m−3 and nOMP,sep = 2.065 × 10¹⁹ m−3). In the lower density range, EDGE2D and SOLPS4.3 tend to give comparable inner and outer target densities (figure B.3) and temperatures for both electrons and ions, with the biggest deviation for the inner target ion temperature (figure B.4). Moreover, the static target pressure is quite similar in both codes. For the power load on the targets (figure B.5; contribution from plasma species only), EDGE2D tends to give higher power loads than SOLPS4.3, with a better agreement on the outer target.

Figure B.2. OMP density profiles from SOLPS (dashed) and EDGE2D (solid) at 20 MW for a range of OMP separatrix H densities. OMP temperatures (not shown) are almost identical except for a slight deviation at the highest densities. In the legend, the numbers after EDGE2D and SOLPS refer to the last 2 or 4 digits, respectively, of the simulation number in table B.1.
Download figure:
Standard image High-resolution image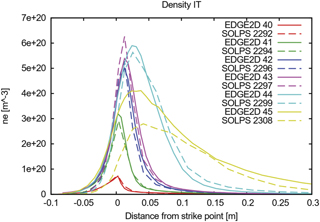
Figure B.3. Electron densities at the inner target from SOLPS (dashed) and EDGE2D (solid) at 20 MW for a range of OMP separatrix H densities. In the legend, the numbers after EDGE2D and SOLPS refer to the last 2 or 4 digits, respectively, of the simulation number in table B.1.
Download figure:
Standard image High-resolution image
Figure B.4. Ion temperatures at the inner target from SOLPS (dashed) and EDGE2D (solid) at 20 MW for a range of OMP separatrix H densities. In the legend, the numbers after EDGE2D and SOLPS refer to the last 2 or 4 digits, respectively, of the simulation number in table B.1.
Download figure:
Standard image High-resolution image
Figure B.5. Power loads (contribution from plasma species only) at the inner target from SOLPS (dashed) and EDGE2D (solid) at 20 MW for a range of OMP separatrix H densities. In the legend, the numbers after EDGE2D and SOLPS refer to the last 2 or 4 digits, respectively, of the simulation number in table B.1.
Download figure:
Standard image High-resolution imageThe disagreement between EDGE2D and SOLPS4.3 for the two highest densities was expected due to the differences in the neutral models used for EIRENE. As the two high density cases are already at and beyond the rollover, the additional processes such as molecular assisted recombination (MAR), which are only included in the full EIRENE (Kotov2008) neutral model, become significant.
B.8. Simulation results for 40 MW H density scan
The simulation cases for the H density scan at 40 MW are summarised in table B.2.
Table B.2. Outer midplane separatrix density and reference run numbers for the SOLPS and EDGE2D simulations of the 40 MW H density scan.
| nOMP,sep (m−3) | SOLPS simulation | EDGE2D simulation |
|---|---|---|
| 0.989 × 10¹⁹ | IDS #102281 | 10146 |
| 1.808 × 10¹⁹ | IDS #102277 | 10147 |
| 2.237 × 10¹⁹ | IDS #102279 | 10148 |
| 2.799 × 10¹⁹ | IDS #102301 | 10149 |
For the 40 MW H density scan the outer midplane profiles show very good agreement between EDGE2D and SOLPS4.3, apart from the outer midplane density outside of the separatrix that drops slightly faster in the EDGE2D simulations than in SOLPS4.3 (figure B.6).
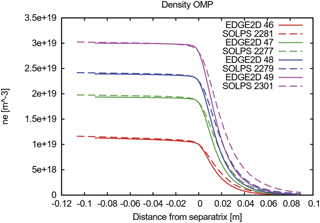
Figure B.6. OMP density profiles from SOLPS (dashed) and EDGE2D (solid) at 40 MW for a range of OMP separatrix H densities. OMP temperatures (not shown) are almost identical. In the legend, the numbers after EDGE2D and SOLPS refer to the last 2 or 4 digits, respectively, of the simulation number in table B.2.
Download figure:
Standard image High-resolution imageAt the inner and outer targets, the profiles (figures B.7 and B.8) are fairly similar between EDGE2D and SOLPS4.3, though the peak of the density profile is shifted further away from the strike point in EDGE2D. There is a reasonable agreement between the codes for the power loads at the targets. However, at the inner target, EDGE2D still predicts a noticeable higher power load than SOLPS4.3 for the lowest separatrix density (figure B.9).

Figure B.7. Electron densities at the inner target from SOLPS (dashed) and EDGE2D (solid) at 40 MW for a range of OMP separatrix H densities. In the legend, the numbers after EDGE2D and SOLPS refer to the last 2 or 4 digits, respectively, of the simulation number in table B.2.
Download figure:
Standard image High-resolution image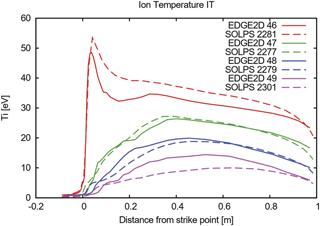
Figure B.8. Ion temperatures at the inner target from SOLPS (dashed) and EDGE2D (solid) at 40 MW for a range of OMP separatrix H densities. In the legend, the numbers after EDGE2D and SOLPS refer to the last 2 or 4 digits, respectively, of the simulation number in table B.2.
Download figure:
Standard image High-resolution image
Figure B.9. Power loads (contribution from plasma species only) at the inner target from SOLPS (dashed) and EDGE2D (solid) at 40 MW for a range of OMP separatrix H densities. In the legend, the numbers after EDGE2D and SOLPS refer to the last 2 or 4 digits, respectively, of the simulation number in table B.2.
Download figure:
Standard image High-resolution imageB.9. Divertor neutral screening
In order to compare the divertor neutral screening, i.e. the fraction of the neutrals which escape from the divertor region, between the EDGE2D and SOLPS4.3 simulations, we compare 0-dimensional key parameters of the simulations, such as ionisation in different simulation regions (main SOL, inner and outer divertor), neutral influx to the core and recycling at targets and main chamber walls, for the 20 MW and 40 MW density scans.
Figure B.10 shows the recycling flux (particle outflux at the target returned as a neutral influx) at the inner (IT) and outer target (OT) versus the outer midplane separatrix density for the 20 MW density scan of EDGE2D and SOLPS4.3. Figure B.11 shows the same data for the 40 MW density scan is. Also here both codes are in the same recycling regime before the roll-over.

Figure B.10. Recycling flux of EDGE2D and SOLPS4.3 at the inner and outer target for the 20 MW H density scan. The green line indicates the rollover OMP density.
Download figure:
Standard image High-resolution image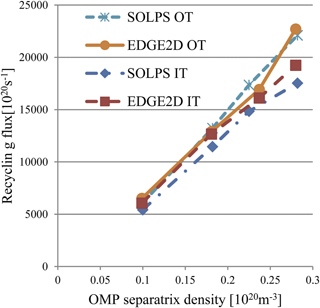
Figure B.11. Recycling flux of EDGE2D and SOLPS4.3 at the inner and outer target for the 40 MW H density scan.
Download figure:
Standard image High-resolution imageFigure B.12 shows the neutral influx over the separatrix into the core for the 20 MW and 40 MW H density scans. For the 40 MW density scan both codes predict nearly identical neutral core influxes. For the 20 MW density scan, the neutral core influxes agree in both codes below recycling flux roll-over. After the roll-over, EDGE2D gives a much higher neutral core influx, which is probably related to the different neutral model used in EIRENE by the EDGE2D code.
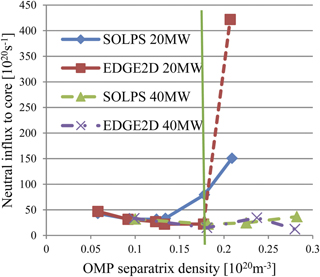
Figure B.12. Neutral influx through the separatrix to the core obtained by EDGE2D and SOLPS4.3 for the 20 MW and 40 MW H density scans. The green line indicates the rollover OMP density for the 20 MW case.
Download figure:
Standard image High-resolution imageFor the 40 MW density scan, the divertor screening is very similar in EDGE2D and SOLPS4.3 (figure B.13). Only at the highest density, the divertor screening starts to differ between EDGE2D and SOLPS4.3. In the 20 MW density scan, the divertor screening is also similar in both codes before the recycling flux reaches the roll-over. After the roll-over the results from the codes diverge (note that the divertor screening (0.48 (SOLPS4.3)/0.17 (EDGE2D)) for the highest density is far outside of the plot).
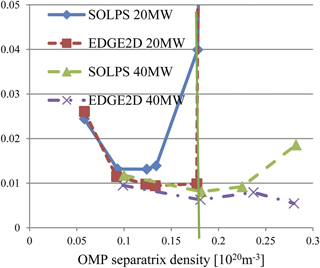
Figure B.13. Divertor neutral screening obtained by EDGE2D and SOLPS4.3 for the 20 MW and 40 MW H density scans. Note that the divertor screening (0.48 (SOLPS4.3)/0.17 (EDGE2D)) for the highest density with 20 MW is far outside of the plot range of max 0.05. The green line indicates the rollover OMP density for the 20 MW case.
Download figure:
Standard image High-resolution imageB.10. Simulation results for 40 MW at a single He OMP density
The simulation cases for a single OMP He separatrix density at 40 MW are summarised in table B.3.
Table B.3. Outer midplane separatrix density and reference run numbers for the SOLPS and EDGE2D simulations for a single He OMP density at 40 MW.
| nOMP,sep (m−3) | SOLPS simulation | EDGE2D simulation |
|---|---|---|
| 0.567 × 10¹⁹ | IDS #112358 | 10656 |
A good match between EDGE2D and SOLPS4.3 for the OMP profiles is obtained for the electron and He++ (figure B.14) densities and electron and ion temperatures. Compared to SOLPS4.3, EDGE2D predicts a lower He+ density outside the separatrix. The He+ is negligible inside the separatrix and then increases rapidly reaching a maximum 4 cm outside the separatrix of ∼5.4 × 10¹⁶ m−3 in SOLPS4.3 and ∼2.2 × 10¹⁶ m−3 in EDGE2D before falling off again towards the wall.
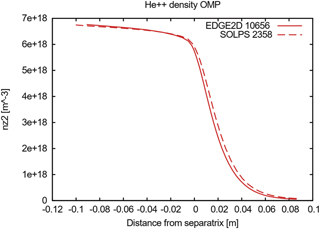
Figure B.14. OMP He++ density profiles from SOLPS (dashed) and EDGE2D (solid) at 40 MW. OMP temperatures (not shown) are almost identical.
Download figure:
Standard image High-resolution imageAt the outer target, He and electron densities (figure B.15), and electron temperature are very similar between the codes (figure B.16), with a minor discrepancy between the codes seen in the ion temperature (figure B.17).

Figure B.15. Electron densities at the outer target from SOLPS (dashed) and EDGE2D (solid) at 40 MW for a fixed He OMP separatrix density.
Download figure:
Standard image High-resolution image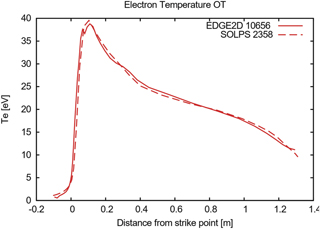
Figure B.16. Electron temperatures at the outer target from SOLPS (dashed) and EDGE2D (solid) at 40 MW for a fixed He OMP separatrix density.
Download figure:
Standard image High-resolution image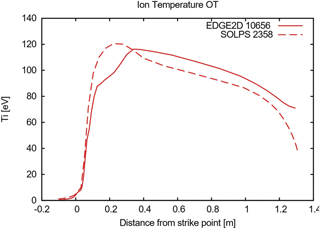
Figure B.17. Ion temperatures at the outer target from SOLPS (dashed) and EDGE2D (solid) at 40 MW for a fixed He OMP separatrix density.
Download figure:
Standard image High-resolution image
B.11. Conclusions of EDGE2D/SOLPS4.3 comparison
For the comparison of EDGE2D/SOLPS4.3 we did two density scans with different input powers of 20 MW and 40 MW for a H plasma in a vessel with Be walls and divertor. We have compared upstream as well as downstream plasma profiles, to show that the EDGE2D-EIRENE code gives similar simulation results for low density attached divertor regimes (pre recycling flux roll-over) as the ITER SOLPS4.3 code. As expected, we found differences in the high density semi-detached divertor regimes due to different neutral models used by EIRENE in both codes. The necessary settings for EDGE2D-EIRENE were identified and new options were implemented to get as close as possible with EDGE2D-EIRENE code to the SOLPS4.3 simulation results. Also several improvements to the grid generation algorithm from GRID2D were implemented to optimise the quality of the EDGE2D-EIRENE simulations.
A global analysis showed also that the predicted core fuelling from both codes agrees, which paved the way for the fuelling studies with the fully integrated JINTRAC code suite.
For the purpose of fuelling studies for ITER, comparison between EDGE2D and SOLPS of He majority plasmas was successful justifying the use of JINTRAC forITER He plasmas simulations described in section 3.2 of this paper