


Abstract
Studies of energetic particle transport due to energetic-particle-driven Alfvénic instability have progressed using neutron and energetic particle diagnostics in Large Helical Device deuterium plasmas. Alfvénic instability excited by injecting an intensive neutral beam was observed by a magnetic probe and a far-infrared laser interferometer. The interferometer showed Alfvénic instability composed of three modes that existed from the core to the edge of the plasma. A comparison between the observed frequency and shear Alfvén spectra suggested that the mode activity was most likely classified as an Alfvénic avalanche. A neutron fluctuation detector and a fast ion loss detector indicated that Alfvénic instability induced transport and loss of co-going transit energetic ions. The dependence of the drop rate of the neutron signal on the Alfvénic instability amplitude showed that significant transport occurred. Significant transport might be induced by the large amplitude and radially extended multiple modes, as well as a large deviation of the energetic ion orbit from the flux surface.
Export citation and abstract BibTeX RIS

Original content from this work may be used under the terms of the Creative Commons Attribution 4.0 licence. Any further distribution of this work must maintain attribution to the author(s) and the title of the work, journal citation and DOI.
1. Introduction
Energetic particle confinement is one of the issues in realizing fusion power generation because deuterium–tritium (D–T) fusion burning plasma is mainly heated by energetic alpha particles created by D–T reactions. The primary topic of energetic particle confinement studies in existing machines is energetic ion transport due to energetic-particle-driven magnetohydrodynamic (MHD) instabilities, such as Alfvén eigenmodes [1] or energetic particle continuum modes (EPMs) [2], to understand how to suppress alpha particle transport in a fusion burning plasma [3]. Energetic particles injected by a neutral beam (NB) injector, created by ion cyclotron heating, and produced by fusion reactions have been utilized in energetic particle confinement studies [4]. For a deeper understanding of the effect of energetic-ion-driven MHD instabilities on energetic ion confinement, simultaneous measurement of energetic transport and loss is crucial [5]. In currently performed NB-heated deuterium plasma experiments, neutrons are mainly created by fusion reactions between beam deuterons and bulk deuterons because, in most cases, the beam energy is higher than the bulk-ion temperature, and the cross-section of d(d, n)3He significantly increases with deuteron energy [6]. Therefore, the total neutron emission rate, neutron emission profile, and neutron energy spectrum reflect the global confinement, radial profile, and energy distribution of beam ions, respectively [7, 8].
The degradation of energetic ion confinement due to Alfvén eigenmodes has been examined intensively through neutron measurements in large tokamaks [9–12]. In addition, a fast ion loss detector (FILD) originating in the Tokamak Fusion Test Reactor (TFTR) [13], which provides the energy and pitch angle distribution of escaping energetic ions, has greatly contributed to understanding the velocity distribution of lost energetic ions in tokamaks [14–21]. Simultaneous measurement of the total neutron emission rate and energy- and pitch-angle-resolved energetic ion escaping rate to the local position was performed using neutron diagnostics and FILDs. In the TFTR, a substantial drop in the total neutron emission rate and a significant increase in the escaping energetic ion rate to the FILD due to the global Alfvén eigenmode (GAE) were observed [22]. The results showed that the energetic ions were transported to the outer plasma region and escaped from the plasma, by means of the GAE. Additionally, in the Doublet III-D (DIII-D) and Axially Symmetric Divertor Experiment Upgrade (AUG), the experimentally observed total neutron emission rate was compared with classical transport solver calculations TRANSP [23], the Alfvén eigenmode structure was compared to that of ideal MHD solver, and the energetic ion escape rate was compared to that of orbit-following models [24]. Energetic ion confinement physics has been intensively studied and has largely progressed using neutron diagnostics and escaping energetic ion measurements.
An energetic particle confinement study has also been performed in stellarators/heliotrons toward a steady-state fusion reactor. Stellarators and heliotrons have an advantage in steady-state operations. High plasma performance has recently been achieved in large-sized devices, such as an energy confinement time longer than 100 ms in the Wendelstein 7-X (W7-X) [25] and a 10 keV central ion temperature in the Large Helical Device (LHD) [26]. A study of the energetic ion loss process was performed using a FILD in the middle-sized stellarators and heliotrons [27–31]. Additionally, an energetic particle physics study in the W7-X was initiated using NB in 2018 [32] and will be advanced using FILD [33, 34]. To date, a study of energetic ion transport/loss due to energetic-particle-driven MHD instability has been led in the LHD [35] based on intensive NB injectors [36]. In LHD hydrogen plasma experiments, a study was performed mainly using an E∥B neutral particle analyzer [37, 38] and FILD [39, 40]. Experimental studies on energetic ion transport due to toroidal Alfvén eigenmodes (TAEs) [41–45], EPMs [46, 47], and energetic-particle-driven geodesic acoustic modes (EGAMs) [48, 49] have been performed. Numerical simulation using orbit-following models [50] and the particle-in-cell-MHD hybrid simulation MEGA code showed qualitative agreement with the experimentally observed velocity distribution of transported and escaping energetic particles [51–53] due to TAE and EGAM channeling [54]. However, providing a quantitative discussion of energetic ion transport or obtaining information about global energetic ion confinement was fairly difficult, because previous experiments were performed with hydrogen gas. By starting deuterium plasma experiments in the LHD in March 2017 [55–58], a global and quantitative discussion of energetic particle confinement has become possible [59]. For example, a quantitative discussion of beam ion confinement, based on total neutron emission measurements [60–62], showed that the behavior of beam ions injected by a short pulse NB in an MHD quiescent plasma can be described with neoclassical models, and the confinement ability of D–D fusion-born 1 MeV tritons, which are regarded as a simulation of D–T fusion-born alpha particles in the LHD [63], measured by a scintillating fiber detector [64–67] is comparable to that in the Korea Superconducting Tokamak Advanced Research [68] whose minor radius is comparable to the LHD. Moreover, the effect of an energetic-ion-driven resistive interchange mode (EIC) [69–71], classified into EPMs on the confinement of helically-trapped beam ions exciting the EIC, has been studied using neutron flux monitors [72, 73] and vertical neutron cameras [74–76]. Vertical neutron cameras visualized the helically-trapped beam ion density profile [77] and transport of helically-trapped beam ions due to the EIC [78–80]. In addition, the transport of passing transit beam ions and 1 MeV tritons due to the EIC has been studied [81, 82]. The performance of comprehensive neutron diagnostics developed for advancing energetic particle confinement studies in the LHD has been shown [83]. In this paper, we report the first observation of the simultaneous measurement of energetic ion transport and loss due to energetic-particle-driven MHD instability in the LHD deuterium plasma experiment.
2. Experimental setups
2.1. Large Helical Device
Figure 1(a) shows the top view of the LHD together with the NB injectors, a comprehensive neutron detector [84] and the FILD utilized in experiments. The LHD is characterized as being equipped with three intensive negative-ion-source-based NB injectors, N-NB#1, N-NB#2, and N-NB#3, whose acceleration voltage is ∼180 kV. The injection power of each N-NB is up to 3 MW for deuterium beam injection and up to 6 MW for hydrogen beam injection [85]. The steep gradient of beam ion pressure, formed by intensive N-NB injection, becomes the excitation source for various MHD instabilities. In particular, strong MHD instabilities are excited under a relatively low magnetic field strength condition where the beam ion beta is relatively high [86]. Therefore, the study of energetic ion transport due to the energetic-particle-driven MHD instabilities has been mainly performed under relatively low-field conditions [87]. In these experiments, MHD instability was mainly measured by a magnetic probe placed on the vacuum vessel [88]. In the previous experiment, the radial profile of TAEs was measured using a fast-time-response H-alpha array [42]. The experimentally obtained H-alpha fluctuation profile is consistent with the fluctuation profile predicted by the linear Alfvén eigenmode eigenfunction calculation code AE3D [89]. However, the application of a fast-time-response H/D-alpha array is limited by the penetration of hydrogen/deuterium inside the plasma. In experiments, a far-infrared (FIR) laser interferometer [90] was utilized to measure line-integrated electron density fluctuations due to Alfvénic instability (figure 1(b)). The FIR laser interferometer was utilized to measure electron density fluctuation having relatively low-frequency, excited by bulk plasma pressure [91]. Recently, the detection part of the FIR laser interferometer was upgraded [92]. Then electron density fluctuation measurement with a better signal-to-noise ratio became possible due to the suppression of the noise level, especially for the high-frequency range. The FIR laser interferometer views the plasma vertically with 11-sightlines and covers the whole region of the plasma. The diameter of each sightline is 42 mm, and the detectors are placed with a 90 mm step. Here, the color image shows the normalized minor radius (r/a99) of the plasma. The typical beam ion density calculated using FIT3D-DD code [93, 94] due to NB#1 and NB#2 injection is shown in figure 1(c). The relatively steep gradient appears at r/a99 of 0.5 to 0.8.

Figure 1. (a) Arrangement of LHD neutron diagnostics and the fast ion loss detector utilized in this study. (b) Sightlines of the FIR laser interferometer where 11 sightlines are used for this analysis. The contour color indicates the normalized minor radius. (c) Typical beam ion density profile calculated by FIT3D-DD code.
Download figure:
Standard image High-resolution image2.2. Neutron and energetic particle diagnostics
The study of energetic particle transport due to energetic-ion-driven MHD instability was performed using a neutron fluctuation detector and an FILD. Figure 2(a) shows a block diagram of the neutron fluctuation detector installed in the LHD. A plastic scintillator (EJ-200, Eljen Technology) with a 2 inch diameter and a 1 inch thickness was used. The reason for choosing the EJ-200 is its relatively fast-time response, compared with a fast-neutron scintillator [95]. Note that the EJ-200 has sensitivity to fast-neutrons and gamma-rays. During the normal deuterium discharge, the gamma-ray is dominated by prompt gamma-ray induced by fast-neutron [96]. EJ-200 signal can be used as a reference of neutron emission rate, because the fast-neutron and prompt gamma-ray induced signals have the same trends [97]. The EJ-200 scintillator was directly coupled with a conventional 2 inch photomultiplier tube (PMT) (H7195, Hamamatsu Photonics K.K.), which has high-gain stability in current mode operation. The EJ-200 detector was surrounded by an iron shield made of SS400 with a thickness of 10 mm to avoid the stray magnetic field effect on the PMT. The anode signal of the PMT was directly fed into a low-impedance current amplifier (C7319, NF Corporation) with a 106 gain factor through a 50 ohm 60 m double shield coaxial cable (3D-FB). Note that the bandwidth of the current amplifier was set to 20 kHz to reduce unwanted high-frequency electromagnetic noise superposed between the PMT and the current amplifier. The voltage signal from the current amplifier was acquired by a 1 MHz sampling data acquisition system (PXI-6133, NI Corp.). The high voltage of the PMT was applied through a 60 m coaxial cable by an externally controlled high voltage module with logging function implemented (APV3304, Techno AP Corp.). Here, the high voltage was set to 850 V. The actual applied voltage and the current with a 1 ms interval can be recorded using the logging function of the module to monitor whether gain variation of the PMT occurs, especially in high-current operation. The current amplifier, data acquisition system, and high voltage module were placed in the basement of the LHD torus hall to avoid the irradiation effect on these modules [98]. The signal of the neutron fluctuation detector was cross-calibrated with an absolutely-calibrated neutron flux monitor [72, 73].
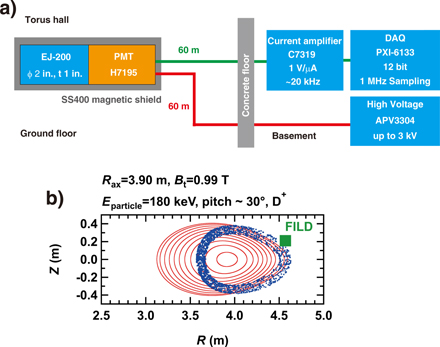
Figure 2. (a) Block diagram of the neutron fluctuation detector. (b) Poloidal cross section of the plasma, FILD head position, and Poincaré plot of a typical co-going transit beam ion orbit that can be detected by the FILD. The beam ion orbit largely deviates from the flux surface.
Download figure:
Standard image High-resolution imageThe energetic ion escape rate was measured by the FILD installed on the outboard side of the LHD plasma. Figure 2(b) shows the poloidal cross section of a plasma together with a Poincaré plot of the collisionless Larmor orbit of co-going transit beam deuterons, calculated at a magnetic axis position in a vacuum (Rax) of 3.90 m and a toroidal magnetic field strength (Bt) of 0.99 T. Here, the beam ion energy was set to 180 keV, and the pitch angle, defined as arccos(v∥/v), was set to 30 degrees, which is the typical pitch angle of tangential N-NB ions [42]. Due to significant deviation of the orbit from the flux surface toward the outboard side, the FILD could measure substantial escaping co-going transit beam ions. The FILD is classified as a magnetic spectrometer when using the LHD magnetic field. The FILD head is composed of a metal box with a double aperture structure and a ZnS:Ag scintillator plate. The double aperture limits the entry of energetic ions, and the scintillation point, due to bombardment of energetic ions on the scintillator plate, provides the energy and pitch angle of energetic ions. The scintillation image was split into two to record it with an image-intensifier complementary metal-oxide semiconductor (CMOS) camera and 4 × 4 PMTs. The detailed energy and pitch angle map was captured with the CMOS camera with a 500 Hz frame rate, whereas the detailed time evolution of the energetic ion escaping rate was acquired by the PMTs. The anode signal of the PMTs was fed into a low-impedance current amplifier (C7319, NF Corp.) operating with a 106 gain factor and 200 kHz bandwidth and acquired by a 1 MHz sampling rate data acquisition system (PXI-6133, NI Corp.). Note that the covered energy and pitch angle ranges are ∼20 keV to ∼250 keV and 15 degrees to 80 degrees. The specifications of the FILD are described in detail in reference [40].
3. Experimental results
3.1. Typical waveform of discharge
Figure 3(a) shows a typical waveform of discharge obtained under the so-called outward-shifted configuration with an Rax of 3.90 m and a Bt of 0.99 T, in a counterclockwise direction from the top view, where the strong Alfvénic instability was excited. The deuterium plasma was initiated by 56 GHz electron cyclotron resonance heating and deuterium N-NB#3 and then heated/sustained by deuterium NB#1 and NB#2. Here, N-NB#1 and N-NB#3 were co-tangential injections producing mainly co-going transit beam ions, and N-NB#2 was a counter-tangential injection producing mainly counter-going transit beam ions. The injection energy/deposition power of N-NB#1, N-NB#2, and N-NB#3 were 180 keV/2.3 MW, 163 keV/1.2 MW, and 165 keV/1.9 MW, respectively. The FIR laser interferometer results show that the line-averaged electron density rapidly increased after stopping the N-NB#3 injection, reached ∼1 × 10¹⁹ m−3, and then became almost constant until N-NB#1 stopped. Thomson scattering diagnostics show that the central electron temperature was ∼800 eV when N-NB#1 and N-NB#2 were simultaneously injected. The total neutron emission rate was ∼7 × 10¹³ n s−1. The magnetic fluctuation amplitude in the Alfvénic frequency range from 20 to 50 kHz, measured by the magnetic probe, show that strong bursting instability of 3 × 10⁻⁵ T was excited. The magnetic fluctuation spectrogram shows that the frequency of strong bursting instability was almost unchanged from t of 3.5 s to 4.7 s, where the heating condition and density range were almost constant. The zoomed-in magnetic fluctuation spectrogram shows that several frequency sweeping modes existed. The toroidal array of magnetic probes shows that the toroidal mode number (n) equal to 1. Determination of poloidal mode number (m) by poloidal array of magnetic probe is difficult, but m seems to be 1 or 2.
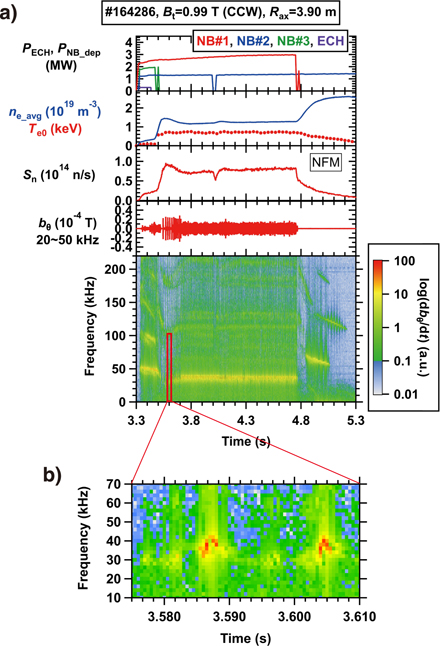
Figure 3. (a) Time evolution of deuterium plasma discharge where Alfvénic instabilities were observed. Time evolutions of injection power of ECH PECH and deposition power of NB PNB_dep (top), the line-averaged electron density and the central electron temperature (second from the top), total neutron emission rate (forth from the top), magnetic fluctuation amplitude measured by magnetic probe located on the vacuum vessel (second from the bottom), and the magnetic fluctuation spectrogram (bottom). (b) Zoomed-in figure of the magnetic fluctuation spectrogram.
Download figure:
Standard image High-resolution image3.2. Observation of Alfvénic instability
We observed line-integrated electron density fluctuations in this discharge, corresponding to this Alfvénic instability, using the FIR laser interferometer. The electron density fluctuation spectrogram of the central FIR laser channel shows Alfvénic instability composed of three frequency sweeping modes, as shown in figure 4(a). The starting frequency of each mode increased, and then the mode frequency was sweeping down. The increase of starting frequency might be due to the radial position of the mode shifted inward. The first mode might be excited in the relatively outer region of the plasma due to the steep gradient of beam ions, and then some of them were expelled due to the mode. Due to the expulsion of some beam ions existing in the outer region of the plasma, their steep gradient moved toward the inner side. The second mode might be excited in the relatively inner plasma region and expulsion of some beam ions occurred. Due to their expulsion near the second mode location, the position of the steep gradient of the beam ions moved toward the inner side. The third mode might have been excited in the inner region of the plasma. The sweeping down of the mode frequency suggested energetic ion transport in the velocity space, e.g. a clump and hole formation theory [99], as observed in TAE discharge [41]. The visualization of phase-space flow by Alfvén eigenmode reported in DIII-D tokamaks [100], represent the possibility of inward shift of the steep gradient region. Shift of the steep gradient region seems to be occurred due to this Alfvénic instability in this discharge. Note that a low-frequency MHD instability is also observed at <5 kHz. The low-frequency MHD instability might be resistive interchange mode [101] or resistive interchange turbulence [91]. The enhancement of energetic ion loss synchronized with the low-frequency mode through the non-resonant process had been observed [42], as the neoclassical tearing mode induced energetic ion loss in ASDEX-Upgrade [16]. However, in this discharge, energetic ion transport due to a low-frequency mode is not observed due to the weak amplitude of instability.

Figure 4. (a) Zoomed-in figure of the electron density spectrogram measured by the FIR laser interferometer located at an R of 4.029 m. Radial profiles of the (b) line-integrated electron density, (c) line-integrated electron density fluctuation and (d) phase obtained with accumulating nine bursts during 3.5 s to 3.7 s.
Download figure:
Standard image High-resolution imageFigures 4(b)–(d) shows radial profiles of the line-integrated electron density, line-integrated electron density fluctuation, and relative phase profile between the line-integrated electron density fluctuation and magnetic fluctuation. The vertical axis indicates the minimum normalized minor radius value (r/a99)min for each sightline. Note that a negative (r/a99)min corresponds to the inboard side of the plasma, whereas a positive (r/a99)min corresponds to the outboard side of the plasma. The line-integrated electron density shows that the profile had a peaked shape. The line-integrated electron density on the outboard side suddenly decreased due to the relatively short path length inside the plasma, as shown in figure 1(b). We chose frequencies from 27 kHz to 44 kHz to deduce the line-integrated electron density fluctuation profile because differentiation the three frequency sweeping modes is difficult. Although the line-integrated electron density fluctuation profile had a complicated structure, the profile suggested that the instabilities extended from the core to the edge region of the plasma.
The experimentally observed frequency was compared with the shear Alfvén spectra calculated by the STELGAP code [89]. Here, the three-dimensional equilibrium was reconstructed by the VMEC2000 code [102] using the VMEC2000 input produced by the TSMAP [103]. Figure 5(a) shows the radial profile of electron density measured by Thomson scattering diagnostics and the rotational transform calculated by the VMEC2000, utilized in the STELGAP code. The electron density profile was relatively flat in most parts of the plasma. The rotational transform profile was relatively flat from the center to an r/a99 of 0.7 and then monotonically increased toward the plasma edge. Figure 5(b) shows the shear Alfvén spectra for n = 1 at #164286 and a t of 3.60 s. Here, the effective charge Zeff was set to three, based on the neutron measurements in N-NB-heated deuterium plasma experiments performed with a similar density range [104]. Fully ionized carbon was assumed as an impurity. The broken lines show the initial frequency of instabilities observed in the experiment. Comparison of the observed mode frequencies with shear Alfvén spectra suggests that the observed instabilities may be classified into the GAE, located in the relatively inner region of the plasma, or the TAE with m = 1 + 2, located at an r/a99 of 0.7. The instabilities may be classified into one kind of Alfvén eigenmode avalanche [105, 106].
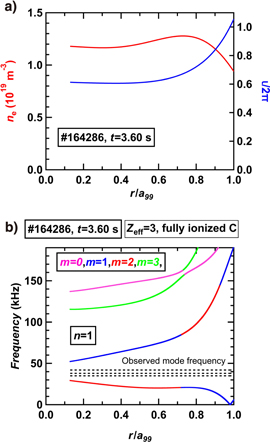
Figure 5. (a) Radial profiles of electron density based on the measurement and rotational transform, obtained with the three-dimensional equilibrium calculation VMEC2000 code, used as an input of the shear Alfvén spectra calculation STELGAP code. (b) Shear Alfvén spectra calculated by the STELGAP code for n = 1 together with the observed mode frequencies.
Download figure:
Standard image High-resolution image3.3. Observation of energetic ion transport due to Alfvénic instability
The energy and pitch angle distribution of the energetic ion escape rate to the FILD was measured in the experiments. Figure 6(a) shows a scintillation image captured by the CMOS camera and an energy and pitch angle map calculated by the NLSDESTSIM code [107]. Energetic ions with energies of ∼40 keV to 180 keV and pitch angles from ∼20 degrees to ∼30 degrees were mainly lost to the FILD position. The observed energy and pitch angle distribution of escaping ions in this experiment is similar to the distribution observed in the hydrogen experiment performed at an Rax of 3.90 m [108]. Figure 6(b) shows the time evolution of the magnetic fluctuation amplitude at the magnetic probe position in the Alfvénic frequency range, the total neutron emission rate measured by the neutron fluctuation detector, and the energetic ion escape rate to the FILD, measured with PMT channel number 10, corresponding to energies from 40 to 150 keV and a pitch angle of ∼30 degrees. The time evolution of the magnetic fluctuation shows that the mode amplitude was ∼2 × 10⁻⁵ T and the repetition frequency was approximately 60 Hz. A drop in the neutron emission rate and an increase in the energetic ion escape rate to the FILD, due to Alfvénic instability, were observed. The neutron drop rate was approximately 20%, and the increment rate of the FILD signal was approximately 50%. FILD measurements show that Alfvénic instability induced escape of energetic ions with a co-going transit orbit and an energy lower than the injection energy. The one possible reason for observing escaping beam ion loss due to Alfvénic instability at <50 keV is that the beam can fulfill sideband resonance. Here, the velocity parallel to the magnetic field of energy 50 keV and pitch angle 25 degrees deuteron is ∼1900 km s−1, which is close to the one-third of typical Alfvén velocity ∼1600 km s−1. Note that beam ions are not super Alfvénic in this experiment because velocity of 180 keV deuteron ∼4100 km s−1 is lower than typical Alfvén velocity ∼4800 km s−1. This is the first observation of simultaneous measurement of energetic ion transport and loss due to energetic-particle-driven instability in the LHD deuterium operation.

Figure 6. (a) Scintillation image due to the bombardment of escaping energetic ion flux obtained by the FILD. Violet lines show that location of the double aperture of the FILD head. The green broken circles show the area that each PMT views. (b) Time evolution of magnetic fluctuation due to Alfvénic instability, total neutron emission rate measured by the neutron fluctuation detector, and energetic ion escape rate to the FILD for PMT number 10.
Download figure:
Standard image High-resolution imageThe dependences of the drop rate of the total neutron emission rate and the increase rate of the energetic ion escape rate on the magnetic fluctuation amplitude of the Alfvénic instability were surveyed to discuss the transport/loss process [109]. At first, we performed Fourier analysis for finding coherent component between FILD and magnetic probe data [110]. However, no coherent component is observed. Then, we performed incoherent components analysis. The relation between the magnetic fluctuation amplitude of the Alfvénic instability and the decrease in the total neutron emission rate, as well as the power fitting curve without offset using the least squares method shown in figure 7(a), indicates that the decrease in the total neutron emission rate increased with the Alfvénic instability amplitude by a power of four. A power of greater than two shows very strong transport [111]. In the experiments, the Alfvénic instability was composed of multiple modes, had significant amplitude ∼bθ/Bt ∼ 3.3 × 10⁻⁵, and had a wide radial extension, and the deviation of the beam ion orbit from the flux surface was substantially large. Strong transport was observed in energetic ion loss in the Compact Helical System due to the EPM with a large amplitude in the outward-shifted configuration [112]. The other possible fitting for this plot is a linear fitting with a horizontal offset. In this case, the Alfvénic instability amplitude has a critical value for inducing measurable energetic ion transport or loss. Mode overlap might be needed to induce diffusive transport/loss of energetic ions [113]. The transport or loss mechanism will be surveyed in detail using the orbit following model DELTA5D [50]. Figure 7(b) shows the relation between the Alfvénic instability amplitude and energetic ion escape rate to the FILD. The dependence shows a loss process similar to that obtained in figure 7(a). As shown in a previous numerical study, the FILD in the LHD can provide information of co-going transit ions existing in a wide region of the torus [114]. Here, we experimentally show that the loss process of global co-going transit energetic ions obtained by neutron measurement is consistent with the loss process obtained by the FILD measurement.

Figure 7. Dependence of the (a) decrement in the total neutron emission rate and (b) increment in energetic ion escape rate to the FILD on the magnetic fluctuation amplitude of the Alfvénic instability measured by the magnetic probe located on the vacuum vessel.
Download figure:
Standard image High-resolution image
4. Summary
An energetic particle confinement study was performed using comprehensive neutron and energetic particle diagnostics e.g., neutron fluctuation detector and FILD, in the LHD. Energetic ion transport and loss due to energetic-particle-driven MHD instability were simultaneously observed for the first time in the LHD. Magnetic probes and an FIR laser interferometer observed a strong bursting mode. The comparison between the observed frequency and shear Alfvén spectra suggests that the observed instability might be classified into Alfvén eigenmode avalanches. The Alfvénic instability induced a drop in the total neutron emission rate and an increase in the energetic ion escape rate to the FILD, corresponding to the co-going passing transit beam ions. The dependences of the total neutron emission rate decrease and the energetic ion escape rate to the FILD increase with the Alfvénic instability amplitude, showing that beam ions were substantially transported due to the Alfvénic instability. The multiple modes, significant mode amplitude, wide radial extension, and large deviation of the orbit from the flux surface are the possible causes of substantial transport.
Acknowledgments
This work was supported by the NINS program of Promoting Research by Networking among Institutions (Grant Number 01411702), by NIFS Collaboration Research programs (KOAH037). This work was also partly supported by JSPS KAKENHI Grant Number C19K03798 and the Japan-Korea Fusion Collaboration Program.
Data availability statement
The LHD data can be accessed from the LHD data repository at https://lhd.nifs.ac.jp/pub/Repository_en.html.