


Abstract
A single-reservoir particle balance for the main plasma species hydrogen has been established for W7-X. This has enabled the quantitative characterization of the particle sources in the standard island divertor configuration for the first time. Findings from attached scenarios with two different island sizes with a boronized wall and turbo molecular pumping are presented. Fueling efficiencies, particle flows and source locations were measured and used to infer the total particle confinement time τp. Perturbative gas injection experiments served to measure the effective particle confinement time . Combining both confinement times provides access to the global recycling coefficient . Hydrogen particle inventories have been addressed and the knowledge of particle sources and sinks reveals the core fueling distribution and provides insight into the capability of the magnetic islands to control exhaust features. Measurements of hydrogen fueling efficiencies were sensitive to the precise fueling location and measured between 12% and 31% with the recycling fueling at the strike line modeled at only 6%, due to much higher densities. 15% of the total 5.2 × 10²² a/s recycling flow ionizes far away from the recycling surfaces in the main chamber. It was shown that 60% of recycled particles ionize above the horizontal and 18% above the vertical divertor target, while the remainder of the recycling flow ionizes above the baffle (7%). Combining these source terms with their individual fueling efficiencies resolves the core fueling distribution. Due to the higher fueling efficiency in the main chamber, up to 51% of the total 5.1 × 10²¹ s−1 core fueling particles are entering the confined plasma from the main chamber. τp values in the range of 260 ms were extracted for these discharges. Together with τp, the global recycling coefficient was resolved for every measurement and a typical value close to unity was obtained. An increase of the island size, resulted in no change of τp, but doubled , indicating the feasibility of the control coils as an actuator to control exhaust features without affecting core confinement properties.


1. Introduction
Particle control is of significant relevance for a nuclear fusion reactor as it affects a wide range of operational and safety aspects. A potentially significant restriction to next step burning plasma experiments could be caused by long-term retention of tritium inside the vacuum vessel, exceeding in-vessel inventory limits [2]. Plasma-wall interactions play a crucial role in determining the particles distribution in a future reactor, which affect core plasma confinement, in-vessel components lifetime, fuel and therefore also tritium retention [3, 4].
The superconducting stellarator Wendelstein 7-X (W7-X) was optimized to address major issues of the classical stellarator [5] and restarted operation after the assembly of 10 inertially cooled island divertor modules and a graphite heat shield [1]. The magnetic field of W7-X is designed in a way that intrinsic radial magnetic field perturbations induce large islands on low order rational surfaces [6]. The device offers a five fold symmetry with five nearly identical modules. In the standard magnetic field configuration five magnetic islands are present in the edge, with an edge ι = 5/5. Target plates are positioned at ten stellarator-symmetric locations, one upper and one lower divertor per module, to intersect and utilize the islands as the interface for plasma-facing components (PFCs), in the island divertor. Each divertor module intersects two islands, one with the vertical and one with the horizontal target. In the standard magnetic field configuration, the magnetic flux tube of the intersected island connects each lower divertor, with an upper divertor two modules further away. Therefore the lower divertor in module 1 is connected with the upper divertor in module 3 etc [7].
In this paper the in-depth quantitative evaluation for H from the second test divertor unit (TDU) campaign at W7-X, operation phase 1.2b (OP1.2b) [1] after boronization and reduction of the oxygen content, will be shown. The pumping of the graphite divertor was done via turbo molecular vacuum pumps. The experimental set-up of the analyzed W7-X discharges are described, focusing on the effects of the island topology on particle confinement, fueling, and recycling as determined by the particle balance.
This study is an effort towards exploring the particle fueling, exhaust, and recycling of W7-X operating with the island divertor. The impact of the island geometry on particle confinement and the exhaust properties from a plasma edge and divertor perspective are simultaneously presented. This was assessed in two ways: first, a global, single-reservoir particle balance for the main ion species hydrogen (H) was established, and enabled the quantitative characterization of the particle sources at W7-X. Due to the 3D topology of W7-X and the island divertor, this task is more complicated compared to most tokamaks, as assumptions about axisymmetry are not valid. However, it was still possible to analyze particle and effective particle confinement times using methods outlined in [8]: the particle confinement time τp for H was determined by linking the line integrated density to the refueling particle sources. Second, the density decay time of a moderately perturbative gas injection was analyzed to measure the effective confinement time of H.

This paper is organized as follows:
- Section 2: the key diagnostics that were used to measure density, gas flows, photon flows of H transitions through multiple camera systems and other spectroscopic observations necessary to evaluate the total wall source are introduced.
- Section 3: a methodical introduction of the global, single-reservoir particle balance. A detailed explanation of how the individual terms of the particle balance and their uncertainties are calculated is presented.
- Section 4: results of the analysis of the particle balance are discussed. An introduction to the analyzed discharges is given, followed by a comparison of different fueling efficiencies. Subsequently, the τp calculations of the particle balance are compared with measurements. The effect of a larger island size will be discussed in regards to the neutral particle flow distribution.
- Section 5: conclusion. An increase of the island size, from control coil current 0 kA to 2 kA, resulted in no change of τp but doubled . The increase of the island size shifted the ionization location of 5% of the recycling flow, from the divertor to the main chamber, indicating the feasibility of the control coils as an actuator for stable divertor operation.


1.1. Modulation of the divertor island at W7-X
Each divertor module is equipped with a control coil that can be used to modify the island geometry and serves as a control parameter to optimize divertor performance [9]. In this study the normal island size without an applied control coil current (Icc = 0 kA), is compared with a larger island, generated by a control coil current of Icc = 2 kA. The effects can be explained along figure 1. Here the CAD geometry of a divertor module and its surrounding PFCs is overlaid with a Poincaré plot in red. The five edge islands can be seen, with the vertical and horizontal target intersecting two of them. The resulting strike line is shown in blue.

Figure 1. CAD geometry of a divertor module and the PFCs in grey, overlaid with a Poincaré plot in red, and the resulting strike line in blue. Normal island size is shown in (a), with the large island size shown in (b).
Download figure:
Standard image High-resolution imageThree main effects of the change in island structure on neutralization, neutral transport, and ionization can be observed. The most intuitive reason for a change in the exhaust properties is the shift of the strike line. With the larger island, the strike line is shifted 5.9 cm closer to the pump gap in between the two target plates, which reduces the distance from pump gap to strike line from 12.1 cm for the normal island, to 6.2 cm for the large island case. Additionally the connection length close to the strike line decreases by a factor of two with the increase in control coil current. Magnetic connection lengths in the private flux region are reduced from 170 m for the normal island size to 60 m for the large island size, and from 520 m to 260 m in the scrape off layer (SOL), which could result in reduced perpendicular ion losses due to the shorter pathway into the divertor. Finally the island width grows, increasing the distance between last closed flux surface (LCFS) to target surface at the O-point, from 6.5 cm for Icc = 0 kA to 10.2 cm with Icc = 2 kA, which could have an impact on neutral trapping in the island. These and other effects of changes of the island size are discussed in more detail in [9].
2. Available key diagnostics
Overview of the key diagnostics relevant for the particle balance and related analysis is given in this section. The interferometer, with the line integrated electron density will be introduced first as the central measurement for the single-reservoir particle balance in section 3. It is followed by the two different gas fueling systems available at W7-X, which form the external sources. Diagnostics for SOL temperature and density measurements, which are necessary for the determination of the inverse photon-efficiencies for Hα emission, S/XB values, used in subsection 3.3, are presented. Lastly, the filtered visible cameras used to measure the integrated Hα photon flows on the PFCs, necessary to determine the neutral wall source, will be discussed.

2.1. Integral electron density dispersion interferometer
The integral electron density dispersion interferometer (IEDDI) is the key diagnostic for measuring the line integrated electron density [10, 11]. The one channel of the IEDDI is positioned in module 3 at W7-X and has a beam path length through the plasma of 1.33 m where electron densities between 1017 m−3 and 1021 m−3 can be measured at up to 50 kHz resulting in a time resolution of up to 20 μs [12].
We know from calibration measurements, that the phase dependent shift of the density around the true density is between 3–6 × 10¹⁸ m−2, which is about 10% of typical densities. Given that this is an order of magnitude above the noise level, this is assumed as the general uncertainty [12].
2.2. Main gas injection system
The main gas system at W7-X consists of one H and one He valve in the same stellarator symmetric port of each of the 5 modules of W7-X. A fast gas injection system based on Piezo valves is used at the inner mid-plane on the high field side (HFS) in each module to control the injection of He and H2 flows between 0.1 and 10 mbarl s−1, or 4.9 × 10¹⁸ and 4.9 × 10²⁰ H atoms per second [13]. Since the valves are located 177.5 cm away from the PFC, the effective reaction time is rather slow for control purposes, but of course allows short valve openings for perturbative injections. The neutral cloud reaching the plasma edge has at least the width of the opening in the steel panel PFC with a radius of 66.5 mm, while the port the gas is injected in has a larger radius of 94.5 mm. The systematic calibration uncertainty is listed with ±17% while the standard deviation of a set of gas injections with the same input parameters is only ±3%. The total measurement uncertainty is therefore assumed to be ±20%.
2.3. Divertor gas injection/thermal helium beam diagnostic
The second gas injection system is also part of the He beam diagnostic, which can inject both trace amounts of gas for plasma parameter measurements as well as larger amounts for fueling experiments [14]. The gas injection system consists of two gas injection boxes, one at the upper divertor in half module (HM) 51 and one at the lower divertor in HM30. Each box is equipped with five independent Piezo valves arranged poloidally in the horizontal divertor target (h-div) with a response time of around 6 ms between input signal and valve opening [15]. The five nozzles of the gas box are fed by a common gas-reservoir which is filled to a desired pressure pdiv-gas before each discharge. Gas flows for H of up to 3.6 × 10¹⁹ atoms s−1 are possible at pdiv-gas of 10 bar. The gas flow measurement through the valve opening time is only possible for fully opened valves, as was typical in feed forward operation. It has a high time resolution of 1000 Hz but a large uncertainty in gas flow between ±30% and ±50%, depending on gas type and pdiv-gas. The gas flow measurement through the ideal gas law by monitoring the pressure drop in pdiv-gas offers a much lower systematical uncertainty of ±5% as well as a negligible random error, confirmed by multiple pressure readings before and after an injection. However the time resolution is much lower at 1 Hz.
During operation HM51 was commonly used for gas injection fueling while HM30 was used for the thermal He beam diagnostic to measure Te and ne [14, 16]. Radial profiles from 1.5 cm up to 14 cm above the h-div, with a spatial resolution between 2–3 mm can be acquired. The uncertainty of the density measurement is assumed to be ±10%, while the temperature uncertainty is higher at ±30%.
2.4. Langmuir probe arrays
At W7-X, there are two identical Langmuir probe arrays in the upper and the lower divertor in module 5 that measure the electron temperature, electron density, and electric potential of the plasma. There are 20 graphite probe tips embedded in the TDU in four groups, forming two rows in the low iota part of horizontal target, embedded in target elements 3 and 4. In the standard configuration the Langmuir probe rows reach the edge of the strike line and can partially monitor it. The probes are swept with 500 Hz sinusoidally for Te, ne, Vf, with data being recorded continuously throughout discharges. The exact uncertainties are provided with the calibrated data and are usually within ±10% for density and ±20% for temperature measurements [17].
2.5. Multi purpose manipulator
The multi purpose manipulator (MPM) is a versatile plunge system mounted at the outer mid-plane at W7-X in module 4 [18]. The MPM can perform fast plunges with an acceleration of up to 30 m s−2 of up to 350 mm into the plasma. The island chain and the LCFS can be crossed in all magnetic configurations, but it is not typically done due to negative side effects for the plasma [19].
The system can be equipped with currently ten different probe heads for a variety of different diagnostics as well as gas injections. Most probe heads are equipped with a Langmuir probe set up. During the plunge the probe head continuously takes Te and ne measurements creating a profile from about 150 mm from the PFC to about 200 mm. In the scenarios discussed in this study the LCFS is 227 mm in front of the PFC at the MPM location. The profiles are assumed to be representative for the conditions at the steel panel and heat shield PFC.
The systematic uncertainty depends on assumptions about Maxwellian distribution, assuming Zeff = 1, and no interference between different probes on a probe head as all probes are exposed to the same plasma. These assumptions are difficult to test. The signal to noise ratio was found to be below 10% resulting in a total uncertainty estimate for ΔTe = 20% and Δne = 30% [18].
2.6. Interference-filtered 2D cameras in the visible range
Each divertor module at W7-X is monitored by a set of two visible cameras. Both visible cameras are mounted in an immersion tube, together with an IR camera [20]. Each visible camera is equipped with a narrow band pass filter for representative optical transitions of the main species H and C present in W7-X. The cameras have been corrected for distortions in the camera and lens assembly and were radiometrically calibrated [21]. The image can be separated into different regions of interest (ROI), and the photon fluxes can be integrated over those areas. The photon fluxes have been corrected for optical and geometric factors and have been validated in a cross calibration with multiple other diagnostics [22].
The mounting position of the cameras can be seen in a photo of the interior of one module in figure 2. The set of three vacuum windows for the three cameras can be seen in each immersion tube. Their field of view (FoV) is sketched with orange lines. The cameras on the left side are focused on the lower divertor while the ones on the right observe the upper divertor. Both FoV overlap on the heat shield. The consequences for the calculations of the entire photon flow on the heat shield as well as some line of sight (LoS) effects are discussed in section 3.3 and refer appendix

Figure 2. Wide angle picture of one module at W7-X. The immersion tubes with the three windows for the three cameras can be seen with a sketched FoV in orange. The cameras on the left are focused on the lower divertor region while the ones on the right observe the upper divertor.
Download figure:
Standard image High-resolution imageEach half-module is equipped with a narrow band pass filter for Hα (656.3 nm @ 2 nm FWHM) and one additional filter for the other camera. Both cameras in module 31 have an Hα filter as a stereoscopic view, Hγ (434.1 nm @ 2 nm FWHM) filters are installed in half module 10 and 21, as well as C-II (514.3 nm @ 2 nm FWHM) in 40 and 41, and C-III (465.4 nm @ 2 nm FWHM) in 11 and 20. The Hα filter in HM50 was outside of the specifications and was contaminated by a neighboring C-II line at 658 nm. This camera is therefore neglected and instead an average of the other 9 cameras will be used.
The plasma vessel of W7-X is equipped with a variety of plasma facing components (PFCs). For this analysis the PFCs are separated in five different types. These are shown for one half module in figure 3(a). The PFCs will be introduced in order of their designed maximum heat flux capability: the divertor (1–10 MW m−2), the baffle (500 kW m−2), the heat shield (300–500 kW m−2), and the steel wall panels (200 kW m−2). The horizontal and vertical divertor targets are shown in light blue with the pumping gap, shown in yellow, in between. The divertor is complemented by the baffle which consists of graphite tiles. A majority of the inboard side and other areas that are predicted to be exposed to significant heat loads are covered by the graphite heat shield. The other areas with low heat fluxes are covered with steel panels [23].

Figure 3. (a) CAD drawing of the PFCs around one divertor element. (b) FoV of the filtered visible cameras superimposed with an Hα photon flow measurement. The ROI are color coded for the heat shield (gray), baffle (orange), horizontal (green), and vertical (red) divertor target.
Download figure:
Standard image High-resolution imageA scene model is used to connect individual pixels with their appropriate machine coordinates, as well as their associated PFCs [21]. For the particle balance the photon flux is integrated over four different ROIs, notably the horizontal and vertical target, heat shield, and baffle as pictured in figure 3(b). The CAD model shown in (a) is superimposed with a frame of an Hα
measurement, revealing the photon flow along the strike lines on the target, further details in appendix
3. Introduction to a global, single-reservoir particle balance
Initial determination of τp experimentally is provided by the means of a single-reservoir particle balance. In a single-reservoir balance the change in total number of confined ionized particles is determined by the external particle sources and the outflow, which is defined by the ratio of the total number of particles Ntot and a particle confinement time τp in a simple differential equation:


The external sources considered in this study are the two different gas fueling systems outlined in section 2 as well as the ionization of the neutral recycling source. Since diagnostics like the interferometer measure the electron density, the particle balance is actually a sum of confined electrons. This is valid when we assume quasi neutrality for the plasma. Therefore all particle flows are converted into electrons per second. Such 0D single-reservoir models are commonly used [24–26] and include multiple sources, the details and strength of which are device dependent. A typical particle balance for a device with a variety of fueling systems would look like this:

In this example there are terms for three external hydrogenic fueling systems: gas injection, pellet, and NBI as they are commonly found on fusion devices. Each term consisting of the particle flow Γsource(t) and a fueling efficiency fsource. The fueling efficiency is the chance of a particle to become part of the confined plasma, as described in more detail in section 3.2.
Another important but considerably complex particle source is the fuel recycle process, where an incoming ion strikes a recycling surface and is released as a neutral particle. The ion may be energetically back-scattered as a neutral or be absorbed, subsequently combining with a second atom from the surface reservoir, and thermally released as a molecule [8, p 39] (figure 4).

Figure 4. Illustration of the fuel recycle process on the horizontal target. The incoming ion flow Γion neutralizes on the recycling surface, the h-div. A portion of the resulting neutrals is pumped, Γpumped, while the fraction that re-ionizes is called the recycling flow Γrecy. The recycling particles can undergo significant neutral transport between the recycling surface and their point of ionization, in both poloidal as well as toroidal direction. Hα radiation can be used as a proxy for the ionization of particles.
Download figure:
Standard image High-resolution imageThe incoming ions form the ion flow Γion impinging on a recycling surface, i.e. a limiter or divertor target plate. The resulting neutrals can either be pumped Γpumped, by active or wall pumping, or re-ionize. The fraction of neutrals that re-ionize is called the recycling flow Γrecy which originates on the recycling surface until it is ionized. The atomic and molecular composition of the recycling flow is dependent on the surface temperature. For graphite PFC's at colder surfaces between 570 K and 1100 K the recycling flow is composed of roughly 90% molecules and 10% atoms [27], which is within the range of W7-X in attached and ionizing conditions. The point of ionization is not locally bound to the recycling surface, as part of the recycling flow might undergo significant neutral transport before it is finally ionized. The neutral density is highest near the recycling surface, but finite neutral fluxes at lower intensities, also strike distant PFCs due to wall reflections, charge-exchange collisions and Franck–Condon processes [8, 28, 29]. Just like particle flows from gas injections, there is a certain probability for the recycling flow to re-enter the confined plasma, which is quantified through the recycling fueling efficiency frecy. This chance is much higher in a limiter configuration, where the recycling surface, is in direct contact with the confined plasma. In a divertor configuration where the targets are more remote to the confined plasma, the chances for the recycling flow to ionize in the SOL and the private plasma tend to be much higher. This can be anywhere between two extreme scenarios: at the first extreme is an SOL that is mostly transparent for neutrals, with the majority of the ionization occurring in the confined plasma. At the other end, there is the high recycling regime where most of the ionization occurs near the divertor targets, outside of the LCFS. The recycling can be expressed through the ion flux Γion impinging on the recycling surface and the global recycling coefficient [8]:


Assuming an unchanging neutral reservoir in equilibrium, the ion flow can be described as:


The wall source was split, based on the present PFCs, into five different areas: h-div, vertical divertor target (v-div), baffle surrounding the divertor, the heat shield (shield) made of carbon tiles on the HFS, and steel panels (steel) covering the vessel walls at the low field side (LFS). For this study the pellet and NBI system were not used during plasma operation and are therefore not included here. However the main gas injection system (main-gas) and the divertor gas injection system (div-gas) are treated separately.
Adjusting equation (2) for these conditions, τp can be expressed as

with the wall flow, consisting of the wall source Γwall, being

The individual inputs to the particle balance, their origin and uncertainty will be discussed in greater detail in the following subsections 3.1–3.3. The uncertainties of measurements have been discussed when the dedicated diagnostics were introduced in section 2. It is assumed that all terms are governed by independent uncertainties and hence a Gaussian propagation of these uncertainties has been used. A thorough separation of the systematic and statistical uncertainty is currently not feasible and therefore all given uncertainties represent the total uncertainty. However, as the total uncertainty is dominated by systematic uncertainties rather than statistical ones, a relative comparison of the same parameter even within the given uncertainty is valid. A sensitivity study regarding different factors of Γwall and frecy was conducted and the results are presented in appendix
3.1. Total amount of particles Ntot
One of the key components to the particle balance is the total number of confined particles Ntot as well as its derivative. Ntot is being calculated from the line averaged plasma density and the plasma volume Vplasma. The density is measured as a line averaged value by the interferometer (section 2) while the plasma volume is calculated by the Variational Moments Equilibrium Code—VMEC [30]. The VMEC solves the ideal magnetohydrodynamic force balance in a three-dimensional geometry. The numerical procedure of the code assumes that flux surfaces exist as a set of nested surfaces between the magnetic axis and the LCFS. For this reason effects in the SOL and also the islands cannot be solved. The volume that is enclosed by the LCFS is used as the plasma volume Vplasma. Changes in volume due to increase in plasma pressure within a configuration are small and within the given uncertainty


and the uncertainty as

with the plasma volume for the standard magnetic field configuration of W7-X:

The confined plasma volume as determined from VMEC does not change when a control coil current of Icc = 2 kA is applied.
3.2. Fueling efficiencies
Only a fraction of particles released by the fueling systems reach the confined plasma domain and therefore need to be considered in the particle balance. Neutral particles might be dissociated and ionized within the SOL, or be pumped out rather than getting ionized, either by active pumping or by wall absorption. Therefore, each source term is multiplied by its corresponding fueling efficiency, which is defined as the fraction of injected particles that become part of the confined plasma, measured as the change in Ntot, over the injected number of electrons . For the gas injection systems the difference in density was determined from the density after a short gas puff, and the density just before the puff , as shown as an example in the electron density signal in figure 5.


Figure 5. Line averaged electron density as a function of time for program ID: 20181010.010. The density response to gas injections at 3.0 s, 3.5 s, 4.0 s, 5.0 s, and 6.5 s are visible. Points and for each gas injection used for fueling efficiency measurements are labeled.


Download figure:
Standard image High-resolution imageThe fueling efficiency of a particle source can be mathematically represented as:

and the uncertainty as

It is possible to utilize cameras with hydrogen line emission filters and separate the emission inside and outside of the LCFS to determine the fueling efficiency of the neutral wall source from recycling—frecy. This requires tangential views which capture the entire emission of the neutral edge reservoir, such that the actual particle source can be determined. However, these tangential views are currently not available at W7-X, and other methods have to be used.
In previous studies on other devices frecy was often either assumed to be similar to gas injections [31, 32], or calculated with a simplified SOL model where the ionization degree of a neutral source is calculated as it penetrates a fixed width SOL with homogeneous temperature and density [33–35] resulting in values between 0.1 and 0.3 depending on the assumptions about the atomic and molecular contributions, as well as the dominating molecular dissociation and ionization paths. At the large helical device it was found that, based on a simplified homogeneous SOL model, the fast atomic contribution of the recycling flow fuels about three times more efficient as the molecules [35].
For global value of , a time dependent version of equation (11) was used to analyze the plasma build up at the beginning of a discharge, using the number of recycling electrons instead of , resulting in:


and the uncertainty

However this equation only provides meaningful results during the plasma start up, when density and the recycling flow are still evolving, as it goes to zero once a stable density, , is reached. Therefore, this method is not suitable to determine frecy in detached phases that evolve at a later part of a discharge. It also only provides one global value, whereas the fueling efficiency differs locally due to variations in edge densities of i.e. the divertor region compared to the HFS heat shield or LFS steel panels. The higher the SOL density under ionising conditions, the higher the probability of neutrals to ionize within it and therefore decreases the probability of neutrals reaching the core confined region. As the natural density is not fully established at the time of measurement, this value overestimates the fueling efficiency and can therefore only be used as a maximum possible global value.

Gas injections on the other hand can be done at any time during a discharge and are currently possible through three different systems at W7-X (section 2), offering a great flexibility of measurements in time and space. Gas injections can be used as an experimental proxy for the recycling fueling efficiency at the injection location, as they are less prone to 'somewhat arbitrary assumptions' [34] when instead relying on SOL modeling, as all the complex loss terms are taken into account empirically.
While the recycling flux in front of graphite is composed of around 10% atoms and 90% molecules [27], the composition of a gas injection is purely molecular. The energetically back scattered atoms are fast, but the molecular velocities differ only slightly. While the recycling neutrals have thermal energies of the wall temperature, the injected gas is at the temperature of the gas reservoir, typically at room temperature, but gains additional velocity through the gas injection itself. Therefore both, the recycled and injected, molecular particle flows are at very similar slow thermal velocities. The fueling efficiency of a gas injection is consequently the best available experimental proxy for the recycling flow fueling efficiency at W7-X during stable densities. However due to the fast atoms in the recycling flux, the fueling efficiency of a gas injection will always underestimate frecy. To take the atomic contribution of at least 10% [27] with a three times higher fueling efficiency [35] into account, the fueling efficiency of the purely molecular gas flow is multiplied by a correction factor.


Due to the versatile advantages of the gas injection method as a proxy and enabling direct comparisons with detached scenarios in the future, this method will be used for the determination of frecy, while the time dependent solution during start up is used as an upper maximum sanity check, . The experimental results of the fueling efficiencies will be discussed in sections 4.1 and 4.2.

3.3. Γwall a recycling dominated source term
A most critical contributor to the particle balance is the neutral particle flow of the wall, Γwall. Γwall is in general determined via optical emission spectroscopy on hydrogen atoms observing e.g. the most strong line emission in the visible range—Balmer-alpha (Hα ). The photon flow can be interpreted as the total flow of neutrals ionizing in the plasma by the use of effective S/XB coefficients, which will be discussed in the next subsection


The location of therefore resembles the point where the neutral flow ionizes, but depending on the mean free path and neutral transport not necessarily the recycling surface [8]. Although it is seen from modeling in appendix

Therefore great care must be taken if one wants to derive a statement on the incoming ion flux based on these measurements, which might not always be possible without extensive modeling. The photon flow multiplied with the effective photon efficiency, is an indirect measurement of the ionizing neutrals along the LoS above the observed surface and provides therefore, combined with the appropriate fueling efficiency, a particle source term for the particle balance. The locations of the recycling flow given in this paper is the location where the recycling flow ionizes. It is accounted to the PFCs on which the LoS ends, as these are typically the closest surfaces to the ionization event. EMC3-EIRENE modeling of the distribution along these LoS is presented later in this section and is used for a LoS correction.


A certain fraction of the impinging ions is absorbed or implanted in the surface. Absorption is at the top surface by bonding to free atomic or molecular bonds in the lattice and implantation is deeper in the material and depends on the impact energy. The first wall is effectively absorbing, if free bonds at the surface are given which can be approximated by surface content related to mono-layers. Supersaturation can happen at the divertor surface causing transiently overloading of the surface under plasma load. The surface desorbs hydrogen after the plasma pulse and releases atoms and molecules from the surface. This is often described as short-term retention with access to the hydrogen reservoir. In contrast long-term retention is determine by co-deposition and deep implantation and remains in the PFC as so called immobile inventory.
To find out whether the wall is releasing or pumping particles, one has to consider the gas balance [37]. Principally, the determined particle flux based on photon flux measurements does not distinguish between a recycling, or a desorbing neutral. It simply measures the presence of radiating neutral particles along the LoS. If particles are not fueled externally, or originate from wall desorption, they must be a recycling particle. For the discharges investigated here, the gas balance analysis method described in [37], showed that the wall pumping flow was negligible compared to the recycling flow. The neutral particle flow from the wall Γwall can therefore be assumed equal to the recycling flow Γrecy in this scenario.
3.3.1. S/XB—inverse photon efficiency
Passive spectroscopy is a standard approach to infer particle flows Γ, that are required to generated measured photon flows Φ. Under ionising plasma conditions, the corresponding photon flow Φ can be converted into a particle flow Γ with the aid of effective inverse photon efficiencies—so-called S/XB values. The values represent effectively the competition between ioniSation and eXcitation of a given electronic transition related to the branching ratio. Many rate coefficients and processes are included in the term 'effective', though the pure term is an atomic quantity for a given set of plasma conditions ne and Te [38]. The atomic particle flows ΓA can be inferred from the photon flow ϕA of observed electron transitions of the atom by utilizing S/XB coefficients, whose accuracy depends on the knowledge of the local plasma parameters and the appropriate atomic data [38–40]

While the molecular particle flux can be inferred in a similar manner with D/XB coefficients and molecular Fulcher band emissions, it is possible to determine the total hydrogen particle flow from the Balmer-α line emission by using an empirically determined effective (S/XB)eff [27]


In this study four different ways to determine (S/XB)eff have been analyzed, described in appendix

was used for the horizontal and vertical divertor targets and baffle, while

was used for the heat shield, and steel panels, where much lower ne and Te are observed.
3.3.2. Photon flow from filtered visible cameras
Hα
cameras are positioned in nine of the ten modules at W7-X, the average of the nine cameras is used to take into account the camera missing in half module 50, as discussed in section 2. This allows a direct surveillance of 9 full divertor modules including both targets, the baffle, as well as 77% of the heat shield surface, and can therefore capture most 3D effects i.e. error fields or up/down asymmetries due to drifts. The camera signals are evaluated on the different ROIs of the PFCs as shown in figure 3 and are provided as integrated photon flows over the particular ROI for horizontal and v-div, baffle and heat shield, but not the steel panels on the LFS due to significant reflections caused by the tangential view and the reflective steel surface. This large surveillance area means that the gas injections are also captured in the camera images. To avoid double counting, these injected particles are subtracted from the wall particle flow. While the cameras view almost perpendicularly onto the divertor targets, this is not the case for any point on the heat shield. A shallow incidence angle onto the surface could lead to an overestimated measurement, since the LoS length in the SOL is increased. This effect is shown to be negligible in a sensitivity study in appendix
Table 1. Surface areas, effective S/XB values for attached conditions, and heat load specifications of the different PFCs [23, 41].
| PFC | Area (m2) | S/XBeff | Average heat load (MW m−2) | Local heat load (MW m−2) |
|---|---|---|---|---|
| Total divertor | 25 | 34 ± 2.3 | 0.50–3.00 | 1.00–10.00 |
| Horizontal target | 19.2 | 34 ± 2.3 | 0.50–3.00 | 1.00–10.00 |
| Vertical target | 5.8 | 34 ± 2.3 | 3.00 | 10.00 |
| Baffle | 33 | 34 ± 2.3 | 0.25 | 0.50 |
| Heat shield | 47 | 14 ± 3.1 | 0.15–0.25 | 0.30–0.50 |
| Steel panels | 62.3 | 14 ± 3.1 | 0.10 | 0.20 |
![$[{\mathbf{\Gamma }}_{\mathbf{H}}^{\mathbf{tot}}/{\mathbf{\Phi }}_{{\mathbf{H}}_{\mathbf{\alpha }}}]$](https://content.cld.iop.org/journals/0029-5515/62/3/036023/revision3/nfac4acbieqn28.gif)
Another LoS effect is that the LoS penetrates the SOL twice: once right in front of the camera lens on the outboard side, and once on the inboard side above the observed PFC. This would result in double counting of photons, as the photons on the outboard side are already considered in the steel panel flow. Therefore a synthetic diagnostic in EMC3-EIRENE modeling was used to analyze the intensity distribution along six exemplary LoS [42]. The boundary conditions for the modeling used were hydrogen plasma with carbon as the only impurity species at a total heating power of 4.5 MW and a radiated power of carbon of 1 MW. Cross-field particle diffusivity of 0.5 m2 s−1 for both, hydrogen and carbon ions, with a cross-field heat conductivity for both electrons and ions of 0.75 m2 s−1. The total recycling flow was varied between 9.36 × 10²² atoms s−1 and 1.15 × 10²³ atoms s−1 as a sensitivity test. Hα is emitted by excited neutral hydrogen which may originate from multiple atomic/molecular processes [36, 43]. The heat shield and stainless steel surfaces are not included as PFCs in the modeling. The modeled Hα intensity distribution along the LoS from the camera onto the strike line on the horizontal target is plotted in figure 6 where atomic excitation is found to be the dominant Hα emission mechanism. The excitation processes and contributions to the Hα emission are labeled according to the original hydrogen state. The photon flux peaks right above the target at the end of the LoS and then decays quickly. On the scale of the inboard radiation on the strike line, outboard side radiation is negligible to the total signal.


Figure 6. Hα intensity along the LoS from the camera onto the strike line on the horizontal target. The different atomic and molecular contributions are color coded, with the total Hα photon flux shown in purple.
Download figure:
Standard image High-resolution imageHowever when looking at a LoS that ends on the heat shield, the distribution changes significantly, as shown in figure 7. While the atomic excitation is still the main contributor to the Hα emission, the scale of the emission is decreased by three orders of magnitude and the outboard side now contributes 39% of the total photon flux. Accounting the entire measured signal to only the heat shield would result in a large overestimation of the heat shield contribution, as only 61% of the signal stems from the inboard side above the heat shield. Additionally the emission peaks further away from the PFC and deeper in the confined plasma, in comparison with the strike line on the horizontal target in figure 6.

Figure 7. Hα intensity along the LoS from the camera onto a point on the heat shield. The different atomic and molecular contributions are color coded, with the total Hα photon flux shown in purple. Scale is three orders of magnitude different to 6.
Download figure:
Standard image High-resolution imageWhile the distribution along the LoS changes significantly between and along the surfaces of the different PFCs, the absolute number of photons on the outboard side stays relatively constant, as all LoS penetrate the same region of the outboard SOL in front of the camera. The outboard side fraction of Hα emission provided by EMC3-EIRENE of the absolute measured photon flux integrated over the different PFCs is between 4.2–8.9 × 10 + 18 photons/m2s. 39% of the photon flux from the heat shield and 23% of the unloaded baffle photon flux is seen as the outboard side contribution. These fractions of the measured photon flux are very similar as the densities in front of the camera are assumed homogeneous and an average of the outboard heat shield and outboard baffle photon flux is subtracted of all camera data. While the peak emission on the divertor targets as well as the baffle is close to the PFC, the peak emission for the heat shield as well as the steel panel LoS move further inward. EMC3-Eirene modeling suggests that local recycling processes on the heat shield do not contribute significantly to the signal measured along the LoS [36]. This is expected also for the stainless steel panels, which are located even farther away from the plasma. Instead, it is believed that the majority of the signal results from neutrals that escape the divertor/baffle region. Therefore the emission cannot directly be connected with those PFCs, which is why the recycling flow ionizing above the heat shield inferred from Φshield will be allocated to the HFS in the main chamber as , and Φshield will be allocated to the LFS in the main chamber as . This is to prevent the false conclusion that the heat shield or steel panels are recycling surfaces. Since the integrated photon flux for each camera and PFC area is given in [1/(s sr)] and calibrated over the solid angle steradian, the total photon flow for the horizontal and vertical divertor as well as the baffle is calculated as:


and the uncertainty as

Here the total photon flow ϕphoton is the sum of the integrated photon flux Hα of each of the nine cameras multiplied by 4π to account for the steradian and the photons that are being emitted in other directions and therefore cannot be measured by the camera. The fraction takes into account the module without camera observation, see section 2. Since 77% of the heat shield is observed, the rest is approximated by an average flux from the observed area:


and the uncertainty as

3.3.3. Photon flux from filterscope channels
Unlike the cameras that observe a large area, each filterscope (FS) channel only observes a small spot size of 5 cm in diameter [44]. Due to this, it is a highly localized measurement and can be effected by local conditions, i.e. gas injection close to the area of observation which might cause emissions that are not representative for the photon emissions of the recycling flow. Therefore the filterscope measurement is also more prone to 3D effects like up/down asymmetries. As the total particle flow on the steel panels is rather small, these uncertainties only have a small influence on the total particle balance. The LoS distribution for the FS channels is assumed to be comparable with the camera LoS on the heat shield, just now looking from the inboard side almost perpendicular onto the steel panels on the outboard side. Therefore the inboard side contribution is determined and subtracted in a similar way as was done for the cameras.
Four channels that view the steel panels were identified that all show comparable photon fluxes and are therefore assumed to serve as a good representation for all steel panels. An average of all four channels is taken and scaled to the surface area of all steel panels with a combined uncertainty of 3.25%

and the uncertainty as

3.4. Effective confinement time and


Compared to the τp measurement described in section 3, the measurement of the effective confinement time is much simpler. is the decay time of a global particle-confinement related quantity rather than the confinement time of an individual particle τp and describes the global effective particle dwell time in the system. As a global measurement, it cannot be used to resolve local effects that arise through the 3D system at W7-X, but it stands as an effective system confinement time that defines recycling and density control [45]. Based on gas balance results, the wall absorbs or desorbs particles on the order of 1% of the total recycling flow and is therefore seen as negligible, as shown in figure 11 [37]. Under this assumption, external fueling is the only way to achieve a constant plasma density in an actively pumped system. If one turns off all external fueling, will decay with a measured decay time [8, section 4.6.3]


In practice, perturbative gas injections are commonly used, and an exponential decay function is fitted to the following density-related decay signal with [32, 45, 46]:

And the effective confinement time can therefore be described as

For the main plasma species H, the effective confinement time is commonly determined by fitting the decay of the electron density. However this only applies to the main species at low impurity concentrations where . Partial neutral pressures of H are also available in three poloidal locations through the Wisconsin in situ penning gauges and can be used for a neutral effective confinement time [47].

When looking at the main plasma species, equation (34) can be combined with equation (29). The change in line integrated density can then be described as:


and since

we obtain [8]:

or:

and

According to these equations a very long or no decay, , leads to , therefore 100% recycling, while about equal to τp, would correspond to very powerful pumping without any recycling [8].


4. Experimental results
The results of particle balances in W7-X, introduced in section 3, are presented here. First fueling efficiencies for gas injections as well as recycling particles will be discussed, and subsequently, the particle balance solved for τp. The sensitivity of τp to three different inputs is discussed in appendix
The first goal was to determine the fueling efficiencies of the two gas injection systems. The fueling efficiencies were measured by short gas injections introducing known number of particles as described in subsection 3.2. The gas injections lead to a sudden increase in density. The decay of the density signal was used to determine so that the global recycling coefficient could be calculated together with τp from the particle balance.


The conducted discharges are introduced on the example of program ID 20181010.010 shown in figure 8. The ECR heating power was set to 4.5 MW with the core density in the mid 1019 m−3 for 7 s. The radiated power Prad remained stable at 0.75 MW resulting in a radiated power fraction of 17%. After the first second of plasma ramp up, two seconds of flat top density are followed by three gas injections of different size through the divertor gas box at 3.0 s, 3.5 s, and 4.0 s, with half a second in between for measurements. One second after the last injection from the divertor gas box, two injections from the main gas system were executed at t = 5.0 s and t = 6.5 s.


Figure 8. Discharge parameters for a studied discharge in attached standard divertor configuration (program ID: 20181010.010). Power time traces for PECRH input power and radiated power Prad are shown in the top. Line averaged density (blue) and gas injections from two different systems (red) are shown below (re-plotted from figure 5). The pre-fill from the main gas system just before 0.0 s as well as perturbative gas injections are visible at 3.0 s, 3.5 s, 4.0 s, 5.0 s, and 6.5 s.
Download figure:
Standard image High-resolution imageThese experiments were conducted in the standard divertor configuration with the normal island size without any control coil current (Icc = 0 kA) and with large islands, with Icc = 2 kA, to study the effects of this manipulation of the divertor field topology. The divertors were pumped with turbo-molecular-pumps and all experiments described were done with a boronized wall.
The analysis for H focuses on a set of five discharges, one reference discharge (program ID: 20181010.008), two with normal island size (program ID: 20181010.010 & 20181010.017), and two with a large island (program ID: 20181010.011 & 20181010.018). Program ID 10 and 11 of that day experienced a rise in density throughout the discharge, while the density for ID 17 and 18 was consistently held stable at 5.8 × 10¹⁹ m−3 via feedback control (table 2).
Table 2. Discharge overview.
| Program ID | PECRH | Icc | |
|---|---|---|---|
| 20181010.008 | 4.5 MW | 5.0 × 10¹⁹ | 0 kA |
| 20181010.010 | 4.5 MW | 4.8 × 10¹⁹ | 0 kA |
| 20181010.011 | 4.5 MW | 5.8 × 10¹⁹ | 2 kA |
| 20181010.017 | 4.5 MW | 5.8 × 10¹⁹ | 0 kA |
| 20181010.018 | 4.5 MW | 5.6 × 10¹⁹ | 2 kA |

4.1. Gas injection fueling is sensitive to fueling location but unaffected by island size
The fueling efficiencies for the two different gas fueling systems were derived experimentally by the density rise caused by short gas injections with He and H. In total, 56 gas injections throughout OP1.2b were analyzed and different scenarios were averaged to resolve the fueling efficiencies. The averaged values with standard deviation are listed in table 3. No effect of the island size on the fueling efficiency could be measured so the average was taken over both island sizes. A large sensitivity towards the valve location with the divertor injection system was found. The detailed analysis of this phenomenon are outside of the scope of this work and will be presented in a future publication. The results are therefore limited to what is necessary for discharges analyzed in this work. It was found that fueling through the O-point of the island with valve 5 was least efficient with 12% and increased, going poloidally outwards in the target shadow region, to 31%. The efficiency of the main gas system was found in between at 28%.
Table 3. Measured fueling efficiencies for the main and divertor gas fueling system for hydrogen and helium in attached standard divertor configuration.
| Main gas | Div gas | Div gas | |
|---|---|---|---|
| Valve 3 | Valve 5 | ||
| H2 | 0.28 ± 0.09 | 0.31 ± 0.04 | 0.12 ± 0.01 |
| He | 0.41 ± 0.05 | 0.49 ± 0.04 |
4.2. Fueling efficiency of recycled H particles
The method to determine the maximum global recycling fueling efficiency , as introduced in section 3.2, was applied to all discharges and is showcased based on figure 9.


Figure 9. Continuous recycling fueling efficiency frecy(t) (blue), density ne (black), and recycling flow Γrecy (red) during plasma start up for discharge 20181010.010. The local maximum used for the determination of the value for the maximum recycling fueling efficiency is marked with an orange circle.

Download figure:
Standard image High-resolution imageHere the plasma density , the recycling flow Γrecy, and the recycling fueling efficiency, frecy(t) are plotted over time for the first few seconds of program ID 20181010.010. During plasma start up, gas is injected into the torus before the start of the ECR heating. Once the ECRH is turned on at t = 0 s, plasma is formed and the density increases within the first 0.5 s, due to more and more particles ionizing. During this start up phase, there is no additional gas fueling and the plasma is solely fueled by the evolving recycling particles of the initial gas injection. The wall outgasing was below 1% of the recycling flow. Eventually an equilibrium is reached and a stable flat top plasma density is reached ( s).


At first, the calculated frecy(t) is highly overestimated since the main reason for the rise in density is the ongoing ionization of the pre-fill gas injection and the actual recycling flow is still evolving and contributes very little to the density build up in the beginning. frecy(t) goes towards zero after the first second of the discharge, because there is no change in density anymore. However a recycling fueling efficiency can be measured during the transitioning into the flat top density around 0.6 s. At 0.5 s the density transitions from the build up into the equilibrium phase. The recycling flow follows this behavior with a delay of τp, seen by a later flat top transition at around 0.7 s. In between these two points it can be assumed that the pre-fill has been ionized and the plasma is only fueled by the recycling flow. Since the recycling flow and density are still increasing, values for frecy(t) can be measured. This can be seen in the time trace of frecy(t), which reaches a local minimum at the time of the density inflection until it rises again to a local maximum, marked by an orange circle, before density and recycling flux reach their equilibrium.
The value of frecy(t) at the local maximum is thus assumed as the maximum global recycling fueling efficiency. Averaging of this value for the considered discharges reveals the following value, with the standard deviation as the uncertainty

For ionizing divertor conditions pumped with turbo molecular pumps, maximal 24% of all recycled gas makes it to the confined plasma region. As this is a global value, local fueling efficiencies can diverge, since the ionization chance for neutrals in the SOL is much higher in the divertor region than at other areas due to the different edge densities that need to be penetrated to reach the core.
Equation (17) was used to determine the recycling fueling efficiency used in the particle balance. Here the value resulting from the inner mid-plane main gas system will be used for frecy, wall for the heat shield and steel panels with less dense, colder plasmas. As it was found that the fueling efficiency in the divertor is highly sensitive to the poloidal location (section 4.1), and experimental measurements are only available from the O-point going into the target shadow region, EMC3-EIRENE modeling was used to determine the fueling efficiency for the strike line and private flux region. As a majority of the particles on the target ionize close to the strike line, the modeled fueling efficiency frecy,div is used for particles ionizing above the horizontal and vertical target as well as the baffle. Combining equation (17) with table 3 and modeling results in (table 4).


4.3. Particle confinement time
With all fueling efficiencies determined, the particle balance can be solved for τp. In the case of H, one electron is injected with every neutral particle. Assuming pure hydrogen plasmas, the number of electrons is equal to the number of atoms. Since the interferometer determines the electron density, all particle sources can be compared based on the number of electrons a given source is injecting into the plasma. The time traces of the different sources are plotted in figure 10. These source terms show the electron rate over time which correspond to the atoms that are emitted from the sources and not the atoms that actually reach the confined region. To resolve the particles that maintain density in the confined region, these values are multiplied with the corresponding fueling efficiencies.

Figure 10. Time trace of all the source terms for the particle balance as well as line integrated density for the normal island scenario in attached standard divertor configuration (program ID: 20181010.010). The total recycling flow Γrecy is shown in blue, which is split based on the regions of ionization Γion.recy, color coded according to the PFCs in figure 3(b).
Download figure:
Standard image High-resolution imageThe density ramp up in the first second is followed by a two second flat top period before the density response to the three gas injections from the divertor gas box at 3.0 s, 3.5 s, and 4.0 s can be seen. These are followed by two injections from the main gas system at 5.0 s and 6.5 s. The injections that cause these bumps in the density can be seen as well defined flows in light blue for the divertor and in dark red for the main gas system. The total recycling flow Γrecy is shown in blue and is split based on the regions on where the recycling flow ionizes as Γion.recy.
The gas balance, that balances the neutral and plasma reservoir with the fueled and pumped neutral flow, can determine if the wall is desorbing or absorbing, and is shown in figure 11. The externally fueled particles as a function over time are shown in blue, with the particle exhaust rate in red. The wall rate is shown in black, where negative values represent an absorbing wall and positive values as a desorbing wall. Significant wall heating is key to mobilize retained gas, which explains the peak in the wall source right after plasma start up. While auxiliary fueling on low-heated walls leads to strong H absorption, as shown during the three gas injections. Throughout the discharges considered in this study, the wall was changing between desorbing and absorbing.
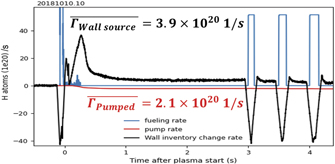
Figure 11. Gas balance for program ID: 20181010.010. Neutral source and pump rates are shown. The neutral fueling is shown in blue, pumped particles in red and the absorbing and desorbing wall in black. Negative values show particles being removed by the wall, therefore wall pumping, while positive values show and desorbing wall as an additional neutral source. Average values of the wall source as well as the pumped particles between 1 s–3 s are given.
Download figure:
Standard image High-resolution imageHowever, determined by the gas balance stayed below 1% of the total wall flow that was previously determined. This means that, as the recycling contributes 99% of the neutral particle flow from the wall in the particle balance, the measured neutral particle source from the wall will be treated as the ionizing recycling flow in this work.

Based on figure 10, it is obvious that the plasma fueling was dominated by recycling particles. When considering the different neutral recycling sources, it was measured that most of the recycling flow ionizes close to the divertor targets with 78% of the total recycling flow. This is expected since the horizontal target is the primary recycling surface where the ion flow is supposed to strike the PFC. It is more surprising, that 15% of recycling particles ionize in the main chamber, far away from the recycling surfaces, as shown in figure 12. Even though the neutral flux above the heat shield and steel panels is much lower compared to the divertor, the heat shield and steel panel having a combined area more than four times the area of the target plates, leads to such large contributions.

Figure 12. Ionization distribution of the recycling flow normalized to the total recycling flow for the normal island scenario in attached standard divertor configuration (program ID: 20181010.010).
Download figure:
Standard image High-resolution imageWhen combining the ionizing recycling flows with their appropriate fueling efficiency, we can change the perspective to analyze from where the particles enter and fuel the main plasma, as shown in figure 13. The main chamber fueling is split into the HFS above the heat shield and the LFS above the steel panels. While most recycling particles ionize close to the targets, the main chamber fueling in particular from the HFS is a strong core fueling contributor as it is much easier for particles to enter the confined region from here.

Figure 13. Time trace of all the core fueling terms for the particle balance as well as line integrated density for the normal island scenario in attached standard divertor configuration (program ID: 20181010.010). The total core fueling rate is shown in blue, which is split up into the different recycling sources as well as the gas injection fueling. The main chamber fueling is split into the HFS above the heat shield and the LFS above the steel panels.
Download figure:
Standard image High-resolution imageSimilar to the recycling flow in figure 12, the core sources are also normalized to the total core fueling rate in figure 14. Counter-intuitively, 51% of particles are fueled from the main chamber, with 38% from the HFS and 13% from the LFS. Divertor recycling contributes to 45% of the core fueling with the baffle filling the remaining 4%. The gas injection systems contributed up to 25% of the core fueling particles during injections.

Figure 14. Time trace of all the normalized core fueling terms for the particle balance as well as line integrated density for the normal island scenario in attached standard divertor configuration (program ID: 20181010.010). The core fueling distribution is split up into the different recycling sources as well as the gas injection fueling. The main chamber fueling is split into the HFS above the heat shield and the LFS above the steel panels.
Download figure:
Standard image High-resolution imageWith the density and different source time traces, combined with their individual fueling efficiencies, the particle balance is fully constrained and τp can be resolved time dependent, as shown in figure 15. After some small fluctuations during plasma start up and density ramp up, τp reaches a stable flat top of 0.258 ± 0.124 s. A stable τp shows, that the sources and sinks quickly reach a stable equilibrium, once the density ramp at the beginning of the discharge is completed. This shows a finite value of τp, for which a particle is confined in the plasma. Particles that leave the confined space can re-ionize as recycling particles or get exhausted and removed from the system. The confinement time of hydrogen is therefore higher than impurity confinement times, which are in between 0.07 s and 0.08 s, depending on the species [48].

Figure 15. Particle confinement time τp in attached standard divertor configuration (program ID: 20181010.010).
Download figure:
Standard image High-resolution image4.4. τp, , and τE with increase in island size

To study the impact of the island size as a major actuator for the divertor functionality, as discussed in section 1, the particle confinement time τp, energy confinement time τE, and the effective particle confinement time τp* have been analyzed and the results are presented in table 5. Effective confinement time measurements are presented and are used to calculate the recycling coefficient .

Table 5. Particle, energy and effective particle confinement times for normal and large island scenarios in attached standard divertor configuration.
| Normal island | Large island | |
|---|---|---|
| τp | 0.258 s ± 0.124 | 0.254 s ± 0.126 |
| τE | 0.127 s ± 0.013 | 0.132 ± 0.013 |
| τp* | 8.17 s ± 0.13 | 16.36 s ± 0.49 |
The increase in island size and the change in the edge topology shows no significant effect on the core particle confinement time. When considering particle confinement times, they are often compared to the energy confinement time τE [49, 50]. The slight change in energy confinement time is well within the uncertainty. In these experiments the core confinement properties τE, as well as τp are not significantly affected by the change in island size and the resulting change in edge topology.
Since all discharges were conducted with multiple perturbative gas injections, the decay of the density signal after the injections can be fitted to determine as discussed in section 3.4 and is shown in figure 16. Here the measured values are plotted over time for each discharge. The first three measurements are from gas injections from the divertor gas box at 3.0 s, 3.5 s and 4.0 s while the last two are from the main gas system. The points are marked at the time of the best fit of the decay signal and therefore vary slightly between discharges. The systematic increase in with the larger island size in red can clearly be seen.


Figure 16. Plot of for all four discharges in attached standard divertor configuration. Discharges with the larger island with Icc = 2 kA are plotted in red, while the normal island size with Icc = 0 kA are plotted in blue colors.

Download figure:
Standard image High-resolution imageA density rise was seen throughout the discharge for program ID 10 and 11. A density dependence of can therefore not be ruled out for those two discharges. When directly comparing the large island with the normal island size we will look at program ID 17 and 18. The systematic increase of the effective confinement time is also clearly visible in this case, even if not as extreme as with the other two discharges. When comparing these two discharges, it appears that increases in the beginning of the discharge but flattens out with the later injections. For a comparison the last three measurements were averaged and compared. While the average for the normal case is at 8.1 s with σ = 0.13. This increased by 127% to 18.37 s with σ = 0.49 for the large island case. This means that with a larger island, particles spend the same time confined in the plasma, as shown with the τp measurement, but their effective dwell time in the system doubles, as seen in the measurements.


Together with the τp measurements, the global recycling coefficient can be calculated based on equation (34) for every measurement. The first observation is that very large uncertainties of around 50% are seen, which is simply a consequence of uncertainty propagation and the fact that only total uncertainties were used as a separation of systematic and random uncertainty was not feasible. To better compare the two island sizes and look for systematic changes, was averaged over each discharge as shown in table 6. Even though increased by a factor of 2 with the large island, the recycling coefficient increases only slightly as it was already around unity for the normal island size.


Table 6. Global recycling coefficient averaged over each discharge in attached standard divertor configuration.

| Program ID | Island size | |
|---|---|---|
| 20181010.010 | Normal | 0.96 ± 0.49 |
| 20181010.011 | Large | 0.98 ± 0.50 |
| 20181010.017 | Normal | 0.96 ± 0.48 |
| 20181010.018 | Large | 0.98 ± 0.50 |

This reveals that the exhaust is slightly weaker for the large island case. Using the gas balance analysis in figure 11 and equation (5) results in and confirms the measurements through the particle balance, despite the large uncertainties.

The finite τp measurement shows a stable equilibrium between particles leaving the confined area and the refueling particle flow. Since the particles spend much longer times in the system than in the confined plasma, seen in the measurements, the particles can recycle back into the plasma many times before being removed from the system. The recycling flow is therefore the dominating particle source and only the small amount of particles that is being removed from the system has to be compensated with external fueling. The increase in with a larger island indicate a weaker divertor plugging, compared to the normal island configuration.


4.5. Increased island size leads to shift of ionization location of recycling flow
To understand the significant changes in τ* with an increase in island size at constant τp, a closer look was taken at the behavior of the different recycling sources. This is shown for the normal island size in figure 12, this time for the large island size in figure 17.

Figure 17. Ionization distribution of the recycling flow normalized to the total recycling flow for the Icc = 2 kA large island scenario in attached standard divertor configuration (program ID: 20181010.011).
Download figure:
Standard image High-resolution imageFigure 17 shows the temporal evolution of the recycling distribution for the different PFCs. The fractional distribution and the general behavior is also very similar. The largest fraction of recycling ionizes over the h-div, followed by the main chamber, v-div, and baffle. One might already notice that compared to the normal island size the neutral flow ionizing above the divertor decreases while the ion source in the main chamber increases. For a better comparison the normalized recycling flows were averaged over one second of the flat top density phase between plasma start up and the first gas injection, from 2.0 s to 3.0 s, in table 7.
Table 7. Normalized recycling distribution at the time of ionization in attached standard divertor configuration, averaged between 2.0 s and 3.0 s, for the normal island case (program ID: 20181010.010) and large island case (program ID: 20181010.011).
| ROI | Normal island | Large island |
|---|---|---|
| H-divertor | 0.60 ± 0.04 | 0.56 ± 0.04 |
| V-divertor | 0.18 ± 0.01 | 0.18 ± 0.01 |
| Baffle | 0.07 ± 0.01 | 0.08 ± 0.01 |
| HFS main chamber | 0.11 ± 0.03 | 0.14 ± 0.03 |
| LFS main chamber | 0.04 ± 0.01 | 0.04 ± 0.01 |
| Γrecy | 5.2 × 10²² s−1 | 5.7 × 10²² s−1 |
The uncertainty of the normalized recycling is dominated by systematic uncertainty, and it is the same for both island scenarios. Since the number of total recycled particles stays roughly the same, any change in the normalized recycling represents a shift of particle sources from one area to another. No changes are seen on the v-div plate in this configuration. The neutral source from the horizontal target decreases by 4%, while the flow in the main chamber increases by 3%. Assuming a constant ion flow, a decrease in the neutral source on the divertor could be an indication weaker divertor plugging.
The changes on the core fueling follow this trend. The HFS of the main chamber contributes now 12% more to the core fueling, than the h-div. The order of the different fueling locations stays the same, but the percentages change slightly. The divertor contributes now 4% less to the core fueling, while the fueling from the HFS in the main chamber increases by 5%, as presented in table 8.
Table 8. Normalized core fueling flows in attached standard divertor configuration, averaged between 2 s and 3 s, for the normal island case (program ID: 20181010.010) and large island case (program ID: 20181010.011).
| ROI | Normal island | Large island |
|---|---|---|
| H-divertor | 0.35 ± 0.14 | 0.31 ± 0.13 |
| V-divertor | 0.10 ± 0.04 | 0.10 ± 0.04 |
| Baffle | 0.04 ± 0.02 | 0.04 ± 0.02 |
| HFS main chamber | 0.38 ± 0.21 | 0.43 ± 0.24 |
| LFS main chamber | 0.13 ± 0.07 | 0.12 ± 0.07 |
| ΓCorefuel. | 5.1 × 10²¹ s−1 | 5.9 × 10²¹ s−1 |
4.6. Other changes with an increase in island size
If the hypothesis of weaker divertor plugging would be true, an increase in divertor as well as main chamber neutral pressure should be seen. Comparing the divertor pressure, averaged over all divertor pump gap gauges, a systematic increase with island size can be seen in table 9, where the neutral pressures are averaged between 2.0 s and 3.0 s for a better quantitative comparison. An increase by 28% in divertor pressure from 3.2 × 10⁻² Pa to 4.1 × 10⁻² Pa was measured, likely due to the strike line shift towards the pumping gap with increasing island size, as discussed in section 1. However an even stronger increase by 46% from 2.6 × 10⁻⁴ Pa to 3.8 × 10⁻⁴ Pa was measured on the mid-plane.
Table 9. Parameter changes in regards to island size in attached standard divertor configuration, based on program ID: 20181010.010 (normal island) and 20181010.011 (large island).
| Normal island | Large island | ||
|---|---|---|---|
| τ p | 0.258 s | 0.256 s | 0.99 |
| 8.17 s | 16.38 s | 2.04 | |
| 0.96 | 0.98 | 1.02 | |
| τ E | 0.127 s | 0.133 s | 1.05 |
| p div | 3.2 × 10⁻² Pa | 4.1 × 10⁻² Pa | 1.28 |
| p mid | 2.6 × 10⁻⁴ Pa | 3.8 × 10⁻⁴ Pa | 1.46 |
| C n | 123.1 | 107.9 | 0.88 |
| P rad-core | 0.29 MW | 0.36 MW | 1.24 |
| P rad-SOL | 0.50 MW | 0.75 MW | 1.51 |


Thus, no increase of the divertor compression in this case: the compression ratio decreases from 123.1 to 107.9. Since the divertor also has neutral leakage due to the open geometry, it is possible that a higher neutral pressure in the sub-divertor region also leads to a higher leak rate and could contribute to the neutral pressure increase on the mid-plane. Such phenomena have been seen in tokamaks before.
In addition, an increase of the radiated power by about 50% was seen in the SOL, which was connected to an increase in the abundance of carbon impurities: a 44% increase in C-II emission normalized to density and temperature was measured in the SOL. The role of the W7-X SOL and edge islands on impurity transport have previously been studied with EMC3-EIRENE modeling [51]. The previously discussed changes of the confinement, recycling, neutral pressure, and radiated power in regards to the control coil current are summarized in table 9. The values are averaged between 2.0 s and 3.0 s of stable plasma operation in the discharge.
5. Conclusion
A single-reservoir plasma particle balance has been established at W7-X for 4.5 MW ECR heated, attached plasma discharge with a density of 5 × 10¹⁹ m−3 in the standard divertor configuration with boronized walls, to investigate the fueling, recycling and exhaust of the main species hydrogen. In such a particle balance the particle sources are balanced with the outward flow, which is defined by the ratio of the total number of particles in the confined plasma and a finite particle confinement time. Fueling efficiencies for the gas injection sources, as well as the recycling flows are key components of such a particle balance.
The analysis done to constrain the particle balance revealed that the fueling efficiency in the divertor was sensitive to the exact fueling location and was measured between 12% and 31%, with the main gas system fueling at 28% efficiency. No island size effect on the fueling efficiencies could be found. Helium fueling was overall more efficient than hydrogen fueling.
An experimental technique to determine the global maximum recycling fueling efficiency was established and revealed . EMC3-EIRENE was applied to estimate the efficiency for injections into the private flux region as no experimental access was available. Modeling revealed a low fueling efficiency of 6% for recycling particles on the strike line, due to the higher densities. The single-reservoir particle balance resolved the distribution of the 5.2 × 10²² s−1 recycling flow at the time of re-ionization across the different PFCs for the first time. It was shown that in attached scenarios, 78% of the recycling flow re-ionizes above the divertor, while 15% ionized in the main chamber.

The core plasma fueling was resolved at 5.1 × 10²² s−1, revealing that the core plasma is counter-intuitively fueled by up to 55% from the main chamber. Even though 78% of the recycling flow ionizes close to the divertor targets, it contributes to only up to 41% of the core fueling, due to the high density at the strike line and the resulting lower fueling efficiency. Even though the particle fueling rate through gas injections is only on the order of 10% of the total recycling flow, the higher fueling efficiency still allow proper density control by a core fueling percentage of up to 25% at the time of injection. Using ΓCorefuel and Γrecy, reveals a global fueling efficiency of around 10%, disclosing that was overestimated by more than a factor of 2.

The particle confinement time for hydrogen was measured for the first time. A particle confinement time of τp = 0.258 s and an effective confinement time of was determined, which resulted in a global recycling coefficient of 0.96. The hydrogen confinement time is therefore several times larger, than impurity confinement times which are between 0.07 s and 0.08 s [48]. This indicates that the wall was close to saturation and could potentially change from a desorbing to an absorbing state, or vice versa. This was supported by gas balance results, and shows that the wall is a recycling source that is effected by pre-pulse histories and undergoes variations by wall source effects, experiencing either an enhanced or deminished effect on the order of 1% of the total wall source.

Three main effects of the change in island structure on neutralization, neutral transport, and ionization can be observed. The most intuitive reason for a change in the exhaust properties is the shift of the strike line. With the larger island, the strike line is shifted 5.9 cm closer to the pump gap in between the two target plates, which reduces the distance from pump gap to strike line from 12.1 cm for the normal island, to 6.2 cm for the large island case. Additionally the connection length close to the strike line decreases by a factor of two with the increase in control coil current. Magnetic connection lengths in the private flux region are reduced from 170 m for the normal island size to 60 m for the large island size, and from 520 m to 260 m in the SOL, which could result in reduced perpendicular ion losses due to the shorter pathway into the divertor. Finally the island width grows, increasing the distance between LCFS to target surface at the O-point, from 6.5 cm for Icc = 0 kA to 10.2 cm with Icc = 2 kA, which could have an impact on neutral trapping in the island. These and other effects of changes of the island size are discussed in more detail in [9].
While the core particle confinement time τp remained unaffected by the increase in island size, the effective dwell time in the system increased by a factor of 2, with an increase in island size induced by increasing Icc = 0 kA to Icc = 2 kA. This shows a weaker exhaust with the large island size and could be an indication for an increase in divertor leakage. An increase in the neutral pressure in the pump gap as well as the main chamber was measured. The increase in island size and shape revealed a shift in the ionization distribution of the recycling flow from the divertor into the main chamber due to the change in edge topology. The higher density of neutrals in the main chamber could cause the increase in , as the effective pumping speed by turbo molecular pumps is much smaller, compared to the divertor region. An increase in Prad was measured, predominantly in the SOL, where it increased by about 50% with the island size. The main cause for this is likely an increase in the carbon impurity concentration as seen in density and temperature normalized spectroscopic measurements. These changes with the increase in island size could not be pin pointed to one of the three physics parameters: strike line shift, island width, nor magnetic connection length. But it proved that the divertor control coils can be used to optimize divertor pressure, recycling flow distribution and overall exhaust features, without changing core confinement properties. The divertor control coils form therefore an important control parameter for divertor operation, that were shown to cut the effective particle confinement time by 50% when going from an enlarged island at Icc = 2 kA to the normal island at Icc = 0 kA. While this is a drastic change in the effective confinement time, overall pumping is still weak, so that the global recycling coefficient decreases only slightly from 0.98 to 0.96. Based on the particle confinement time measurements, most of the ions neutralizing on the divertor targets recycle and only 2%–4% of the total recycling flow are exhausted. If one considers the pumped rate from the gas balance this value further decreases to only 0.5% of the total recycling flow.


Future work will extend this analysis to different configurations and include the NBI and pellet core fueling systems which can raise the core density due to their higher fueling efficiencies. Detached plasma scenarios are challenging as the change in plasma parameters at the strike line needs detailed assessment of the fueling efficiencies as well as the S/XBeff values. As the particle balance is most sensitive to the recycling fueling efficiency, experimental validation of the modeled fueling efficiency on the strike line would be desirable to decrease the uncertainty. This could be achieved by a gas injection system in the private flux region. For the next operational phase W7-X fueling and pumping system will be upgraded significantly. Cryo pumps will be installed in the sub divertor region, increasing the pump rate significantly, while the divertor gas injection system will be expanded to all 10 divertor modules. Experiments with a smaller island size are planned, to study if this will further reduce and to optimize the exhaust properties. If the ratio between a small particle confinement time and a long effective particle confinement time of hydrogen persists for helium, the helium concentration in the plasma could rise beyond operational limits in a future reactor. Sufficient helium exhaust has to be demonstrated in order to validate the island divertor for a future reactor setting and should be studied in the next experimental campaign.

Acknowledgments
This work has been carried out within the framework of the EUROfusion Consortium and has received funding from the Euratom research and training programme 2014–2018 and 2019–2020 under Grant Agreement No. 633053. The views and opinions expressed herein do not necessarily reflect those of the European Commission.
This work was funded in part by the Department of Energy under Grant DE-SC0014210.
Appendix A.: (S/XB)eff from photon to particle fluxes and back again
The determination of atomic particle fluxes, ΓH through passive spectroscopy of atomic lines is a well known method, which accuracy depends on the knowledge of the appropriate atomic data and the local plasma parameters [27, 39, 40]. The atomic particle fluxes can be inferred from the photon flux ϕH, of observed electron transitions of the atom by utilizing inverse photon-efficiencies or S/XB coefficients:

The inverse photon-efficiency consists of the collisional ionization rate coefficient S and the excitation rate coefficient X. B is called the branching ratio and is a ratio between excitation and de-excitation or radiation. The molecular flux can be determined in a similar way, using photons from the Fulcher-α band. Since the dissociation of the molecules plays a significant factor, S is replaced by the decay rate D [40]


Alternatively the total hydrogen particle flux Γtot can be determined from only the Balmer series, by using effective S/XB values that connect the total particle flux to the photon flux, in this study to the Hα line emission. Four different methods of determining effective S/XB values based on edge density and temperature, measurements of Hα photon flux over Langmuir probes, as well as gas injection clouds, and the determination through EMC3-EIRENE modeling are introduced

A.1. (S/XB)eff,theo
For the case of a cold surface with a significant molecular presence, as defined in section 3.3, the atomic S/XB value can be multiplied by two, to take the molecular contribution into account [27]. As this value is based on the theoretical atomic values, it will be referred to as (S/XB)eff,theo

As it is based on the true value, the same assumptions apply, i.e. that all particles ionize in the LoS and that plasma temperature and density are constant in the ionization length. While an ionizing plasma is a valid assumption at W7-X, values for Te and ne change along the poloidal edge profile, as it is common in fusion devices. However valid values can still be determined for regimes where is not sensitive to edge parameters, Te > 20 eV and ne < 1020 m−3, or with sufficient knowledge about the location of the radiating neutrals. A typical radial radiation profile for the Balmer lines would start at 0 at the PFC surface as there are no radiating neutral hydrogen atoms within the solid material. The line intensity then has a sharp rise with a maximum around 5 mm above the surface. This peak is followed by a decay with e-folding lengths on the order of 1–2 cm [27, 52]. Due to the sharp peak in intensity, the value for the Te and ne parameter at the peak location is often used [38].


EMC3-EIRENE modeling for the attached discharges in this work confirmed the previously mentioned length scales of the radial profiles with a maximum at 5 mm above the strike line. Based on Te and ne measurements from the helium beam (section 2) at this location


is determined.
A.2. (S/XB)eff,gas
Instead of looking up atomic S/XB values in a database, it is also possible to measure the Hα photon flux of a known particle source. Since the S/XBeff is used itself to determine the recycling flux, other known particle sources have to be used as an estimate. Gas injections can serve as excellent experimental proxies, as their pure molecular composition is very similar to the 90% molecular contribution in the recycling flux on cold targets, as explained in section 3.3. While the atoms in the recycling flux move fast with the Frank–Condon energy, the recycling molecules are much slower with a kinetic energy defined by the wall temperature and are released in a cosine distribution [38]. The molecules from a gas injection are typically at room temperature, and therefore colder than the recycling molecules, but do get injected with an over pressure through small nozzles in a more directed gas plume towards the plasma. Therefore the molecular velocities are also very similar and (S/XB)eff,gas is defined as:

A region of interest was set up around the plume of the gas injection to measure the photons released by it. The ROI is shown in figure A1 with the resulting Hα photon flux for program ID 20181010.010 in figure A2.

Figure A1. Frame of an Hα image in HM51. The two strike lines on the horizontal and vertical target are visible, with the white square marking the ROI around the gas injection plume.
Download figure:
Standard image High-resolution image
Figure A2. Hα photon flux measurement of the ROI defined in figure A1 for program ID 20181010.010.
Download figure:
Standard image High-resolution imageCombining the photon flux measurements with the calibrated number of injected particles results in:

A.3. (S/XB)eff,Langmuir
Additional one can compare the incoming particle flux measured by Langmuir probes with the Hα photon flux released by the neutral population. Due to the differences between incoming particle flux, recycling flux, and the local neutral population, as explained in section 3.3, these differences have to be taken into account for the interpretation and the analysis has to be done with great care. Under these considerations the incoming particle flux can be defined through the measured ion saturation current jsat and the average particle charge Zavg, resulting in

In practice, the comparison of Hα photon flux measurements with the ion saturation current proved to be difficult. Due to the neutral transport between an ion striking the Langmuir probe, and the radiation of Hα photons from the resulting neutrals, a direct comparison was difficult. Data from modeling suggests that even on the horizontal target, where ionization lengths are short, neutrals can travel on the order of 2–3 cm between their point of neutralization on the recycling surface, until they emit Hα photons. Therefore a local comparison of and jsat can only be done on those length scales. Additionally the measured values were consistently off by a factor of 5, when comparing with other diagnostics and modeling resulting in S/XB values five times larger than expected. As this factor was consistent throughout measurements (S/XB)eff,Langmuir is corrected for it, resulting in:


A.4. (S/XB)eff,model
Besides the experimental approaches, a dedicated EMC3-EIRENE simulation was set up. The simulation took the actual magnetic field configuration, including effects through the toroidal current, into account. IR-as well as Hα -profiles were used to estimate the actual island location as well as an estimate of cross-field transport coefficients. Thomson profiles were used as a boundary condition at the separatrix while the jsat profile by the Langmuir probes was used as a boundary condition at the edge. For the (S/XB)eff,model, the lines of sight from the Hα cameras were included, and the ionizing neutrals Si in that LoS were compared to the released Hα photons. This is the best definition when trying to determine a particle source term through Hα measurements, as it takes non-local neutrals into account

The modeling results are presented in figure A3. (S/XB)eff,model is plotted along the distance s across the vertical target. The edge of the horizontal target at the pump gap is marked withs = 0. At unloaded areas on the target (S/XB)eff,model is around 20, increasing up to 35 at the position of maximum Hα radiation. As this location also resembles the strike line and the region of the majority of the recycling particles, the S/XB from modeling is determined as:


Figure A3. (S/XB)eff,model along distance s, starting at the pump gap with s = 0, across the horizontal target. Values for two different Γrecy as a sensitivity study are presented.
Download figure:
Standard image High-resolution imageAppendix B.: Sensitivity study
While some measurements for this analysis are straight forward, others are prone to a higher level of uncertainty. To increase the understanding on how τp as the figure of merit of the particle balance is affected by the input parameters with the highest uncertainty, three sensitivity studies were conducted to test the robustness of the analysis.
B.1. Particle balance sensitivity to S/XBeff
As discussed before in section appendix A, the local plasma parameters define the S/XBeff values. In front of the divertor target the ionisation length scale is short, which results in a localized emission region, that aids to extract local plasma parameters with some reasonable uncertainty. However, because of an order of magnitude difference in density and cold plasma conditions in front of the wall, much longer ionisation length scales are found. This results in a wide domain in which the Hα emission can be produced and hence a large variability in the plasma parameters to define S/XBeff. The question arises on how robust the particle balance is towards changes in the .

On the distance of the ionisation length scale from the wall the S/XBA coefficient increases from 10 to around 25. For this reason S/XBwall was changed to 10 as an extreme minimum and 20 as an extreme maximum. The changes in τp compared to the value defined in section 3.3 are shown in table B1. A decrease in S/XBwall by 29% leads to an increase of τp by 16%, while an increase by 79% leads to a decrease in confinement time by 29%. The output response is significantly smaller than the change in input. A good metric to measure the sensitivity is the error ratio, the ratio of output change over input change, as done in the last column of the table. The largest is assumed as the error ratio for the range in this study. This means that for a 100% change in S/XBwall, −55% change in τp is assumed or that the change in τp is 45% weaker than the change in the S/XBwall input. The uncertainty in S/XB is predominantly systematic. As long as there is no large deviation in the plasma edge parameters between compared discharges, measurements of relative changes with the particle balance are not sensitive to the uncertainty in S/XB.


Table B1. Sensitivity of the output of the particle balance, τp in relationship to the effective S/XB coefficient for the wall. Changes are in comparison to the standard case, which is used in this work.

| S/XBwall | ΔS/XB | τp (s) | Δτp | |
|---|---|---|---|---|
| 10 | −29% | 0.300 ± 0.152 | +16% | −0.55 |
| 14 | 0.258 ± 0.124 | |||
| 25 | +79% | 0.184 ± 0.081 | −29% | −0.36 |

B.2. Particle balance sensitivity to frecy
Another difficult metric to determine is the recycling fueling efficiency since experimental measurements in on the strike line or in the private flux region are not available (subsections 3.2 and 4.2). A broad variety of frecy were tested and the response in τp was monitored in a similar way as done previously with the S/XB coefficients.
As seen in table B2 the particle balance is very sensitive to frecy and just a small decrease can change the particle confinement time significantly. Unlike the S/XB, the error ratios change systematically in almost an exponential decay pattern. When decreasing frecy compared to the standard case the input change is amplified for the output, but for an increase in frecy the opposite is true and the output change is weaker than the input change. Since the recycling particle source is the dominating source term in the particle balance, it is very important to determine this value as accurate as possible. However, the fact that frecy does not change for the experimental program considered and that the applied modeling agrees well with the edge plasma parameters increases the confidence in the determined value [29]. In the future a gas injection system in the private flux region or even in the strike line would be desirable to measure this value experimentally. This could significantly decrease the uncertainty in τp. Similar to the influence of S/XB, the sensitivity to frecy causes a systematic uncertainty, which effects the absolute value of τp, but not the comparison of relative changes.
Table B2. Sensitivity of the output of the particle balance, τp, in relationship to the recycling fueling efficiency in the divertor. Changes are in comparison to the standard case as it is used in this work.

| frecy | Δfrecy | τp (s) | Δτp | |
|---|---|---|---|---|
| 0.01 | −83% | 0.439 ± 0.338 | +70% | −0.84 |
| 0.02 | −67% | 0.385 ± 0.263 | +49% | −0.73 |
| 0.05 | −17% | 0.280 ± 0.146 | +9% | −0.53 |
| 0.06 | 0.258 ± 0.124 | |||
| 0.07 | +17% | 0.238 ± 0.107 | −8% | −0.47 |
| 0.10 | +67% | 0.194 ± 0.074 | −25% | −0.37 |
| 0.15 | +150% | 0.148 ± 0.046 | −43% | −0.28 |

B.3. Systematic camera uncertainties
The signal to noise ratio is usually good, resulting in an uncertainty on the order of 1%, but a systematic uncertainty was of concern. The incident angle of the PFC surface to the camera view angle, in particular when surfaces are viewed in a very shallow angle as it is the case for certain areas of the heat shield. When looking at a larger angle through the edge layer where the ionization occurs, one increases the LoS length in this, and might collect more photons and therefore over estimating the actual particle flux. In an ideal scenario to calculate a photon flux into a particle flux, one would look perpendicular onto the surface with Te and ne being constant on the scale of the ionization length. The effect of changing Te and ne on the S/XB coefficient and how it is determined were discussed in section appendix A and a sensitivity study was justpresented.
The effect of camera sight lines that are not perpendicular to the surface will also be discussed in this sub-section. When looking at a larger angle through the edge layer where the ionization occurs, the LoS length increases, and might collect more photons and therefore over estimating the actual particle flux. Another effect can be that close to the border of the defined ROI in the camera field one might take photons into account that were released from a neighboring ROI. For the divertor target and baffle, the camera camera view angle is almost perpendicular to the PFC. The same is true for the filter scopes view angle on the steel panels. The heat shield, however is viewed almost entirely and the orientation of the PFC surface towards the camera change from perpendicular to very shallow angles.
To study the magnitude of this effect for , photon fluxes at three different locations on the heat shield were compared for discharge 20181010.017. Two ROIs were picked on the heat shield that have the same area of 100 × 100 pixels in the image but change drastically in the observed surface area due to the difference of the angle of incidence. While ROI1 looks almost perpendicular onto the PFC with an observed area of 0.035 m2, ROI2 looks onto the PFC in a much shallower angle resulting in an observed area of 0.098 m2. The position of the two ROIs relative to the strike line location can be seen in selected frames in figure B1.


Figure B1. ROI1 on the left at pixel x = 1250 y = 800 (100 × 100 pixel) with an observed area of 0.035 m2 and ROI2 on the right at pixelx = 1100 y = 1050 (100 × 100 pixel) with an observed area of 0.098 m2.
Download figure:
Standard image High-resolution imageThe photon flow from each ROI is then divided by the observed area to get a photon flux. These photon fluxes are then compared to the flux from the entire shield in figure B2. While the three time traces rise at different speeds during plasma start up they all reach their flat top together with the density at 2 s. After 2 s a systematic difference can be seen with ROI1 having a higher flux than ROI2 but a smaller one than the entire shield. The difference however is within the uncertainty of the integrated photon flux. Averaged from 2 s to 8 s, the flux on the entire heat shield is 8% higher than ROI1, while the flux on ROI2 is 8.5% lower. Many of the local maxima and minima are located at the same times indicating that these are indeed fluctuations in the flux and not just random noise. Since all three ROIs differ only slightly it can be assumed that there is little sensitivity in the viewing angle and taking the entire shield as an observed area is a valid approach. This is therefore used for the determination of ΓHFS-MainCh..

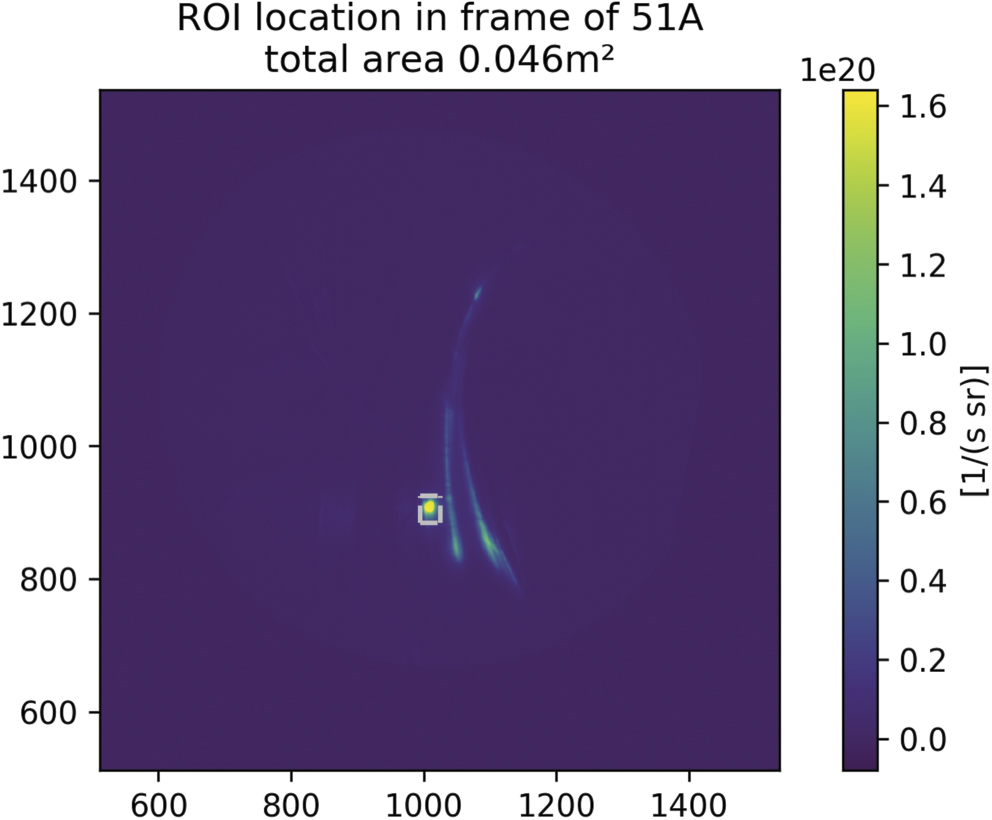
Figure B2. ROI1 on the left at pixel x = 1250 y = 800 (100 × 100 pixel) with an observed area of 0.035 m2 and ROI2 on the right at pixelx = 1100 y = 1050 (100 × 100 pixel) with an observed area of 0.098 m2 (program ID: 20181010.017).
Download figure:
Standard image High-resolution image