


Abstract
The characteristics of I-mode operation in helium (He) plasma with radio-frequency (RF) wave heating and ITER-like tungsten divertor have been investigated for the first time on EAST, under the favorable BT configuration. Stationary I-mode in He plasma lasting for ∼5.4 s was achieved at Ip = 0.5 MA, BT = 2.4 T with a total injected RF power of 3.5 MW, along with the appearance of the 30–90 kHz weakly coherent mode and the ∼13 kHz edge temperature ring oscillation. The pulse length was only limited by the heating power duration. He concentration was found to play a critical role in I-mode operation, as L–I transition threshold power was increased and the energy confinement was degraded with increasing He concentration. The experimental investigation result on energy confinement and divertor heat flux between I- and H-mode plasma was also given at a similar He concentration.
Export citation and abstract BibTeX RIS
This article was updated on 10 November 2021 to correct the affiliations for the EAST Team.
1. Introduction
In order to support future ITER non-nuclear operation phase, comprehensive experiments with helium (He) ion (refer to the helium-4 isotope) as the dominant ion species have been carried out in the superconducting tokamak EAST under the condition of pure radio-frequency (RF) wave heating and ITER-like tungsten divertor [1, 2]. The helium concentration (CHe), defined as the ratio of helium (He) to deuterium (D) content, was found to play a critical role in determining plasma performance [3]. Both energy confinement time and edge localized modes (ELMs) frequency correlate with the change of CHe. At very similar plasma parameters of magnetic field BT = 2.4 T, plasma current Ip = 0.5 MA and line-averaged plasma electron density ne ∼ 3 × 10¹⁹ m−3, the high-confinement mode (H-mode) power threshold (Pthr) increases linearly with CHe, consistent with the results from DIII-D experiments [4]. At the time of experiments, it was very hard to access H-mode when CHe exceeded 70%, which was mainly attributed to the limited available power source. However, an improved confinement mode (labelled I-mode) regime [5] has been achieved for the first time in He plasma on EAST in the case of high CHe. The I-mode operation regime features high confinement with a temperature transport barrier at the plasma edge region [6–10], and excellent core impurity exhaust capability, nearly identical to that of L-mode plasma due to non-existence of the particle edge transport barrier (ETB) [11]. In contrast to the H-mode regime, the I-mode plasma also has the merit of absence of ELM instability, which could cause critical damage to plasma facing components via transient high heat and particle fluxes.
The I-mode operation regime on EAST [12] has been widely achieved in D plasma in the unfavorable BT divertor configuration ( B × ∇ B directed away from the active X-point), where the L–H transition threshold power is significantly higher and the energy confinement is much worse than those at the favorable configuration [13]. The access to the I-mode regime in D plasma on EAST was found to be independent from the heating method and wall material. The appearance of weakly coherent mode (WCM) with a frequency of 50–120 kHz generally accompanied the occurrence of L-I transition on EAST, in line with Alcator C-Mod and ASDEX Upgrade results. The WCM on EAST is located within a certain radial extent (2–3 cm) at the plasma edge. A novel microscopic physics mechanism that can sustain stationary I-mode in D plasma has been recently reported on EAST [14], which sheds a light on the development of a long pulse high confinement I-mode scenario foreseen for future fusion devices, such as ITER and CFETR.
In this paper, the characteristics of I-mode operation in He plasma with pure RF-heating and tungsten divertor has been investigated for the first time on EAST, under the favorable BT configuration. Previous experiments on C-Mod have also realized stationary I-mode operation in D plasma under specific plasma shapes in the favorable BT configuration, which is thought to be a key actuator in accessing I-mode [6]. It is common knowledge that I-mode plasma is usually achieved in the unfavorable BT configuration condition where L-H transition threshold power is much higher. The much higher H-mode threshold power for He plasma extends the operation window to access the I-mode regime, providing a novel area to investigate and understand pedestal physics related to the formation of ETB. The paper is structured as follows. Introduction to I-mode in He plasma is given in the next section. Section 3 describes the impact of helium concentration on L–I transition threshold power and energy confinement in I-mode operation. Section 4 compares the I- and H-mode operation including energy confinement and divertor heat flux at similar helium concentrations, followed by a summary and conclusion.
2. I-MODE characteristics in helium plasma
In this paper, the main plasma parameters for helium I-mode regime are as follows, Ip = 0.5 MA, BT = 2.4 T and ne = 2.5–4 × 10¹⁹ m−3. All of the discharges are performed in the upper-biased divertor configuration with ion ∇ B drift towards the active X-point, commonly known as the favorable BT direction. It should be noted that the I-mode regime in D plasma is mostly achieved at the unfavorable BT configuration. RF wave including the lower hybrid (LH) wave of both 2.45 and 4.6 GHz and electron cyclotron (EC) resonant frequency of 140 GHz working at X2 mode [15] were used as heating and current drive methods where LH was dominant. The pure RF wave heating enables the plasma to come into ITER-like operation conditions of dominant electron heating and zero external torque.
A typical L–I transition process in He plasma can be found in figure 1, where time traces of several key parameters are given. At t ∼ 2.58 s, the second EC power source was injected into the plasma leading to a total RF heating power of ∼3.5 MW (PLH = 2.6 MW plus PEC = 0.9 MW), and both the plasma stored energy Wdia and the electron temperature Te, represented by ECE signal, increased immediately while no obvious change of plasma density was found. After that, the Wdia and ECE signal kept increasing but with a slightly slower ramp rate compared to that induced by initial heating of EC power. This bifurcation point is indicted by the green dashed line in figure 1, which is ∼70 ms (nearly one energy confinement time) after the injection of EC power. Meanwhile, the WCM with frequency of 30–90 kHz along with the 13 kHz edge temperature ring oscillation (ETRO) were observed in the time-frequency spectrum of turbulence rotation velocity measured by Doppler reflectometry. As the ne and He-I line emission count stayed nearly constant during the second increasing period of Wdia and Te, as well as the appearance of WCM and ETRO, transition from L to I mode in He plasma can be identified for the first time on EAST.
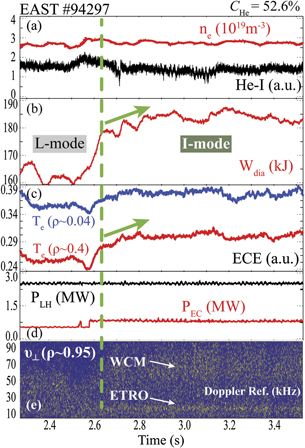
Figure 1. Time traces of several parameters of a typical I-mode discharge in He plasma at Ip = 0.5 MA and BT = 2.4 T with ion ∇B drift towards active X-point, (a) plasma ne (red) and He-I line emission count (black),(b) plasma stored energy, (c) ECE signal at two radial position of plasma core (blue) and outer region (red), (d) injected power of LH wave (black) and EC resonant heating (red), and (e) time-frequency spectrum of turbulence rotation velocity measured by Doppler reflectometry. The green dashed line indicates the time slice of transition from L to I mode.
Download figure:
Standard image High-resolution imageDifferent from the I-mode operation in D plasma reported on ASDEX Upgrade, which usually gradually evolves into H-mode at constant heating power level [16], the I-mode regime in He plasma on EAST could reach a stationary state, as seen in figure 2. The stationary I-mode lasts from 2.65 s to 8 s, which is only limited by the EC heating power duration. The power spectra of turbulence rotation velocity show the ETRO mode of ∼13 kHz at all three radial locations of ρ ∼ 0.89 (red), ρ ∼ 0.95 (blue) and ρ ∼ 0.97 (black) in figure 2(c), indicating identical microscopic physics mechanism sustaining stationary I-mode for both He and D plasmas [14]. However, the 30–90 kHz mode only appears in the power spectra at ρ ∼ 0.89 and ρ ∼ 0.95, confirming itself as the WCM.
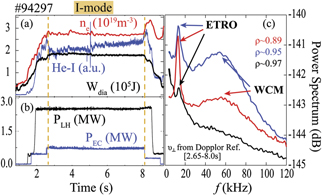
Figure 2. Illustration of a stationary I-mode discharge in He plasma at Ip = 0.5 MA and BT = 2.4 T with ion ∇B drift towards active X-point. (a) Plasma ne (red), He-I line emission count (blue) and plasma stored energy Wdia (black), (b) injected power of LH wave (black) and EC resonant heating (blue) and (c) power spectrum of turbulence rotation velocity at three radial locations during 2.65–8 s, revealing the ∼13 kHz ETRO and 30–90 kHz WCM. The yellow dashed lines indicate the stationary I-mode period lasting for ∼5.4 s that is only limited by the heating power duration.
Download figure:
Standard image High-resolution imageFigure 3 illustrates the temporal evolutions of turbulence spectrum measured by Doppler reflectometry, along with the intensity of ion diamagnetic drift turbulence (IT) and electron diamagnetic drift turbulence (ET). From [14], the ETRO is found to accompany by alternating turbulence transitions between ET and IT, which can be also clearly observed from figure 3(a). The dominant turbulence mode was found to alternate between ET and IT, as IT intensity (blue) valley well corresponded to the peak of ET intensity (red). This phenomenon is consistent with that identified in D plasma on EAST.
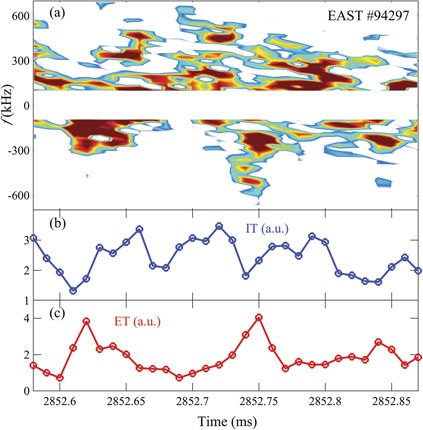
Figure 3. From top to bottom, temporal evolutions of (a) turbulence spectrum, (b) IT intensity and (c) ET intensity for #94297.
Download figure:
Standard image High-resolution image3. Impact of helium concentration on I-mode operation
The L–H threshold power against plasma density in He plasma has been intensively investigated at various operation parameters of Ip = 0.4–0.5 MA and BT = 1.8–2.4 T, see [3]. Figure 4 gives the results of L–I threshold power (diamond symbols) against plasma density at Ip = 0.5 MA and BT = 2.4 T, along with the L–H statistic results (circle symbols) for reference. Here, in this paper, the experimental threshold power is defined as Ploss = Pohm + Paux − dWdia/dt at the occurrence of L–I and L–H transition, where Pohm is the ohmic power, Paux is the total absorbed RF power and Wdia is the plasma stored energy. As can be clearly found from figure 4, both threshold powers of L–I and L–H in He are higher than the scaling law results for D plasma [17]. Due to limited data points for L–I case, it is not reliable to determine the dependence of I-mode threshold power on density now. The appearance of a relatively lower Ploss value (red diamond) that is heated by combination of RF and neutral beam (NB) compared to those with RF-only heating gives a hint that additional NB power seems more efficient in triggering transition from L to I mode, in agreement with the ASDEX Upgrade investigation that ion heat flux plays a key role in pedestal formation [16]. As is well-known, NB power can direct heat main ions, which is the main difference compared to dominant electron heating via RF power. Besides, the four blue diamond points at ne ∼ 4 × 10¹⁹ m−3 own even higher Ploss values compared to the corresponding H-mode threshold power in He plasma, which is mainly attributed to the higher helium concentration (CHe > 70%), which should play a critical role in pedestal physics [3].
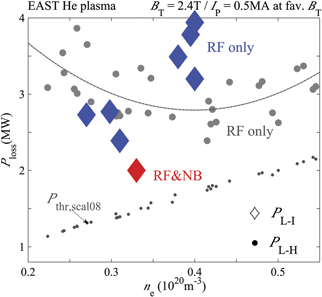
Figure 4. Experimental L–I and L–H threshold power (Ploss) values obtained in EAST He plasma discharges heated by LH and EC in the upper-biased divertor configuration is shown against line-averaged plasma electron density ne at Ip = 0.5 MA and BT = 2.4 T with favorable BT, with diamond symbols representing those at L–I transition and circles indicating the L–H cases that used as references herein. The corresponding results of ITPA scaling law Pthr,scal08 for D plasma are also given. It should be pointed out that the red diamond is the only case heated by RF plus neutral beam power, showing a much lower L–I threshold power compared to those with RF-only heating.
Download figure:
Standard image High-resolution imageIn order to evaluate the helium concentration (CHe) impact on plasma performance at very similar conditions, experiments were carried out at various CHe levels under Ip = 0.5 MA and BT = 2.4 T. The basic parameters of two typical discharges are shown in figure 5, where the red color represents the lower CHe ∼ 55% case and black curves refer to the higher CHe ∼ 74% one. The lower CHe plasma entered into H-mode (t ∼ 3 s) with total RF power of ∼3.7 MW, while only I-mode achieved for high CHe with optimized plasma density at even higher heating power level by adding extra 0.5 MW of LH. Note that running at ne ∼ 3.6 × 10¹⁹ m−3 was expected to facilitate H-mode access, corresponding to the minimum L–H transition power threshold [3]. Due to the helium concentration effect on enhancing heating power needs for accessing H-mode, the higher CHe plasma for shot #94369 could only go into the I-mode regime with such an insufficient power source.
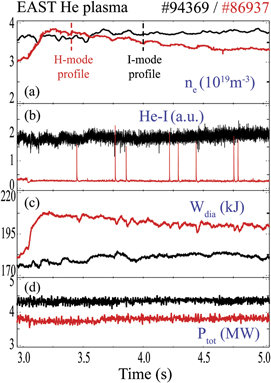
Figure 5. Comparison of I-mode (black, CHe ∼ 74%) and H-mode (red, CHe ∼ 55%) plasma performance at Ip = 0.5 MA and BT = 2.4 T. From top to bottom, plasma density ne, He-I line emission count, plasma stored energy Wdia and total RF power injected into the plasma. The two dashed lines in (a) indicate the time slice chosen for profile comparison.
Download figure:
Standard image High-resolution imageIt was found that the stored energy Wdia in the case of CHe ∼ 55% was ∼14% higher than that of CHe ∼ 74% at identical plasma density (time slice indicated by two dashed lines in figure 5(a)). To investigate the physics causes, plasma profiles of Te and ne are given in figure 6, where the Te was measured by Thomson scattering and ne was measured by the density profile reflectometry. For both cases, the pedestal structure of electron temperature was clearly observed, while that of density was only found for the H-mode case (red, CHe ∼ 55%), which confirmed again that the high CHe ∼ 74% plasma stayed in the I-mode regime. The slight deviation in the electron density profile at the plasma edge is not adequate to account for the ∼14% difference in Wdia, indicating that ion channel might play a dominant role. Limited to diagnostics technical issues, it is not possible to obtain experimental information on the Ti and ni profiles at present.

Figure 6. Comparison of plasma Te and ne profiles at I-mode (black, CHe ∼ 74%) and H-mode (red, CHe ∼ 55%).
Download figure:
Standard image High-resolution imageA statistic comparison of normalized energy confinement, H98,y2, against CHe is plotted for three sets of database in figure 7, where blue diamonds are I-mode operation in He plasma running at favorable BT, black circles represent H-mode He plasma also with favorable BT and green diamonds are D plasma in I-mode regime at unfavorable BT. All data were collected from the upper-biased divertor configuration at Ip = 0.5 MA and BT = 2.4 T, with variables of ne = 2–4.5 × 10¹⁹ m−3 and Ploss = 1.8–4.5 MW. The CHe was found to play a dominant role in determining the energy confinement, as all cases were well aligned to decrease with increasing CHe. It should also be convincible to conclude that for He plasma the energy confinement of I-mode is comparable to that H-mode at similar CHe. The physics understanding on the impact of CHe on transition from L to I/H mode and energy confinement is still ongoing by analyzing the edge Er profile and its time evolution.

Figure 7. The energy confinement enhancement factor against helium concentration for He I-mode (blue diamond), He H-mode (black circle) and D I-mode (green diamond). Note that the He plasma experiments were performed at favorable BT configuration, while the D plasma was at unfavorable BT.
Download figure:
Standard image High-resolution image4. Comparison OF I- and H-mode operation
In the helium experiments with relatively high concentration, the repetitive I–H–I transition was frequently observed at constant power injection. The time trace of one typical discharge is given in figure 8, where the I–H–I transition occurred several times and finally evolved into stationary I-mode. The rapid increase of ne and Wdia, along with the sudden reduction in He-I signal at the same time revealed that the plasma entered into H-mode regime, which sustained for ∼40 ms and then transited into I-mode (judging by the appearance of WCM, which is not shown here). The time evolution of normalized energy confinement followed well with the I–H–I transition, with H98,y2 reaching ∼1.02 during H-mode and slightly reduced to ∼0.98 at I-mode, in good agreement with the conclusion that for He plasma the I-mode confinement is comparable to H-mode at similar CHe.

Figure 8. Time traces of several parameters for shot #94260 during repetitive I–H–I period and stationary I-mode, (a) plasma density (black), He-I line emission count (red) and total injected RF power (blue), (b) plasma stored energy and (c) normalized energy confinement. The two spikes in the right part of (b) are caused by NBI blips.
Download figure:
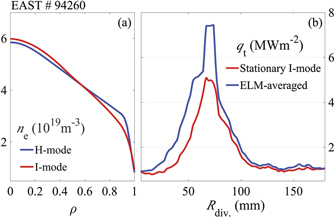
Standard image High-resolution imageIn the aspect of divertor power load control, the I-mode regime is more preferable for long-pulse high performance operation compared to H-mode, since the extremely high heat flux induced by ELMs is eliminated. A quantitative comparison between the ELM high heat flux accompanied with H-mode and the stationary heat flux at I-mode can be found in figure 9. The density profile shown in the left panel again confirmed the realization of I-mode as the particle transport barrier was not formed. In the right panel of figure 9, the blue curve represents the heat flux profile on upper-outer tungsten divertor, which was obtained by the heat flux computation code recently developed on EAST [18]. Note that the sampling rate of infra-red thermography diagnostics is only 100 Hz [19], which is much larger than the ELM characteristic time (typically ∼ 1 ms), resulting in underestimation of the peak heat flux induced by ELMs. Thus, the wording of ELM-averaged was used in this paper. Compared to the stationary heat flux at I-mode, ELM-averaged H-mode heat flux was much higher, increased by a factor of 1.5. In addition, the affected area of ELM-averaged heat flux was also wider than that of I-mode.
Figure 9. Comparison of density profile (a) and divertor heat flux (b) at I-mode (red) and H-mode (blue) for shot 94260.
Download figure:
Standard image High-resolution image
5. Summary and conclusion
The I-mode regime in helium plasma at favorable BT (ion ∇ B drift towards active X-point) is accompanied by the typical 30–90 kHz WCM and a ∼13 kHz ETRO. The longest stationary I-mode in helium has been obtained at Ip = 0.5 MA, BT = 2.4 T with a total injected power of 3.5 MW, lasting for ∼5.4 s without transitioning to H-mode. The physics mechanism sustaining the stationary I-mode in He plasma is found to be identical to that of D plasma, where the ETRO accompanied by the alternating between the ion diamagnetic drift turbulence and the electron diamagnetic drift turbulence is the key. It should be noted that the pulse length is only limited by the heating power duration. The L–I transition power threshold is lower than that of L–H at similar helium concentration (CHe). With increasing CHe, the required auxiliary heat power to access I-mode increases obviously and the energy confinement degrades linearly. Comparison of electron channel profile of ne and Te for low and high CHe cases indicates that reduction of energy confinement at high CHe would mainly come from the ion channel, which needs further investigation. The I-mode regime in helium plasma is comparable to H-mode with respect to energy confinement, and naturally owns the advantages of ELM-stability to eliminate high heat flux induced by ELMs and non-existence of particle transport barrier to facilitate impurity exhaust, which would make itself become one of the most promising operation scenarios for future fusion devices.
Acknowledgments
This work was supported by the National MCF Energy R&D Program (2019YFE03040000), the National Natural Science Foundation of China under Contract No. 12005262, and the Users with Excellence Program of Hefei Science Center CAS under Grant Nos. 2020HSC-UE009 and 2021HSC-UE018.