


Abstract
Kinetic profile predictions of ITER PFPO-1 plasmas require high accuracy in the central electron temperatures to be applied to the calculation of third harmonic electron cyclotron absorption. Correctly predicting the transition from L-mode to H-mode further requires precise estimates of the ion heat flux in the periphery of the plasma. Recent versions of the quasi-linear transport models TGLF and QuaLiKiz were tested against an extensive set of experimental results from ASDEX Upgrade (AUG) and JET-ILW, where the focus was put on AUG plasmas heated by ECRH. Spectra obtained from TGLF are compared to a set of linear gyrokinetic simulations performed with GKW. Electron and ion temperature profiles obtained with TGLF-SAT1geo show good agreement with the experimental profiles, but there is a slight tendency to underpredict central Te and Ti at high ratios Te/Ti. QuaLiKiz yields reasonable results for Te and Ti profiles in plasmas where the ion temperature gradient mode is dominant, but predicts a significantly too weak transport in the presence of dominant trapped electron modes in conditions of strong central electron heating.
Export citation and abstract BibTeX RIS

Original content from this work may be used under the terms of the Creative Commons Attribution 3.0 licence. Any further distribution of this work must maintain attribution to the author(s) and the title of the work, journal citation and DOI.
1. Introduction
The operational possibilities of the first pre-fusion power operation (PFPO-1) phase in ITER could be reduced by the limited amount of heating power that is available at this early stage. All electron cyclotron resonance heating (ECRH) launchers together will be able to deliver PECRH = 20 MW at 170 GW to the plasma [1], or PECRH = 30 MW if there is an upgrade of the ECRH system [2]. Also the early installation of 10 MW of ion cyclotron resonance heating (ICRH) has been considered in the research plan. Due to this low amount of heating power, H-mode operation in hydrogen plasmas seems to be unfeasible at half-field (7.5 MA and 2.65 T). The Martin-2008 scaling [3] together with the inverse mass dependence (PL–H ∝ m−1) of the L–H power threshold across different hydrogen isotopes [4–6] predicts a threshold power PL–H above the available heating power at Bt = 2.65 T, but only PL–H = 19 MW at Bt = 1.8 T. However, the advantage of a lower L–H threshold power at third field (5 MA and 1.8 T) comes at the expense of having to heat the plasma with third harmonic (X3) ECRH for which it was shown in [2] that the absorption efficiency is highly dependent on the central electron temperature, especially if ITER operates at low density. Therefore, good predictions of the EC absorption require precise estimates of central electron temperatures which are almost entirely determined by turbulent transport in the core plasma.
L–H transitions are experimentally expected to occur as a result of the sheared E × B flow induced by a negative radial electric field well  close to the edge of the plasma [7, 8]. Under the assumption of negligibly small parallel flow velocity (u∥ ≈ 0) and small poloidal flow velocity (up ≈ 0, as given by neoclassical theory) close to the edge, this electric field well is determined by
  , where pi and ni are the pressure and the density of the main ions, respectively. This can be connected to the experimental observation of the dominant role of the ion heat flux at the edge Qi,edge [9, 10] in determining the transition from L-mode to H-mode at a certain threshold value
  . Experimental results from ASDEX Upgrade and Alcator C-Mod yielded a multi-machine scaling law for this threshold edge ion heat flux that is given by [11]

In this equation,  is the threshold edge ion heat flux in MW,
  the line-averaged density in 1019 m−3, Bt the toroidal magnetic field in T and S the surface in m2. It should be noted here that it was shown in [12] that
  exhibits the same mass dependence as PL–H and it is
  . If one uses this threshold property of the edge ion heat flux to determine L–H transitions in PFPO-1, accurate turbulent transport models are needed since in purely ECRH plasmas, ion heat fluxes Qi are fully determined by the collisional electron–ion heat transfer (Qi ≈ Qei := ∫V
Pei dV) and thus, Qi,edge is fully determined by the electron and ion temperature profiles in combination with the density profile, and thereby by the turbulent transport in the core plasma.
. If one uses this threshold property of the edge ion heat flux to determine L–H transitions in PFPO-1, accurate turbulent transport models are needed since in purely ECRH plasmas, ion heat fluxes Qi are fully determined by the collisional electron–ion heat transfer (Qi ≈ Qei := ∫V
Pei dV) and thus, Qi,edge is fully determined by the electron and ion temperature profiles in combination with the density profile, and thereby by the turbulent transport in the core plasma.
Physics comprehensive calculations of local turbulent transport fluxes, as provided by non-linear multi-scale gyrokinetic simulations, have a too high computational cost for routine calculations of several millions of CPU hours for what practically corresponds to just a single time step in transport modelling calculation [13]. Quasi-linear transport models such as TGLF [14–17] and QuaLiKiz [18–20] provide a means for considerably faster computations of the temperature and density profiles. This paper presents a comparison of predictions of recent versions of TGLF and QuaLiKiz against experimental results from ASDEX Upgrade and JET with ITER-like wall (ILW) and a verification against a set of linear gyrokinetic simulations with GKW [21], with a particular emphasis on predictions of central electron temperatures and edge ion heat fluxes under conditions which can be expected to envelope those that will be present in ITER during PFPO-1.
In this paper, we shall call predictive whatever calculation of temperature or density profiles which is obtained as a result of the transport modelling. Of course, these calculations use some parameters as input which are taken from the experimental measurements, and thereby cannot be considered to be completely 'predictive', that is allowing predictions of the temperature and density profiles without using any information from the measurements. However, all along this paper, we shall adopt the practical solution of calling 'predicted' the temperature and density profiles which come out from the calculations and are evolved in time by the transport equations. This is in contrast to 'prescribed' when these profiles are completely taken from the measurements and kept fixed, like in a power balance analysis.
The database and the related experiments are described in section 2. Section 3 introduces the modelling setup that has been applied for the reported simulations. Interpretative modelling results showing power balance analyses are presented in section 4. This is followed by a comparison of experimental results and TGLF predictions (section 5) and QuaLiKiz predictions (section 6). Conclusions of this modelling work will be presented in section 7.
2. Experimental database
The database consists of 105 stationary plasma phases (Ploss = Pheat) in divertor configuration with a lower single null. All discharges were performed in the favourable magnetic configuration for L–H transitions with the grad-B drift and the curvature drift pointing towards the X-point. The elongation was in the range of κ = 1.5–1.7.
101 of the data points are dedicated discharges from ASDEX Upgrade which can be divided into the following groups of time intervals of sufficiently stationary plasma phases:
- 13 hydrogen (H) plasma phases with toroidal magnetic field Bt = 2.5 T and plasma current Ip = 0.8 MA, leading to an edge safety factor of q95 ≈ 5.3.
- 34 deuterium (D) plasma phases with Bt = 2.4–2.5 T and Ip = 0.8 MA, leading to an edge safety factor of q95 ≈ 5.3.
- 20 deuterium (D) plasma phases with Bt = 2.5 T and Ip = 1.2 MA, leading to an edge safety factor of q95 ≈ 3.7.
- 34 hydrogen (H) plasma phases with Bt = 2.5 T and Ip = 1.1–1.2 MA, leading to an edge safety factor of q95 ≈ 3.7.
To reproduce PFPO-1-like conditions, all ASDEX Upgrade discharges in the database were heated by ECRH only. Varying the ECRH power not continuously, but in discrete steps allowed us to obtain several steady-state data points out of a single shot (see time traces in figure 1 of various parameters for a 0.8 MA discharge featuring an ECRH power ramp-down and a 1.2 MA discharge featuring an ECRH power ramp-up, both with hydrogen plasmas). Neutral beam injection (NBI) blips were used to obtain measurements of the toroidal rotation and the ion temperature Ti via charge exchange recombination spectroscopy (CXRS) (see third panel in figure 1). It was experimentally shown in [22] that the average toroidal rotation after the beam blip deviates only marginally from the true intrinsic rotation and that NBI blips are short enough to not considerably change the shape of the toroidal rotation profile. Electron density profiles were obtained by combining experimentally measured data from deuterium-cyanide (DCN) laser interferometry, Thomson scattering and the lithium beam diagnostic via integrated data analysis (IDA) [23]. Information on the Te-profiles was obtained from Thomson scattering and electron cyclotron emission (ECE) which are also combined via IDA. Only for central electron temperatures, raw ECE data was used for some plasmas. Profiles for Te and ne were averaged over at least 70 ms, covering multiple sawtooth periods.

Figure 1. Time traces of different plasma parameters for the hydrogen discharges #36774 (left column) at 0.8 MA and #38175 (right column) at 1.2 MA. From top to bottom: plasma current Ip, ECRH power PECRH and kinetic plasma energy WMHD, NBI power PNBI and total radiated power Prad and the line-averaged density from DCN interferometry in 1019 m−3 along two horizontal lines of sight, one passing practically through the magnetic axis, and one with tangency radius at ρpol = 0.85.
Download figure:
Standard image High-resolution imageAdditionally to these 101 AUG data points, the database also comprises four JET-ILW plasmas in deuterium from shots #95465, #95846, #95848 and #95850. The magnetic field in these shots was Bt = 3.3 T and the plasma current Ip = 2.0 MA, resulting in an edge safety factor of q95 = 4.8–4.9. The dominant heating method in these shots was ICRH, with powers from four to 6 MW and with an H minority concentration of 3–6%. Shots #95846, #95848 and #95850 also contain a small amount of 1.35 MW of NBI heating. In discharge #95465, NBI blips have been added for ion temperature and rotation measurements. In all four discharges, the fraction of the auxiliary electron heating power is at least 49% of the total auxiliary heating power Paux = PICRH + PNBI. For the JET-ILW plasmas in the database, the electron temperature profiles were obtained from measurements of the ECE diagnostic and the high resolution Thomson scattering (HRTS) diagnostic [24]. HRTS measurements were also used to determine the density profile. Both, ne-profiles and Te-profiles were obtained by averaging experimental data over at least 400 ms. Profiles for the ion temperature Ti and the toroidal plasma rotation were determined via charge exchange on neon and deuterium (D-α charge exchange).
Figure 2 gives an overview over all 105 plasmas in the database. As the horizontal lines show, the database includes AUG plasmas with the same ECRH power per surface element (S-scaling) like PFPO-1 plasmas that are heated with 20 MW or 30 MW of ECRH power. The plot also shows that all plasmas in the database are at comparably low line-averaged densities in the range of  , where nG is the Greenwald density limit. Such low densities are necessary in this analysis because at high densities, the electron and ion heat fluxes cannot be separated any more because of
  . Furthermore, access to H-mode in PFPO-1 requires very low density since according to the scaling law in [10], the minimum heating power
  to achieve H-mode operation at one-third field in ITER is achieved at
  . Integrated modelling results presented in [25] confirm this low density at the minimum PL–H. Nevertheless, the plasmas in the database cover a wide range of different plasma conditions with the temperature ratio in the core (around ρtor = 0.3) in the range of Te/Ti = 1.3–5.5 and Te/Ti = 1.1–3.5 around mid-radius, high Te/Ti enabled by the comparably large available ECRH power of ASDEX Upgrade, which can exceed 5 MW [26]. As it is described in section 5, variation in ECRH power and density allowed us to explore conditions with locally dominant ion temperature gradient (ITG), electron temperature gradient (ETG) and trapped electron modes (TEM). Although the focus of this study is on L-mode plasmas, the database also contains plasmas in H-mode, particularly in deuterium, which has a lower L–H power threshold as compared to hydrogen. Consistent with [9], plasmas in I phase [27] are treated as L-mode plasmas, since, differently from H-mode and similarly to L-mode, this phase is not characterized by the development of a strong ion temperature pedestal.

Figure 2. Distribution of the data points over different line-averaged densities and auxiliary heating powers. The height of the ordinate for the JET-ILW data points was adjusted such that AUG plasmas and JET-ILW plasmas at the same vertical position in the plot exhibit the same heating power per surface element (S-scaling).
Download figure:
Standard image High-resolution image3. Modelling setup
Simulations were performed with version seven of the ASTRA [28] modelling suite that was coupled to the free-boundary equilibrium solver SPIDER [29] as described in [30]. The grid of this ASTRA version is based on the normalized toroidal flux radius ![$\rho {:=}\sqrt{{\Phi}/{{\Phi}}_{\mathrm{B}}}\in \left[0,1\right]$](https://content.cld.iop.org/journals/0029-5515/61/6/066035/revision3/nfabfc9cieqn12.gif) (Φ being the toroidal magnetic flux with value ΦB
at the separatrix).
(Φ being the toroidal magnetic flux with value ΦB
at the separatrix).
For the AUG plasmas with ECRH, simulations were performed with 101 radial grid points. The ECRH power deposition PECRH(ρ) was determined with the beam tracing code TORBEAM [31]. RABBIT [32] was used to model the (negligibly small) NBI heating of electrons and ions. When measurements of the tungsten (W) concentration in the plasma were available, these were used to reconstruct the radiation power Prad(ρ) [33]. When no measurements were available, Prad(ρ) was determined under the assumption of a W concentration of 5 × 10⁻⁵, which is a typical value in these plasma conditions from measurements in similar discharges in which measurements are available. In AUG, an accurate determination of light impurity density profiles by active CXRS is practically not possible in the absence of continuous NBI heating. For this reason, in the AUG discharges, which only have ECRH and NBI blips, only an estimation of a radially averaged value of the effective charge number Zeff was possible in a subset of cases by IDA with a Bayesian approach [23], considering the bremsstrahlung background of the CXRS spectra. For the cases in which impurity data are absent, we have considered plasma phases with similar parameters and in which a reconstructed value of Zeff is available. In all AUG simulations, one effective impurity was included and determined based on the effective charge Zeff. This effective impurity was given the mass and charge of boron, main light impurity in AUG, and assumed to have a density profile being proportional to the electron density profile (nimp(ρ) ∝ ne(ρ)).
For JET-ILW plasmas, simulations were performed with 131 radial grid points. The ICRH power deposition and the density profile of fast ions nfast(ρ) were determined with PION [34] that allows for self-consistent computations of the non-Maxwellian velocity distribution and the ICRH power deposition. Radiation power profiles Prad(ρ) for JET-ILW plasmas were obtained from bolometry measurements. Furthermore, two impurities, namely beryllium and nickel, were considered for JET-ILW simulations for which the density profiles were assumed to be nBe(ρ) = 0.03 ⋅ ne(ρ) and nNi(ρ) = 0.002 ⋅ ne(ρ).
The power balance simulations (for AUG and JET) described in section 4 were performed with prescribed experimental density and temperature profiles which allow an interpretative analysis of experimental data. Simulations with evolving density and/or temperature profiles, i.e. predictive modelling simulations, are described in sections 5 and 6. In these predictive modelling simulations, conductivities for heat

were calculated as the sum of a neoclassical part χneo determined with NCLASS [35], an effective conductivity χturb determined by a quasi-linear turbulent transport model and an artificial increase χsaw in the centre to model an average sawtooth effect up to ρtor = 0.2. Values of χsaw range from order of 0.1 m2 s−1 to order of 1 m2 s−1 depending on transport channel and conditions. For the AUG plasmas, the time-discrete redistribution of the current was modelled according to the Kadomtsev relaxation model [36] with a sawtooth period of τsaw = 0.05 s. The experimentally determined sawtooth inversion radius is usually located between ρtor ≃ 0.3 and ρtor ≃ 0.35. For particle transport, also the ware pinch [37, 38] was taken into account.
4. Power balance analysis
In power balance calculations, Te(ρ), Ti(ρ) and ne(ρ) are assigned to their experimental values which allows one to determine the experimental electron and ion heat fluxes in ASTRA. Figure 3 shows the power distribution profiles and the resulting heat flux profiles for an ASDEX Upgrade plasma heated by ECRH. ECRH, for which the power was mostly deposited close to the centre at ρ ⩽ 0.2, and Ohmic heating POhm are the heating sources of the electron heat channel. Note the sharp increase in Qe,tot at radial positions where ECRH power is deposited. The collisional heat exchange between electron and ion heat channel Pei is the only source of heat in the ion channel. For plasmas with (main and impurity) ion species j with ion density ni,j , the expression of the electron to ion equipartition power density in MW m−3 is

where temperatures are in keV, densities in 1019 m−3, log Λ is the Coulomb logarithm and where Zj and Aj are the charge and the mass numbers of ion species j, respectively.

Figure 3. Top: radial distribution of different contributions to the heating power for a hydrogen plasma in ASDEX Upgrade. Bottom: radial profiles of the electron heat flux Qe,tot and the ion heat flux Qi,tot. The text in the plots provides the values of the total auxiliary heating power and of the line averaged density.
Download figure:
Standard image High-resolution imageSince the edge ion heat flux Qi,edge = Qi(ρ = 0.95) is approximately the volume integral over this collisional electron–ion heat exchange, errors in the ne-, Te- and Ti-profiles result in errors in Qi,edge. A sensitivity analysis with respect to the temperature profiles is given in figure 4. These plots show the effect on Qi,edge when the whole temperature profiles are increased or decreased by up to 15%. One observes that Qi,edge increases with increasing Te at both ECRH power levels. However, Qi,edge is less prone to uncertainties in the Te profile at higher ECRH power due to the non-monotonicity of Pei(Te) at fixed Ti and the fact that Te/Ti is higher at PECRH = 1.1 MW than at PECRH = 0.5 MW. As the right plot of figure 4 shows, overestimations of the ion temperature lead to underestimations of the edge ion heat flux since the difference (Te − Ti) decreases with increasing ion temperature. Note that (neglecting small effects from the Coulomb logarithm), the error in Pei is s linear function of the error in the ion temperature ΔTi for which the slope is steeper at lower electron temperatures (the absolute error is  ). This makes Qi,edge less prone to uncertainties in the Ti profile at higher ECRH powers.

Figure 4. Sensitivity analysis for the edge ion heat flux for a low-density hydrogen AUG plasma. Left: deviations in Qi,edge as a result of a deviation of the electron temperature at fixed Ti. Right: deviations in Qi,edge as a result of a deviation of the ion temperature at fixed Te.
Download figure:
Standard image High-resolution imageAuxiliary ICRH and NBI heating applied in the JET-ILW discharges do not exclusively heat the electrons, but there is also a collisional energy transfer from the fast ion population to all (thermal) ions Pdci. Electrons are heated directly by Pde, by collisional energy transfer from the fast ion population Pdce and by Ohmic heating POhm (see figure 5, left). Like in AUG plasmas, there is also a collisional energy transfer Pei between thermal electrons and ions. However, as the heat flux profiles at the right of figure 5 show, the major contribution to the ion heat flux is not the collisional contribution from the electrons Pei, but the one from the fast ions Pdci. This is a major difference to baseline PFPO-1 discharges that are heated by ECRH only, but the inclusion of the JET-ILW plasmas allows us to provide an analysis over a wider range of different plasma conditions, providing additional points with electron to ion temperature ratio closer to 1 as compared to high ECRH power conditions at AUG.

Figure 5. Left: radial distribution of different contributions to the heating power for a deuterium plasma in JET-ILW. Right: radial profiles of the electron heat flux Qe,tot, the ion heat flux Qi,tot and the collisional electron–ion heat exchange Qei. The text in the plots provides the values of the total auxiliary heating power and of the line averaged density.
Download figure:
Standard image High-resolution image5. Comparison between experiment and TGLF simulations
Simulations presented in this section were performed with the quasi-linear transport model TGLF with saturation rule SAT1 [15, 16], with a recent improvement in the description of geometrical effects, whose complete expression can be found in [17]. We shall refer to this recent version of TGLF-SAT1 as TGLF-SAT1geo, which is also calibrated to a set of CGYRO nonlinear simulations (units = 'CGYRO' in the TGLF input file). In section 5.2, also results from the original version of SAT1, which does not include this geometric factor and is fitted against a set of GYRO simulations [15, 16], are shown. In general, all along the paper, if not stated otherwise, whenever the TGLF model is applied, this refers to the version TGLF-SAT1geo.
5.1. Density profile
For ASDEX Upgrade plasmas, a set of ASTRA-TGLF simulations with evolving density, evolving temperature and evolving poloidal flux profiles was performed with the boundary at ρB = 0.95. Cold gas puff neutrals were used as the major particle source in these simulations. The source of cold gas puff neutrals was adjusted at ρ ⩾ 0.61 such that the total number of particles in experiment and simulation deviate from each other by less than 4% (see figure 6). We recall that ρ = 0.95 is the radial location where the ion heat flux analysis at the L–H transition was performed in [10, 11].

Figure 6. Experimental and predicted density profiles together with the particle source Se. Thomson scattering data was adjusted to match the total particle number of the plasma.
Download figure:
Standard image High-resolution imageComparing the predicted density profile from TGLF-SAT1geo with experimental profiles from Thomson scattering and IDA, one observes reasonable agreement between experiment and simulation. As it will be shown in section 5.6, TGLF is able to reproduce the isotope effect on the density profile and provides good density profile predictions for hydrogen as well as for deuterium.
For JET-ILW plasmas, all simulations were performed with the boundary at ρB = 0.82. The particle source in the simulation domain [0; 0.82] is negligibly small such that the density profiles evolve to meet the zero flux condition (Γe ≈ 0, where Γe is the particle flux for electrons). One observes (see representative example in figure 7) that in JET simulations with evolving density, temperature and poloidal flux profiles, predicted density profiles are very close to the measured profiles from HRTS. There is only a small tendency to slightly overpredict the turbulent inward pinch, which leads to an overestimation of the normalized logarithmic gradient of density R/Lne around mid-radius. As it will be shown in section 5.3, TGLF also overestimates R/LTe in the JET simulations. This observation together with the results presented in [44] can explain why TGLF can predict a too large stationary R/Lne in the considered JET-ILW plasmas. It was shown in [44] that the stationary R/Lne satisfying Γe = 0 increases with increasing R/LTe due to the increasing thermodiffusive pinch. In JET simulations with prescribed temperature profiles, i.e. simulations maintaining the correct normalized logarithmic gradients of Te and Ti (within the experimental uncertainty), the predicted ne-profiles match extremely well the HRTS profiles. Moreover, by performing a set of simulations with different prescribed current density and safety factor profiles, or with the inclusion of sawtooth relaxations of the current density profile, we have also observed a sensitivity of the predicted density profile peaking on the shape of the safety factor profile. The simulations presented in figure 7 have been obtained with evolving current density profiles, without the inclusion of any sawtooth relaxation in the centre, leading to a stationary safety factor profile in the ASTRA-SPIDER calculation which is in very good agreement with the one obtained by the EFIT magnetic equilibrium reconstruction.
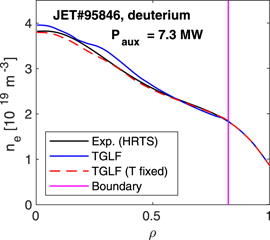
Figure 7. Experimental and predicted density profiles for a JET plasma with 6 MW of ICRH power and 1.35 MW of NBI heating power. Simulations, obtained with the TGLF-SAT1geo transport model, with evolving temperature profiles and with prescribed temperature profiles are shown.
Download figure:
Standard image High-resolution image5.2. Temperature profiles close to the edge
There is a large interest among the scientific community to push the boundary as close as possible to the separatrix [16, 39]. In previous versions of TGLF, several problems limited the possibilities of performing simulations with a boundary position ρB close to 1 (e.g. [40]).
Like its predecessor GLF23, TGLF cannot be expected to reproduce the edge transport barrier (ETB) that is present in H-modes [39]. One can see in the left plot of figure 8 that the TGLF-SAT1geo version with incorporated geometric factor still fails to reproduce the pedestal in the Te-profile. The same observation is made in the ion temperature profile. In simulations which have the boundary condition in the ETB region at ρB = 0.95, electron and ion temperatures are systematically underpredicted not only close to the boundary, but over the full radius ρ ⩽ ρB in H-mode conditions. This is a result of the stiffness of turbulent transport that is reproduced by gyro-Landau fluid models such as TGLF, as shown in [41]. As the blue curve in figure 8 shows, significantly better predictions are obtained when the boundary conditions is placed on the pedestal top at ρB = 0.82. For the presented study, the missing turbulent transport suppression in the ETB region in TGLF-SAT1geo is not a major problem since the focus is on the prediction of Qi,edge in L-mode plasmas. Recent simulations with an integrated modelling workflow, which applies TGLF in the core plasma and also includes a pedestal transport model and MHD pedestal stability calculations, have allowed the modelling of H-mode plasmas over the entire cross-section [42].

Figure 8. Left: profiles for the electron temperature and the electron heat conductivity χe of a deuterium H-mode plasma with the TGLF-SAT1geo transport model. Results from simulations with two different boundary conditions are shown. Right: profiles of Te and χe of a hydrogen L-mode plasma at a low plasma current of Ip = 0.8 MA. Results from simulations with the original version of TGLF-SAT1 and the newer TGLF-SAT1geo version with the improved geometric factor are compared.
Download figure:
Standard image High-resolution imageIn L-mode plasmas, previous versions of TGLF and GLF23 are known to underestimate turbulent heat transport close to the edge, especially at low plasma current and high q95 [16, 43]. It was shown in [16] that early versions of TGLF-SAT1 still underpredict turbulent transport fluxes close to the edge (although less strong than TGLF-SAT0). The right plot in figure 8 visualizes this shortage of edge electron heat transport and the resulting pedestal-like structure in the Te-profile for the original version of TGLF-SAT1. An analogous observation is made for the predicted ion heat transport and the ion temperature profile. One observes that with TGLF-SAT1geo with improved geometry factor, significantly better predictions of the heat conductivities χe and χi close to the edge are obtained than with the original TGLF-SAT1. As a result, electron and ion temperature profiles predicted with the more recent TGLF-SAT1geo smoothly follow the experimental profiles.
5.3. Electron temperature predictions
Electron temperature predictions close to the edge were considered in the previous section. This section will focus on electron temperatures closer to the centre of the plasma for which accurate estimates are needed to ensure good predictions of third harmonic ECRH absorption in PFPO-1.
The left plot in figure 9 shows a comparison between experimental and predicted electron temperatures at ρ = 0.32. This radial position was chosen since it is close to the sawtooth inversion radius of many plasmas in the database which makes the analysis less dependent on the sawtooth model and more specific to the transport model. Furthermore, at the highest ECRH powers, indications for significant amounts of superthermal particles are found at positions closer to the magnetic axis. The figure contains all 105 data points in the database. To avoid systematic underestimations of H-mode Te-profiles as described in section 5.2, simulations for H-mode plasmas in AUG were preformed with boundary position ρB = 0.82 whereas simulations for L-mode plasmas in AUG were performed with ρB = 0.95. Simulations for the JET-ILW plasmas were all performed with ρB = 0.82.

Figure 9. Left: comparison between experimental and predicted electron temperatures of simulations with evolving temperature and density profiles. Right: relative deviation (Te(TGLF) − Te(Exp))/Te(Exp) between experimental and predicted electron temperatures as a function of Ti/Te. The colours mark the three different line-averaged densities. The simulations have been performed with the TGLF-SAT1geo transport model.
Download figure:
Standard image High-resolution imageOne observes that low electron temperatures are well-predicted whereas at high Te, there is a tendency to underestimate Te(ρ = 0.32). A possible explanation is provided by the right plot of figure 9 that shows that TGLF could not correctly take into account the temperature ratio Ti/Te. Here the temperature deviation in the central region (ρ = 0.32) is plotted as a function of the ion to electron temperature ratio Ti/Te at ρ = 0.6, that is, at a radial location which is in the middle of the confinement region, and thereby in the middle between the central location and the radial location of the boundary condition in the simulations. The main idea behind this comparison is connected with the consideration that in the transport modelling the predicted values in the central region of the plasma are determined by the level of transport coefficients in the confinement region (that is, around mid-radius), which also determine the temperature gradients in this region. Therefore the correlation between the temperature deviation in the centre has been examined as a function of various parameters around ρ = 0.6. We have found that there is a tendency to underestimate central electron temperatures at low Ti/Te, whereas, at high Ti/Te, one observes a slight overprediction of central Te. There is a clear correlation between the relative deviation (Te(TGLF) − Te(Exp))/Te(Exp) at ρ = 0.32 and Ti/Te with a Pearson correlation coefficient of 0.63.
This dependence on Ti/Te observed in electron temperature predictions has several consequences: since Ti/Te correlates strongly with the collisionality  in the experiment, there is also an analogous ν*-dependence in TGLF-SAT1geo with underestimations of Te(ρ = 0.32) at low collisionality and a tendency to overestimate Te(ρ = 0.32) at high collisionality (Pearson correlation between (Te(TGLF) − Te(Exp))/Te(Exp) at ρ = 0.32 and ν*(ρ = 0.6) is 0.41). An analogous observation was already made for TGLF with saturation rule SAT0 and GLF23 in [39]. It was also shown in [39] that this collisionality dependence is already weaker in TGLF-SAT0 than in GLF23 due to the more sophisticated model of trapped particles in TGLF. Nevertheless, the present study shows that a dependence on the collisionality of the deviation of the TGLF-SAT1geo predictions for the experimental electron temperature is still present, with a slight overestimation of the central electron temperature at high collisionality and an underestimation at low collisionality.
A further consequence of this dependence on Ti/Te is the dependence of the predictive capability of Te(ρ = 0.32) on the heating method. Since in the JET-ILW plasmas with ICRH, the temperature profiles are closer together than in AUG plasmas with ECRH, one observes slightly overpredicted Te-profiles in JET simulations. Moreover, as the colour coding in figure 9 shows, there is a strong tendency to underestimate Te-profiles especially at low line-averaged density which is the result of the weaker coupling between electron and ion heat channel at low density ( ). Figure 10 shows the example of such a plasma at low line-averaged density and thus low Ti/Te in this data set. This plasma phase, corresponding to the time window from 5.25 s to 5.55 s in the AUG discharge ♯36982, is characterized by an ECRH power of 2.7 MW, with a temperature ratio Te/Ti = 3.8 at ρ = 0.5 and Te/Ti ≃ 6.5 close to the magnetic axis.

Figure 10. Experimental and predicted (with TGLF-SAT1geo) electron temperature profiles Te(ρ) and electron heat conductivities χe for a deuterium AUG plasma at q95 ≈ 5.
Download figure:
Standard image High-resolution imageRestricting the analysis to more ITER-PFPO-1 specific heating conditions only for AUG plasmas with 0.8 MW ⩽ PECRH ⩽ 1.8 MW (1.3 MW in AUG lead to the same heating power per surface element as 20 MW in ITER), one observes a tendency to underestimate Te(ρ = 0.32) with a relative deviation of (−10 ± 6)%. Therefore, one can expect a slight underestimation of the absorbed X3 ECRH power in PFPO-1 simulations. However, it is worth to note that in pure Ohmic plasmas (PECRH = 0 MW), predictions of Te(ρ = 0.32) are very good with a relative deviation of only (−3 ± 4)% since in these plasmas, electron and ion temperatures are closer to each other than at high ECRH power. This is a valuable observation since especially at low ECRH powers/low electron temperatures, third harmonic ECRH absorption is very sensitive to central electron temperatures [2]. Accurate central electron temperature predictions ensure precise estimates of X3 central ECRH absorption in Ohmic plasmas and plasmas at very low PECRH.
5.4. Ion temperature predictions
Since the cross section for fusion reactions depends strongly on the temperature of the ions in the plasma, accurate predictions of Ti are necessary especially for simulations of the fusion power operation phase in ITER. It was already shown in [39] that with TGLF-SAT0, ion temperature profiles, and therefore also neutron yields, are better predicted than with GLF23. As described in section 5.2, TGLF-SAT1geo with the sophisticated geometric factor further improves the predictive capability close to the edge and predicts ion temperature profiles following very well the experimental profiles close to the edge. This section will therefore focus on the ion temperature predictions around mid-radius and in the centre of the plasma.
The left plot in figure 11 compares the experimental ion heat conductivities to the effective ion heat conductivities determined from TGLF-SAT1geo being applied to the measured experimental profiles. One observes that in the experiment, χi shows almost no dependence on Te/Ti whereas TGLF predicts significantly increasing ion heat transport with increasing Te/Ti. This results in significant overestimations of ion heat fluxes at high Te/Ti. Therefore, especially in plasmas at low density and high ECRH power (and thus, high Te/Ti), central ion temperatures are considerably underestimated. The JET-ILW plasmas in the database, in contrast, feature extremely good predictions of the central ion temperatures, with only very small overpredictions (see example in the right plot of figure 11). This is a consequence of the considerable amount of auxiliary heating power directly deposited to the ion heat channel which results in a comparably low Te/Ti, closer to 1.

Figure 11. Left: TGLF-SAT1geo ion heat conductivities χi (averaged over theradial interval ρ ∈ [0.4, 0.8]) for hydrogen discharges at ASDEX Upgrade. Effective ion heat conductivities from TGLF-SAT1geo were determined with the experimental profiles as input. Right: temperature profiles for a JET-ILW plasma heated by ICRH. The simulation was performed with evolving temperature profiles and evolving density profile.
Download figure:
Standard image High-resolution imageAs outlined in the previous section, a dependence on Te/Ti in the predictive capability leads to an analogous dependence on the collisionality  . One observes a strong tendency in TGLF-SAT1geo to overestimate ion heat transport at low collisionality and underestimate ion heat transport at high collisionality. In the examination of the correlations between the deviation of the ion temperature in the central region (ρ = 0.32) and the plasma parameters in the confinement region around ρ = 0.6, as motivated and already described for the electron temperature simulations in the previous subsection, a Pearson correlation of 0.48 between (Ti(TGLF) − Ti(Exp))/Ti(Exp) at ρ = 0.32 and ν*(ρ = 0.6) has been found. Because of the strong dependence of the electron–ion energy exchange on the density (
 ), the Te/Ti-dependence translates also into a
  -dependence in ECRH plasmas with underestimations of Ti especially at low line-averaged density and overestimations of Ti especially at high line-averaged density (see figure 12).

Figure 12. Histograms of the relative deviation (Ti(TGLF) − Ti(Exp))/Ti(Exp) of the predicted ion temperature from the experimental ion temperature for all 101 ASDEX Upgrade plasmas in the database. For H-mode plasmas, simulations with boundary ρB = 0.82 are considered; for L-mode plasmas, simulations with boundary ρB = 0.95 are considered. All the simulations have been performed with the TGLF-SAT1geo transport model.
Download figure:
Standard image High-resolution imageConsidering all ITER-like heated AUG plasmas with PECRH ∈ [0.8 MW; 1.8 MW] in the database, predictions of Ti(ρ = 0.32) are very good with a relative deviation of (−1 ± 9)% on average (±standard deviation).
The present results can also be considered in combination with recent applications of TGLF-SAT1 in conditions with larger ion heating fraction than those modelled in this study. With dominant ion heating, the transport model has been found to predict a stiffness in the relation between the ion heat flux and the logarithmic ITG which is weaker than the experiment and than companion gyrokinetic simulations [45]. Thereby the TGLF-SAT1 model appears to provide increasingly good predictions of the ion temperature in conditions where the ion to electron heating fractions are comparable and where the dominant unstable modes are provided by a combination of ITG and TEM, like in the present study in conditions of Te ⩾ Ti. In contrast, conditions with dominant ion heating usually feature an overprediction of the ion temperature by TGLF [45] and conditions with largely dominant electron heating and large electron to ion temperature ratio show an overprediction of the ion heat transport. The present picture appears to be consistent also with the good performance of TGLF-SAT1geo in the prediction of AUG H-mode plasmas with comparable ion and electron heating fractions, recently reported in [46].
5.5. Edge ion heat fluxes
Correctly predicting the transition from L-mode to H-mode requires a reliable prediction of the edge ion heat flux Qi,edge, which is evaluated here at ρ = 0.95, consistently with [10]. The edge electron heat flux will not be examined in detail here since it was shown to not play a relevant role in the occurrence of L–H transitions [10].
Figure 13 compares the experimental edge ion heat fluxes, obtained from power balance simulations, to the predicted edge ion heat fluxes from ASTRA-TGLF simulations. One observes very good predictions of Qi,edge (except for one outlier that can be explained by its relatively high density of  leading to a high sensitivity of Pei on the temperature profiles) with a slight tendency to underestimate edge ion heat fluxes. On average (±standard deviation), the relative deviation between experiment and simulation is (Qi,edge(TGLF) − Qi,edge(Exp))/Qi,edge(Exp) = (−8 ± 13)% in simulations with evolving density and temperature profiles. Prescribing the density profile does not significantly improve the prediction quality (see left plot in figure 13).

Figure 13. Left: comparison between experimental and predicted edge ion heat fluxes for 101 ASDEX Upgrade data points. Error bars are shown for hydrogen plasmas at q95 ≈ 5. Right: comparison of experimental and predicted edge ion heat fluxes for an ASDEX Upgrade discharge. Simulations with prescribed density and simulations with evolving density are shown, both with boundary condition at ρB = 0.95. All the simulations have been performed with the TGLF-SAT1geo transport model.
Download figure:
Standard image High-resolution imageAs discussed in figure 4, the edge ion heat flux is more prone to errors in the temperature profiles at low ECRH power. Nevertheless, very precise predictions with only small underestimations are observed also at comparably low ECRH powers of PECRH ∈ [0.8 MW; 1.8 MW] with a relative deviation of (−9 ± 10)%. Rather underestimating than overestimating Qi,edge in this power range makes predictions of L–H transitions in PFPO-1 a bit conservative, i.e. if ASTRA-TGLF predicts  , one can assume with an increased level of confidence that this condition will also be satisfied in reality.
Restricting the analysis to all ECRH L-mode plasmas in the database, one finds a relative deviation of (−10 ± 14)%. This shows again the high accuracy (with small underpredictions) of estimations of Qi,edge to be applied to the prediction of L–H transitions.
5.6. Isotope effects
The database contains AUG plasmas in hydrogen as well as in deuterium which allows one to examine the predicted mass dependence in ASTRA-TGLF simulations. Experimentally, isotope effects in ASDEX Upgrade were extensively studied in [47] where several isotope mass dependent mechanisms were identified which can influence the energy confinement. Considering the presence of such a mass dependence in turbulent transport, it is considered to be problematic for ITER PFPO-1 simulations that TGLF is exclusively calibrated on deuterium plasmas although all discharges in PFPO-1 will be performed either in hydrogen or in helium [25]. This section will therefore examine the mass dependence predicted by TGLF-SAT1geo that is calibrated against ten CGYRO simulations of deuterium plasmas [17].
Gyrokinetic simulations and analytic theory presented in [48] suggest decreasing stationary R/Lne with increasing main ion mass mi in the core plasma. It is explained by the reduced turbulent inward pinch with increasing mi, caused by the increasing collisional contribution of trapped electrons to outwards-directed convective particle transport and the increased reduction of the curvature pinch with increasing mass mi, produced by the increased effective collisionality with increasing ion mass. As the plot at the top of figure 14 shows, this behaviour is indeed found in the experiment with lower R/Lne for deuterium than for hydrogen. The plot also shows that TGLF is capable of reproducing this mass dependence in the particle transport. Note that TGLF also reproduces the flattening of the density profile with increasing ECRH power that was investigated in [49].

Figure 14. Top: normalized logarithmic gradients of the density R/Lne as obtained from Thomson scattering and TGLF simulations. Bottom: ratio  , where the electron heat conductivity χe was averaged over the interval 0.36 ⩽ ρ ⩽ 0.80.
Download figure:
Standard image High-resolution imageFor the heat conductivity χ, the gyroBohm scaling predicts χ/T3/2 to be a constant increasing with the main ion mass ( ). Considering the experimental results at the bottom of figure 14, one indeed finds
  to be approximately constant over all ECRH power levels. TGLF approximately reproduces the constant behaviour of
  (with slight overestimations of
  at
at  as discussed in section 5.3). Moreover,
  from the power balance decreases significantly from hydrogen to deuterium discharges, and this variation is reasonably well reproduced by TGLF in the corresponding ASTRA simulations, as shown in figure 14. Such an anti-gyroBohm behaviour is also observed for plasmas at higher density. In companion ASTRA calculations in which the main ion mass is doubled from the hydrogen mass to the deuterium mass in the TGLF input, the resulting electron heat conductivities also decrease, although by a more limited amount, between 5% and 10%. This isotopic effect can be explained by the collisional stabilization of TEM leading to decreasing electron heat transport with increasing main ion mass, since the stabilizing impact of collisionality is stronger with heavier ion mass, that is, at smaller ion thermal velocity [50].
As shown in figure 15, in the predictions of the ion temperature, the replacement of hydrogen mass with deuterium mass leads to a small increase of the TGLF ion heat conductivity in the confinement region, by about 10% on average in the present AUG dataset. This weak positive dependence can be still considered to be acceptable in reproducing the AUG experimental observations in these conditions of dominant electron heating, where the experimental power balance ion heat conductivities are observed not to show a strong dependence on mass, consistent with previous studies [47, 51]. This behaviour of the TGLF model is also satisfactory in H-mode conditions with comparable ion and electron heating, where the TGLF modelling of H plasmas with H mass only leads to a small overprediction of the ion temperature [46]. Here the dominant effect in the core is consistently observed to be produced by the presence of different fast ion populations in H and D plasmas in both JET [45] and AUG [46]. Therefore, it can be also expected that in conditions of dominant ion heating in H plasmas, the use of H mass in TGLF for the modelling of the ion temperature can lead to a more significant overprediction of the ion temperature, as a consequence of the quasi-linear properties of the TGLF model which, in conditions of largely dominant ITG modes, more closely follow the gyro-Bohm scaling [45].

Figure 15. Fraction of occurrences as a function of the relative difference between the TGLF-SAT1geo ion heat conductivity in the confinement region when D mass is used in replacement of the H mass and the corresponding ion heat conductivity with the actual H mass. In the largest amount of cases, the replacement of the H mass with the D mass leads to an increase of the ion heat conductivity by about 10% only.
Download figure:
Standard image High-resolution imageWe conclude that TGLF-SAT1geo is well suited to be also applied to other isotopes than just deuterium in conditions of dominant electron heating like those of AUG and JET considered in this work. In these conditions, the replacement of the hydrogen mass with the deuterium mass in the simulation of hydrogen plasma can lead to a slight overestimate of the central electron temperature but also a better prediction of the ion temperature, particularly with increasing ion heating fraction. A strong difference between predictions with hydrogen and with deuterium masses used as input of the TGLF model should be interpreted as the sign that the model is applied in conditions which go outside the domain over which it has been tested in the present work, and for which the present results cannot guarantee the reliability.
5.7. Spectra of growth rate and real frequency, comparison with gyrokinetic calculations
This section will analyse the growth rates γ and the real frequencies ωr predicted by TGLF after convergence of the simulations. A short qualitative analysis is followed by a more quantitative comparison between TGLF spectra and linear gyrokinetic calculations performed with the GKW code [52].
Figure 16 shows the dominant micro-instability (the instability with the highest γ/(kθ ρs), where kθ is the poloidal wavenumber of the considered mode and ρs is the sound ion gyroradius) at two radial positions, r/a = 0.50 and r/a = 0.80 for all hydrogen plasmas in the database. Two type of space diagrams are considered, one in the engineering parameters ECRH power and density (figure 16, left and middle plots) and one in the physically dimensionless parameters provided by the electron to ion temperature ratio and the electron–ion collision frequency normalized to the sound speed divided by the connection length qR. For convenience of the reader, this normalized collisionality is still expressed with usual practical dimensions for densities and temperatures. At these radial positions, all H plasmas in the database are either ITG-dominated or TEM-dominated (at other radial positions, also ETG-dominated plasmas are found). TEM-dominance is predominantly observed at high ECRH power because the normalized logarithmic gradient of the electron temperature R/LTe increases with increasing ECRH power which drives the TEM instabilities. ITG-dominated plasmas, on the other hand, are predominantly observed at high densities. This is explained by the collisionality (which increases with increasing density) that leads to a stabilization of TEM [53] whereas ITG modes are more weakly affected by collisions. Additionally, the temperature ratio Te/Ti increases with increasing ECRH power and decreases with increasing density which supports the observed TEM- and ITG-regimes. However, results from linear gyrokinetic simulations in [53] suggest that the role of Te/Ti is only secondary for the TEM ↔ ITG transitions compared to the impact of ν* and R/LTe. With increasing radial position, both the trapped particle fraction and the collisionality increase. The latter effect prevails and this reduces the instability domain with TEM dominance and broadens that with ITG dominance when moving from mid-radius to the plasma edge. Interestingly, all of the points practically populate a single curve when plotted on the space diagram provided by the electron to ion temperature ratio and the collisionality (figure 16, right plot).

Figure 16. Dominant instability for all hydrogen plasmas in the database at two radial positions, r/a = 0.5 (left) and r/a = 0.80 (middle). For ITG, the real frequency is ωr < 0 in TGLF convention; for TEM, it is ωr > 0 in TGLF convention. In the right plot, the same data points are presented in the dimensionless space diagram provided by the electron–ion collision frequency normalized to the ratio of the sound speed to the connection length qR (x-axis) and the electron to ion temperature ratio (y-axis, right plot). The points practically reorganize on a single curve.
Download figure:
Standard image High-resolution imageFor twelve hydrogen plasmas at q95 ≈ 5, a set of linear gyrokinetic simulations with GKW was performed for the two radial positions r/a = 0.53 and r/a = 0.69. The left plot of figure 17 shows a comparison between TGLF spectra and GKW spectra for a purely Ohmic (PECRH = 0 MW) plasma. As this example shows, TGLF commonly predicts some dips on the ETG scale that are not reproduced by GKW. This results in narrower ETG spectra predicted by TGLF than computed by GKW. In saturation rule SAT1geo, the constructed effective growth rate γmodel does not depend on the ETG profile if γ < kθ VZF (where VZF is the root mean squared E × B drift velocity of the fluctuating zonal flows). However, in ETG-dominated plasmas, these too narrow profiles affect γmodel and therefore also the predicted transport.

Figure 17. Left: TGLF and GKW spectra of the growth rate for a hydrogen plasma at  . Arrows mark dips in the ETG profile predicted by TGLF. Right: relative deviation between TGLF and GKW for the maximum γ/(kθ
ρs) on the ETG scale (kθ
ρs > 0). Only data points with unstable ETG modes are shown.
. Arrows mark dips in the ETG profile predicted by TGLF. Right: relative deviation between TGLF and GKW for the maximum γ/(kθ
ρs) on the ETG scale (kθ
ρs > 0). Only data points with unstable ETG modes are shown.
Download figure:
Standard image High-resolution imageClose to the edge (at r/a = 0.69), one finds a strong tendency in TGLF to underestimate electron scale growth rates whereas around mid-radius (r/a = 0.53), better predictions for γ at the ETG scale are found. This can be explained by the observation that TGLF tends to underpredict ETG growth rates at high collisionality, proportional to  (see right plot in figure 17) or high Ti/Te. The Pearson correlation between the relative deviation of max(γ/(kθ
ρs)) on the ETG scale and the collisionality ν* is − 0.52; the Pearson correlation between the relative deviation of max(γ/(kθ
ρs)) on the electron Larmor radius scale and Ti/Te is similar with −0.48.
(see right plot in figure 17) or high Ti/Te. The Pearson correlation between the relative deviation of max(γ/(kθ
ρs)) on the ETG scale and the collisionality ν* is − 0.52; the Pearson correlation between the relative deviation of max(γ/(kθ
ρs)) on the electron Larmor radius scale and Ti/Te is similar with −0.48.
6. Comparison between experiment and QuaLiKiz simulations
Simulations presented in this section were performed with the quasi-linear transport model QuaLiKiz that is based on the gyrokinetic code KineZero [18]. This model has been applied in the version 2.5.5 that allows for rapid computational times due to the numerically optimized dispersion relation solver [20]. In total, 16 processors were dedicated to QuaLiKiz computations and the boundary position was set to ρB = 0.82.
ASTRA-QuaLiKiz simulations were performed for the six different ECRH power levels (PECRH ∈ [0 MW; 4.8 MW]) of AUG shot #36774. Results for the lowest power levels are shown in figure 18; the plasmas at higher ECRH power show the same characteristics as the 2.1 MW-case. All simulations were performed with evolving density, temperature and poloidal flux profiles. The collisionality used for transport simulations was scanned by multiplying the true collisionality with values between 0.0003 and 1.0. Highest electron temperatures are predicted at 1.0 ⋅ ν* and lowest electron temperatures at 0.0003 ⋅ ν* due to the collisional stabilization of TEM turbulence.

Figure 18. Electron temperature profiles from experiment and QuaLiKiz for a hydrogen plasma at  (AUG shot #36774). The collisionality was multiplied by the values given in the legend.
Download figure:
Standard image High-resolution image
It is known that regimes with dominant electron heating (large Qe/Qi) and non-negligible collisionality are very challenging for QuaLiKiz. This is due to the strong TEM drive on the one hand and collisional stabilization of TEM on the other hand [54]. Shot #36774 is ITG-dominated for PECRH ≲ 0.5 MW and TEM-dominated at higher ECRH powers (see figure 16). For the ITG-dominated plasma at PECRH = 0 MW, reasonable predictions are obtained with QuaLiKiz for the electron temperature profile as well as for the ion temperature profile even with 1.0 ⋅ ν*. The TEM-dominated plasmas at higher PECRH, on the other hand, show significantly overestimated electron temperatures and too flat ion temperature profiles. For these plasmas, QuaLiKiz underpredicts χe/χi over a large part of the radius.
Analogous results in TEM-dominated plasmas were obtained in [54] where QuaLiKiz predicted considerable lower Qe/Qi than quasi-linear simulations with GKW. This could be the result of the Krook collision operator producing an overstabilization of TEM in TEM-dominated plasmas. Already early versions of QuaLiKiz showed such an underestimation of χe/χi at non-negligible collisionality [55].
As figure 16 shows, plasmas with the same heating power per surface element as PFPO-1 plasmas (i.e. PECRH = 1.3 MW) can be expected to be TEM-dominated at low density. Due to the heavy overestimation of central electron temperatures in TEM-dominated plasmas by QuaLiKiz, the current version of this transport model is not recommended to be used for ITER PFPO-1 predictions. A new Krook collision operator that could significantly improve QuaLiKiz is currently under development [56]. However, it should be noted that in the TEM-dominated plasmas shown in figure 18, central electron temperatures are significantly overestimated even in the nearly collisionless simulations with 0.0003 ⋅ ν*.
7. Conclusions
The quasi-linear turbulent transport models TGLF and QuaLiKiz, incorporated into the ASTRA modelling suite, were tested against a large number of stationary plasma phases from ASDEX Upgrade and JET-ILW. The database covers a large variety of different plasma conditions with the temperature ratio at mid-radius reaching values from Te/Ti = 1.1 up to Te/Ti = 5.7. In particular, plasmas with dominant electron heating and low density were studied because of their relevance for the PFPO-1 phase of ITER.
The application of a local model in these AUG and JET-ILW plasmas can be considered appropriate in general, since in these electron heated conditions the ion temperature remains relatively low (below 1 keV in AUG over a large portion of the minor radius) and thereby the ion Larmor radius is small compared to the plasma size (e.g. ρi/a is 1/275 in D and 1/390 in H plasmas at AUG and 1/350 in JET-ILW D plasmas). These values are small enough, so that limited impact can be expected from global effects [57, 58] and from direct interactions between neoclassical and turbulent transport channels [59]. Typical values of the ion heat conductivity from power balance analysis are around 2 m2 s−1 at mid-radius, whereas the neoclassical ion heat conductivities are about 20 times smaller, between 0.1 and 0.15 m2 s−1.
The incorporation of the geometric factor in TGLF-SAT1geo represents a considerable improvement compared to previous versions, especially for temperature predictions close to the edge of the plasma. In L-mode plasmas, the predicted temperature profiles follow very well the experimental profiles close to the edge which allows one to push the simulation boundary much closer to the last closed flux surface, at least until ρB = 0.95, as performed in this work. Central electron temperatures were found to be accurately predicted by TGLF with a relative deviation of only (−10 ± 6)% under PFPO-1 like conditions which gives confidence for reliable predictions of X3 ECRH absorption in PFPO-1. However, the analysis also reveals a tendency of Te and Ti to be underestimated slightly at high Te/Ti (low ν*) and overestimated at low Te/Ti (high ν*). Good predictions of the edge ion heat flux Qi,edge make TGLF well-suited to also examine H-mode accessibility in PFPO-1. It should be noted that, at least in the conditions of dominant auxiliary electron heating explored in this work, the mass dependence of heat and particle transport predicted by TGLF is in good agreement with experimental results and theoretical expectations. This provides indications that TGLF can reliably simulate hydrogen plasmas for PFPO-1, although being calibrated exclusively on deuterium plasmas.
QuaLiKiz was found to provide reliable predictions only for ITG-dominated plasmas. The too strong stabilization of trapped electron turbulence results in a heavy underprediction of χe/χi in TEM-dominated plasmas. Thus, central electron temperatures in TEM-dominated plasmas are seriously overpredicted by QuaLiKiz. A new collision operator that could solve this issue is currently under development [56].
Based on the above discussion, for the modelling of ITER PFPO-1 plasmas characterized by dominant auxiliary electron heating, like the AUG and JET-ILW plasmas considered in this work, it is recommended to use the TGLF-SAT1geo model, with the recently included improved geometric factor. It can also be expected that future versions of TGLF [17], which include a complete description of these geometrical effects, will be at least equally well applicable.
Acknowledgments
The authors would like to thank T. Luda di Cortemiglia, U. Plank and F. Ryter for fruitful discussions, as well as J.K. Stober and the ECRH Team at ASDEX Upgrade for their support in the performance of the AUG experiments, which reached the full nominally available ECRH power. This work has been carried out within the framework of the EUROfusion Consortium and has received funding from the Euratom research and training programme 2014–2018 and 2019–2020 under Grant agreement No. 633053. The views and opinions expressed herein do not necessarily reflect those of the European Commission.