


Abstract
The current work reports on the significant rise of the fusion triple product in experiments carried out on the compact spherical tokamak (ST) Globus-M2 with a twofold increase in the toroidal magnetic field. A tenfold rise in the n . T . τE product was recorded during an increase in the magnetic field from 0.4 to 0.8 T and the plasma current from 0.25 to 0.4 MA at an unchanged auxiliary heating power value. Limited reasons may affect this positive trend, among which are energy confinement improvement and an increase in the efficiency of neutral beam heating. Despite the increase in the magnetic field, the neutral beam injection (NBI) led to clear and reproducible transition to the H-mode accompanied by a decrease in the turbulence level at the plasma edge. It was experimentally confirmed that strong dependence of the energy confinement time on the magnetic field value is conserved at a higher magnetic field approaching 0.8 T. Enhancement of energy confinement is connected to a collisionality (ν*) decrease. While for conventional tokamaks the confinement dependence on collisionality becomes weaker with decreasing ν* dependence, in the ST, in contrast, we observe its strengthening.
Export citation and abstract BibTeX RIS
1. Introduction
The main goal of research in the field of thermonuclear fusion is to create a plasma with a sufficiently high value of the fusion triple product n . T . τE, where n and T are the plasma density and temperature, respectively, and τE is the energy confinement time that quantifies how well the thermal energy is confined in plasma. In stationary conditions it is defined as a plasma stored energy divided by the heating power absorbed by the plasma. Ignition of deuterium–tritium plasma requires a very high value of the n . T . τE product, about 3 × 10²¹ m−3 keV s (with T in the range 10–20 keV), which will allow use of the energy of the fusion reaction to build a power plant [1]. Plasma stability in a reactor is characterized by the ratio of plasma pressure to magnetic field pressure, the so-called plasma beta parameter, which in tokamaks is defined as βT ∝ n . T/BT 2, where BT is the strength of the toroidal magnetic field. In conventional tokamaks with high aspect ratios (A = R/a, where R and a are torus major and minor radii) βT is limited to a few percent due to fatal plasma magnetohydrodynamics (MHD) instability development. A decrease in the aspect ratio A = R/a to a value below 2 significantly affects MHD stability of the plasma, allowing operation with high values of the plasma pressure (p ∝ n . T) using a relatively small toroidal magnetic field [2]. Experiments carried out on tokamaks with small aspect ratios (spherical tokamaks (STs)), e.g. START [3], MAST [4], NSTX [5] and Globus-M [6], confirmed these theoretical expectations. Unfortunately, the triple product value, achieved in STs is noticeably lower than that in conventional aspect ratio machines. This letter reports on the toroidal magnetic field increase as the means of a significant increase in the triple fusion product value in STs. The main objective of the paper is an experimental investigation of plasma thermal energy confinement in the recently developed Globus-M2 ST, analysis of electron and ion perpendicular heat transport and its comparison with existing experiments at lower BT values.
2. Background conditions of the Globus-M2 experiments
Investigation of plasma thermal insulation in STs was at the frontier of modern STs' scientific programs. In the beginning, the ST community used empirical scaling, IPB98(y, 2) [7], predicting an energy confinement time (τE) for the ST's design phase. This scaling is based on the reliable data regression from a large family of conventional, or high aspect ratio, tokamaks. Further analysis has shown that the distinctive feature of STs is a strong τE dependence on the magnetic field and weak dependence on the plasma current, τE ∝ Ip 0.48–0.59 BT 1.04–1.4 [8–10], unlike in IPB98(y, 2), where τE ∝ Ip 0.93 BT 0.15. While the STs' experimental results look promising, they do not predict whether extrapolation of experiments performed on machines with BT = 0.3–0.5 T can be used for future fusion devices with low A [11]. To resolve this ambiguity, experiments need to be carried out on new generation STs with higher toroidal magnetic fields, allowing them to reach high plasma temperatures, i.e. regimes with low collisionality. Upgrades of MAST, NSTX and Globus-M allowed an increase in the toroidal magnetic field, thus extending the experimental database and improving the accuracy of energy confinement time prediction. The first campaign at the MAST-U (BT = 0.75) will be launched at the end of 2020 [12, 13]. NSTX-U (BT = 1 T), after the first promising experiments at BT ≈ 0.64 T, was closed for repair with a planned relaunch in 2022 [14, 15]. Significant improvement in plasma performance at BT above 1 T was observed in ohmic heated plasma at the ST-40 tokamak [16–18]. The results of recent NBI experiments on an ST-40 tokamak using 1 MW auxiliary power are expected to be quite intriguing due to the highest BT = 2 T [19].
3. Globus-M2 experiments on neutral beam injection at high magnetic field
The Globus-M2 tokamak [20] was designed to operate with BT up to 1 T. Experiments on the Globus-M2 were carried out with an almost twofold increase in the toroidal magnetic field (compared with Globus-M). A lower null magnetic configuration (the ion drift was directed towards the x-point) with a plasma major radius R = 0.35 m, minor radius a = 0.22 m and elongation κ = 1.9 was sustained in neutral beam (NB) heated discharge in deuterium plasma. The aspect ratio A = 1.6 is higher in comparison with MAST and NSTX, where A ≈ 1.3–1.4. Figure 1(a) shows time traces of the main parameters in a typical moderate density discharge with a plasma current Ip = 0.25 MA and toroidal magnetic field BT = 0.7 T. Transition to the H-mode occurs a few milliseconds after injection of the NB, with energy Eb = 28 keV and beam power PNBI = 0.8 MW. The beam impact parameter is equal to 32 cm, and the average pitch angle of the deposited fast ions is approximately 40°. The L–H transition is denoted by a density rise accompanied by a strong reduction in Dα emission. The subsequent activity of the edge localized modes (ELMs) indicates formation of a strong pressure gradient at the plasma edge. Another example of the transition to the H-mode, with a pronounced increase in the plasma density and the appearance of ELMs, is presented in figure 1(b). The transition was investigated using the multi-frequency Doppler backscattering (DBS) method [21, 22]. The increase in the poloidal rotation velocity near the separatrix occurred simultaneously with the appearance of the E × B drift velocity shear. The characteristic transition time is about 2 ms, and can be estimated by the decay time of the Dα signal (from 183 to 185 ms in figure 1(b)). Local changes in the amplitude of turbulence occur at much shorter times than the global confinement and precede a slow global transition to the H-mode. The velocity shear changes more slowly than the turbulence amplitude, apparently due to the fact that the velocity shear calculation requires measurements at several spatial points, significantly (by 10% of the small radius) spaced along the minor radius. The appearance of such shear is a widely observed event during the L–H transition, and can also be one of its causes through the mechanism of E × B sheared flow damping of turbulence [23–26]. A sharp drop in the scattering density fluctuations amplitude is clearly observed within a wide frequency range that happens during the transition (lower box in figure 1(b)). While there is a reduction in the turbulence amplitude, further examination of the turbulence characteristics has to be made to assess the effect of the change on the plasma transport.
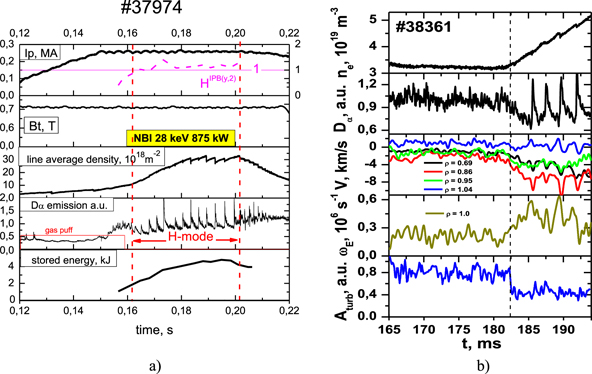
Figure 1. Typical plasma parameter waveforms for shots with Ip = 0.25 MA and BT = 0.7 T. (a) from top to bottom: plasma current, toroidal magnetic field at the plasma geometry center, line average density, Dα emission, plasma total stored energy; (b) plasma parameters during L–H transition, from top to bottom: averaged density, Dα emission, poloidal rotation velocity measured by DBS for the corresponding position, E × B shearing rate and the integrated amplitude of the fluctuations at the edge.
Download figure:
Standard image High-resolution imageTo reach the H-mode in a tokamak high heating power is usually required that exceeds the empirical threshold: Pthr = 0.042n20 0.73 BT 0.74 S0.98 [27]. Here, S is the total surface of the plasma column. Experiments on STs have shown that the threshold power increases with A decreasing. The ratio of loss power (power flowing through the plasma surface) to the threshold power Ploss/Pthr exceeds conventional scaling predictions, confirming a trend suggested by MAST and NSTX: Pthr = 0.072 . n20 0.7 . BT 0.7 . S0.9 . (Zeff/2)0.7 . F(A)0.5, where F(A) = 0.1A/f(A), f(A) = 1 − [2/(1 + A)]0.5 [28]. In accordance with ST corrected scaling the threshold for the Globus-M2 is in the range 0.08–0.1 MW, which is 4–8 times lower than the value of the loss power observed in experiments. Such a strong discrepancy emphasizes that loss power is not the best parameter for predicting L–H transition. Recent experiments have demonstrated that the ion heat flux value at the edge of the plasma column is more relevant for predicting L–H transition [29]. Modern empirical scaling based on ASDEX-U and Alcator C-mode data, Qi,L–H = 0.0029 . n19 1.05 . BT 0.68 . S0.93 [30], predicts 10–15 kW for the Globus-M2 for plasma density ne = 2–3 × 10¹⁹ m−3 at which we usually observe L–H transition. According to ASTRA simulations the ion heat flux at the edge before the transition Qi,edge is 15–30 kW, which is rather close to the value calculated using the scaling.
After transition to the H-mode, an increase in the plasma density was observed followed by the rise in the total stored energy, WDIA, measured by a diamagnetic loop (figure 1(a)). The energy confinement time in the H-mode reaches 7 ms, and the H-factor increases from 0.5 to 1.2–1.4. During the NBI pulse, a quasi-steady phase state was established, characterized by a dn/dt ≈ 0 and dWDIA/dt ≈ 0 for 10–15 ms, which is 1.5–2 times more than τE. The reverse H–L transition happens at 210 ms, immediately after the end of NBI, which is manifested by a decrease in the plasma density and ELMs vanishing. Figure 2(a) shows a comparison between the energy confinement time of the Globus-M tokamak in the basic operational regime with BT = 0.4 T and Ip = 0.2 MA, and the Globus-M2 operated at BT = 0.7–0.8 T and Ip = 0.25–0.4 MA. All the presented data were obtained under equal experimental conditions, i.e. the same plasma size and shape, the same isotopic composition (deuterium plasma and deuterium beam), the same wall conditioning technique using boronization and the same NBI power and energy. Besides a significant increase in the energy confinement time, which is connected to the BT rise, plasma current growth results in easy access to a high-density state. Achieving similar plasma density as high as 1020 m−3 in the Globus-M required a durable treatment of the plasma-facing material, which included multiple cycles of repeated heating and cleaning of the vacuum chamber by glow discharge followed by boronization [31].

Figure 2. (a) Thermal energy confinement time vs average electron density. Blue solid circles represent Globus-M data for BT = 0.4 T and Ip = 0.2 MA; green solid circles and red solid squares represent Globus-M2 with BT = 0.7 T for Ip = 0.25 MA and Ip = 0.3 MA, respectively; the solid magenta star corresponds to BT = 0.8 T and Ip = 0.4 MA. Open squares represent τE enhancement due to the Ip and BT increase assuming IPB98(y, 2) scaling, and green corresponds to Ip = 0.25 MA and red to Ip = 0.3 MA. Open circles represent τE enhancement according to Globus-M scaling carried out in [10]. (b) A comparison of the experiment confinement time values versus those predicted using equation (1) for the NBI H-mode dataset.
Download figure:
Standard image High-resolution image4. Energy confinement and plasma heating efficiency
A significant increase in the energy confinement time is observed in experiments with toroidal field and plasma current increases in the Globus-M2. Data shown in figure 2(a) demonstrate a twofold and more τE increase (solid dots) in the Globus-M2 experiment with a BT increase up to 0.7–0.8 T. At the same time, values predicted by IPB98(y, 2) and ST scalings are completely different. For a fixed ne = of 5.2 × 10¹⁹ m−3 parametric dependence of IPB98(y, 2) τE ∝ Ip 0.93 BT 0.15 predicts an increase in τE by only a factor of 1.3 (open green square) for the toroidal magnetic field and plasma current increases from 0.4 to 0.7 T and 0.2 to 0.25 MA, respectively. This value is significantly lower than those observed in the experiment −1.9 (green dots). At the same time, assuming a stronger dependence of τE on the magnetic field obtained earlier at the Globus-M τE ∝ Ip 0.48 BT 1.28 [10], one can obtain an enhancement factor of 2.1 (green open circle), which is more consistent with observations. A similar comparison can be made for ne = 6.2 × 10¹⁹; in this case, the plasma current increased up to 0.3 MA with the same change in the toroidal magnetic field. The energy confinement time increased by a factor of 2.4, which is also significantly higher than IPB98(y, 2) forecast −1.4 (red open square), and is in good agreement with the predictions for Globus-M scaling −2.4 (red open circle). The results of the comparisons are summarized in table 1. It should be emphasized that an increase in the energy confinement time is a consequence of the strong dependence of τE on the toroidal magnetic field, which confirms the trend previously observed in STs in the range of BT = 0.25–0.55 [8–10] and cannot be explained by an increase in the plasma current only.
Table 1. Thermal energy confinement time enhancement with increasing BT and Ip at the Globus-M/M2 experiment in comparison with IPB98(y, 2) and Globus-M [9] scalings.
| Average plasma | Plasma current | Plasma current | Energy confinement enhancement | ||
|---|---|---|---|---|---|
| density (1019 m−3) | for BT = 0, 4 T | for BT = 0, 7 T | Energy confinement enhancement factor expected by the corresponding scaling | factor observed in experiment | |
| case (MA) | case (MA) | ||||
|

| ||||
| 5.2 | 0, 2 | 0, 25 | 1, 3 | 2, 1 | 1, 9 |
| 6.2 | 0, 2 | 0, 3 | 1, 4 | 2, 4 | 2, 4 |
Using a common Globus-M/M2 database, it is possible to perform a regression analysis in the space of engineering parameters, yielding the following empirical formula for the Globus-M/M2 data:

The results of the regression are presented in figure 2(b).
By comparing two typical shots with the same average density of 6.5 × 10¹⁹ m−3, different BT and Ip (0.2 MA and 0.4 T vs 0.3 MA and 0.7 T), one can see significant plasma energy confinement improvement in the latter case. Figure 3(a) shows more than a twofold increase in the electron temperature throughout the plasma, which corresponds to a 2.5-fold increase in the electron stored energy, We from 1.3 kJ to 3.2 kJ. The ion temperature also rises significantly, approximately 2.5-fold, as measured by the neutral particle analyzer (NPA). Localization of the measurements was provided by the intersection of the NPA line of sight and the NB injection line that corresponds to the normalized minor radius position, r/a ≈ 0.3–0.4. The simulated ion temperature profiles using the ASTRA [32] code, assuming neoclassical ion heat diffusivity provided by NCLASS [33], fit well to the measured values. More importantly, the sum of the simulated ion stored energy Wi and calculated We using Thomson scattering (TS) data corresponds well to the WDIA measured by the diamagnetic loop. For BT = 0.7 T, Wth = We + Wi = 6 kJ, while WDIA = 6.7 kJ. The difference of 0.7 kJ corresponds to the perpendicular pressure of the fast ions, Wfast. This value is in line with NUBEAM [34, 35] simulations and full orbit modelling using the 3D-fast ion tracking algorithm [36], which gives a range of Wfast = 0.6–0.8 kJ. Consequently, the ion heat diffusivity should be close to the values estimated using the neoclassical theory, thus limiting the role of anomalous ion heat transport in the Globus-M2 H-mode to a negligible value, as it was for the lower magnetic field conditions in the Globus-M [37]. Radial profiles of electron and ion heat diffusivities (χe and χi) are presented in figures 3(c) and (d). Figures 3(c) and (d) demonstrate the results of ASTRA and NCLASS simulations: the reduction of the χe value as well as the χi value by a factor of 2–2.5 over the bulk plasma cross section that in turn leads to the τE rise.

Figure 3. Radial plasma profiles for BT = 0.4 T (blue) and BT = 0.7 T (red) discharges with density 6.5 × 10¹⁹ m−3. The dots correspond to experimental data (TS was used for electron temperature measurements, and ion temperature was measured with an NPA), and the curves represent profiles from ASTRA modelling. (a) Electron temperature, (b) ion temperature, (c) effective electron heat diffusivity derived from the power balance, (d) ion heat diffusivity calculated using the NCLASS code.
Download figure:
Standard image High-resolution image5. Collisionality scan
The so-called dimensionless analysis can help one to understand the underlying physical processes occurring in plasma that affect energy confinement. The most important dimensionless physical quantities defining perpendicular energy transport [7] are: the safety factor q ∝ BT/Ip, collisionality ν* ∝ ne/T2, the normalized Larmor radius ρ* ∝ T0.5/BT and plasma beta βT ∝ W/BT
2. The scaling for the normalized energy confinement time that is proportional to BT
τE is usually expressed in the following form BT
τE = C
 . Future fusion devices should operate in the range of sufficiently lower collisionality, while q and βT values will be close to the parameters of the existing machines. In this connection the extrapolation of the experimental data to lower ν* is the most interesting. In previous research in STs a rather strong dependence was carried out, BT
τE ∝ ν*
−0.46÷−0.85, [10, 38, 39]. However, the analysis of the multimachine database has shown that the collisionality exponent index depends on collisionality itself [40]. For high collisionality regimes at JET, DIII-D and Alcator-CMOD, αν
values are similar to those obtained in STs for the same ν* range: αν
−0.5 ÷ −0.75 (see figure 2 in 40] for more details). For the lower collisionality regimes the dependence of BT
τE
on ν* becomes weaker, yielding the well-known relation BT
τE ∝ ν*
−0.01 [7], thus questioning the impact of the aspect ratio on energyconfinement.
. Future fusion devices should operate in the range of sufficiently lower collisionality, while q and βT values will be close to the parameters of the existing machines. In this connection the extrapolation of the experimental data to lower ν* is the most interesting. In previous research in STs a rather strong dependence was carried out, BT
τE ∝ ν*
−0.46÷−0.85, [10, 38, 39]. However, the analysis of the multimachine database has shown that the collisionality exponent index depends on collisionality itself [40]. For high collisionality regimes at JET, DIII-D and Alcator-CMOD, αν
values are similar to those obtained in STs for the same ν* range: αν
−0.5 ÷ −0.75 (see figure 2 in 40] for more details). For the lower collisionality regimes the dependence of BT
τE
on ν* becomes weaker, yielding the well-known relation BT
τE ∝ ν*
−0.01 [7], thus questioning the impact of the aspect ratio on energyconfinement.
The sum of the Ip and BT exponents (αI and αBT, respectively) is controlled mainly by collisionality scaling if the gyro-Bohm transport is assumed [8,41]. For collisionality-independent scaling similar to IPB98(y, 2), the sum is αI + αBT = 0.8–1.1. The obtained sum of exponents from the scaling (1) αI + αBT = 1.62 is higher assuming the presence of strong or moderate dependence of the normalized energy confinement time on collisionality. Normalized energy confinement time dependence BT
τE ∝  was analyzed in the following range of dimensionless parameters: q = 2.5–3, ρ* = 0.025–0.033 and βT = 0.03–0.04. To estimate the collisionality we used the volume-averaged temperature: T = W/(3 . V . ne). An increase in the toroidal magnetic field of the Globus-M2 tokamak made it possible to reach lower (in comparison with the previous Globus-M data with BT = 0.5 T) collisionality values, where a strong increase in BT
τE is observed (see figure 4). As the collisionality decreases |αν
| increases from the 0.46 that was discovered previously [10] up to 1.05. Finally, taking into account the impact of the ρ* variation within Bohm (BT
τE ∝ ρ*−2) and gyroBohm (BT
τE ∝ ρ*−3) assumptions we obtain very strong dependence of confinement on collisionality BT
τE ∝ ν*−1.1±0.1. What is important is that this result indicates the opposite trend in the ST to those discovered from the multi-machine data analysis in 40. While for conventional tokamaks the confinement dependence on collisionality becomes weaker with decreasing ν* dependence, in the ST, we observe, in contrast, its strengthening.
was analyzed in the following range of dimensionless parameters: q = 2.5–3, ρ* = 0.025–0.033 and βT = 0.03–0.04. To estimate the collisionality we used the volume-averaged temperature: T = W/(3 . V . ne). An increase in the toroidal magnetic field of the Globus-M2 tokamak made it possible to reach lower (in comparison with the previous Globus-M data with BT = 0.5 T) collisionality values, where a strong increase in BT
τE is observed (see figure 4). As the collisionality decreases |αν
| increases from the 0.46 that was discovered previously [10] up to 1.05. Finally, taking into account the impact of the ρ* variation within Bohm (BT
τE ∝ ρ*−2) and gyroBohm (BT
τE ∝ ρ*−3) assumptions we obtain very strong dependence of confinement on collisionality BT
τE ∝ ν*−1.1±0.1. What is important is that this result indicates the opposite trend in the ST to those discovered from the multi-machine data analysis in 40. While for conventional tokamaks the confinement dependence on collisionality becomes weaker with decreasing ν* dependence, in the ST, we observe, in contrast, its strengthening.
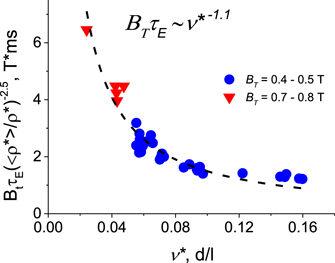
Figure 4. Normalized energy confinement corrected for ρ* variation vs collisionality. The range of dimensionless parameters are q = 2.5–3, ρ* = 0.025–0.033 and β = 0.03–0.04.
Download figure:
Standard image High-resolution image6. Discussion
The observed dependence of energy confinement time on collisionality is the most intriguing phenomena in ST transport research. Gyrokinetic (GK) simulations of ST plasmas are very complicated since it is crucial to take into account many effects simultaneously, including: realistic equilibrium at low aspect ratio and high-β, fully electromagnetic perturbations, collisions, multiple kinetic species, toroidal flow and flow shear 44. Significant efforts were made to study plasma turbulence and to verify GK simulations (also including global non-linear simulations) against the direct measurements at the ion scales on MAST [41–44] and on NSTX at both ion and electron scales [40, 45–50]. For H-mode plasmas in STs ion heat diffusivity is often close to the values predicted by the neoclassical theory, while electron thermal transport is always anomalous in all operational regimes and can limit the overall global energy confinement. The most possible mechanisms for experimentally observed scaling of confinement time that is inversely proportional to the collisionality are as follows. A high-k electron temperature gradient mode was found to be responsible for driving anomalous electron heat transport in some low- and high-β NSTX plasma [45, 46, 51]. While electron heat diffusivity is not expected to depend on collisionality χe ∼ ν*0 for electron temperature gradient (ETG) [40], it was found that a reduction in R/LTe (where LTe is the electron temperature gradient scale length) with decreasing ν* leads to ETG stabilization [34]. Also, ETG turbulence may have a collisionality dependence due to the coupling to low frequency zonal flow and geodesic acoustic modes (GAM) induced by energetic particles (e) (e-GAM) [52–54]. Micro tearing mode (MTM) is also often predicted to be unstable in neutral beam heated ST plasma for relatively high β. Electron heat diffusivity caused by MTM decreases with decreasing collisionality [55] that is consistent with ST experiments, and electron thermal transport driven by MTM is expected to be weak in the low collisionality regime of future STs (see [48] and references therein). Recent analysis, including linear GK simulations using the GENE code [56], have shown evidence of the presence of both ETG and micro-tearing (MT) modes in the plasma core of the plasma in Globus-M and Globus-M2 [57–59].
7. Conclusion
Taken together, the results presented in the article demonstrated for the first time that the strong dependence of the thermal energy confinement time on the toroidal magnetic field, observed earlier in STs, was experimentally extended to toroidal magnetic field values up to 0.7–0.8 T. Despite the increase in the magnetic field, the NBI led to clear and reproducible transition to the H-mode. A twofold BT increase in the Globus-M tokamak enhances the synergistic effect of improving both electron and ion thermal insulation with decreasing collisionality. The latter drastically affects tokamak performance; figure 5 illustrates the change in the values of the fusion triple product obtained at the Globus-M2 tokamak depending on the toroidal magnetic field. From the figure one can see that an increase in the toroidal magnetic field from 0.4 to 0.8 T leads to a tenfold growth of the nTτE value. For shots with approximately the same density (6.7 × 10¹⁹ vs 7 × 10¹⁹ m−3) the averaged plasma temperature increases fourfold (from 140 eV up to 560 eV), while the energy confinement time increases by a factor of 2.7 (from 4 ms up to 11 ms). It is quite important that observed strengthening of the energy confinement time dependence on collisionality with a decrease in the latter suggests a quite favorable forecast for the plasma parameters of the fusion reactor or fusion neutron source based on the ST concept.

Figure 5. The fusion triple product obtained at the Globus-M2 tokamak vs the toroidal magnetic field.
Download figure:
Standard image High-resolution image
Acknowledgments
Energy confinement and plasma heating efficiency investigation presented in sections 'Energy confinement and plasma heating efficiency', 'Collisionality scan' including measurements of the plasma total stored energy by diamagnetic loop, radiation losses by SPD arrays, electron temperature by Thomson scattering, ion temperature by NPA, data processing and transport modeling using ASTRA code, estimation of NBI absorbed power and fast particles confinement simulation were financially supported by RSF research project No. 17- 72-20076. Experiments described in section 'Globus-M2 experiments on neutral beam injection at high magnetic field' were supported by Ioffe Institute and were carried out at the Unique Scientific Facility 'Spherical Tokamak Globus-M', which is incorporated in the Federal Joint Research Center'Materials Science and Characterization in Advanced Technology' (uniqueproject identifier RFMEFI62119X0021).